Abstract
In vitro proliferation of hematopoietic stem cells requires costimulation by multiple regulatory factors whereas expansion of lineage-committed progenitor cells generated by stem cells usually requires only a single factor. The distinct requirement of factors for proliferation coincides with the differential temporal expression of the subunits of cytokine receptors during early stem cell differentiation. In this study, we explored the underlying mechanism of the requirement of costimulation in a hematopoietic progenitor cell line TF-1. We found that granulocyte-macrophage colony-stimulating factor (GM-CSF) optimally activated proliferation of TF-1 cells regardless of the presence or absence of stem cell factor (SCF). However, interleukin-5 (IL-5) alone sustained survival of TF-1 cells and required costimulation of SCF for optimal proliferation. The synergistic effect of SCF was partly due to its anti-apoptosis activity. Overexpression of the IL-5 receptor subunit (IL5R) in TF-1 cells by genetic selection or retroviral infection also resumed optimal proliferation due to correction of the defect in apoptosis suppression. Exogenous expression of an oncogenic anti-apoptosis protein, Bcl-2, conferred on TF-1 cells an IL-5–dependent phenotype. In summary, our data suggested SCF costimulation is only necessary when the expression level of IL5R is low and apoptosis suppression is defective in the signal transduction of IL-5. Expression of Bcl-2 proteins released the growth restriction of the progenitor cells and may be implicated in leukemia formation.
HEMATOPOIESIS IS A complex process in which a small population of stem cells is needed to generate continuously large populations of mature cells in eight major lineages. These diverse proliferative, differentiative, and maturation events are achieved by a network of multiple hematopoietic regulatory molecules, including stem cell factor (SCF), interleukins (IL), and colony-stimulating factors (CSF). Early studies using in vitro colony formation assay discovered that a combination of two or more regulatory factors was required to stimulate the proliferation of highly purified stem cells whereas lineage-committed progenitor cells can be stimulated to proliferate by single regulators.1-5 Notably, when cells were treated with granulocyte CSF (G-CSF), granulocyte-macrophage CSF (GM-CSF), IL-3, or IL-6, they formed small colonies of committed progenitor cells in various hematopoietic lineages. However, when the cells were cultured in combination with SCF there was a consistent 10-fold to 20-fold increase of cell numbers per colony. The lineage spectrum of these committed progenitors did not change when the fractionated stem cells were incubated in the presence of CSF with or without SCF.1-5
It has been suggested that hematopoiesis is regulated by the sequential interaction of regulators present in the microenvironment with the corresponding receptors present on the cellular surface (see reviews6,7). Changes in growth factor requirements during the progression of differentiation may reflect the hierarchy of cytokine receptor expression and function. To clarify how the activation of lineage-restricted growth factor receptor genes is coupled with the activation of the corresponding differentiation program, the pattern of expression of several hematopoietic growth factor receptor genes during the differentiation has been studied. In the most undifferentiated stem cell population, the α subunit of the IL-3 receptor was clearly expressed and the expression remained throughout the differentiation process.6 The common β subunit of IL-3, IL-5, and GM-CSF receptor (βc) and the α subunit of the GM-CSF receptor (GMRα) were expressed in low levels in stem cells, but their expression increased in the differentiated progenitor population.8 The differential temporal expression of receptor subunit genes in vitro was consistent with the flow cytometric study in hematopoietic stem and progenitor cell populations purified from bone marrow.9 However, the underlying molecular mechanism of the hierarchical response of the cells to cytokine during the differentiation program is not yet clear.
TF-1 is an immortalized cytokine-dependent cell line established from the bone marrow of an erythroleukemic patient.10 In many aspects TF-1 cells represent the multiple-lineage progenitor cells that acquire an ability of unlimited self-renewal and lose the ability of differentiation commitment. Our study and other studies showed that TF-1 cells not only expressed CD34 surface marker10 and were responsive to SCF,11 but also differentially expressed the α subunits of the IL-5 receptor and the GM-CSF receptor.12 Interestingly, TF-1 cells also manifested distinct proliferation response toward IL-5 and GM-CSF. GM-CSF alone efficiently stimulated the optimal proliferation of TF-1 cells, but IL-5 could only sustain the viable cell number.12
In the present study, we explored the molecular mechanism of the necessity of multifactor costimulation in TF-1 progenitor cells for optimal proliferation. Our results suggest that SCF costimulation is required only when the expression level of IL5Rα is low and apoptosis suppression is defective in the signal transduction of IL-5. Furthermore, increased expression of IL5Rα or Bcl-2 protein released the requirement of SCF for maximum proliferation of TF-1 in medium containing IL-5.
MATERIALS AND METHODS
Cell lines, culture conditions, and cytokines.
The TF-1 cell line10 and its variant, JYTF-1,12were both maintained in RPMI1640 supplemented with 10% fetal bovine serum (FBS), 50 μmol/L β-mercaptoethanol, 2 mmol/L L-glutamine, 100 u/mL penicillin G, 100 μg/mL streptomycin, and 2 ng/mL GM-CSF. TFα1 and TFα8 were two hIL5Rα overexpressing subclones of the TF-1 cell line and were maintained in the same medium as described for TF-1 except 200 μg/mL of G418 was supplemented. TF/Bcl-2 was a pool of mixed Bcl-2 overexpressing TF-1 subclones. This pool of cells was established by Chao et al13 and was maintained in the same medium as that for TFα1 cells. Recombinant human GM-CSF, IL-3, IL-5, and SCF were purchased from R & D Systems (Minneapolis, MN).
Cell proliferation and DNA synthesis assay.
For analyzing proliferation activity, cells were cultured in the indicated growth medium at a density of 2 × 10⁵cells/mL. The numbers of viable cells were monitored daily by trypan blue exclusion assay. DNA synthesis rate (cpm/10,000 cells/h or cpm/20,000 cells/h as indicated) was measured by the [3H]thymidine pulse-labeling assay as previously described12 with slight modification. In brief, 2 × 10⁵ cells were cultured in the indicated medium for 48 hours, then 1 × 10⁴ or 2 × 10⁴viable cells were seeded in a 96-well plate and 1 μCi of [3H]thymidine was added. After 1 hour of incubation, the labeled cells were harvested and lysed with FilterMate cell harvester (Parkard Instrument Co, Canberra, Australia). Samples were counted in a microplate scintillation counter (Parkard Instrument Co).
Surface IL-5Rα staining for flow cytometric analysis.
For analyzing surface expression of IL-5Rα, one million rapidly growing cells were washed twice with ice-cold phosphate-buffered saline (PBS) and resuspended in 1 mL staining buffer (2% FBS and 0.1% sodium azide in PBS) and kept on ice for 30 minutes. The cells were pelleted, mixed with 0.5 μg of primary antibody (antihuman IL-5Rα antibody A14 was a gift of Dr Charles Shih of PharMingen, San Diego, CA), and incubated on ice for 1 hour. After washing twice with staining buffer, the cells were incubated with fluorescein isothiocyanate (FITC)-conjugated goat antimouse antibody (Zymed, Carlton Court, South San Francisco, CA) for 45 minutes on ice. Fluorescence intensity of surface bound antibody was analyzed by FACScan (Becton Dickinson, Mountain View, CA) after removal of unbound secondary antibody.
Bromodeoxyuridine (BrdU) labeling and propidium iodide (PI) staining for cell cycle analysis.
Cell cycle analysis of BrdU-labeled and PI-stained cells was performed according to the manufacturer’s instruction (Becton Dickinson Immunocytometry System, San Jose, CA) with slight modifications. Three to five million cells were cultured in the indicated medium for 24 hours before labeling with 10 μmol/L BrdU for 1 hour. Cells were then washed and fixed overnight in ice-cold methanol. After denaturation as described by the vender’s manual, cells were stained in 5 μg/50 μL of FITC-conjugated anti-BrdU antibody at 37°C for 30 minutes. Before flow cytometric analysis, cells were stained with 1 μg/mL of PI (Sigma, St Louis, MO) and treated with 100 U/mL of RNaseA (Worthington Biochemical Corp, Freehold, NJ) in 0.1% glucose at room temperature for 30 minutes.
Histone releasing assay and DNA fragmentation analysis.
Two methods were employed to monitor the relative activity of apoptosis. Histone releasing assay (Boehringer Mannheim) is an enzyme-linked immunosorbent assay (ELISA) for the detection of cytoplasmic histone-associated-DNA-fragments after induction of apoptosis. It was performed according to the instructions of the manufacturer. Briefly, 1 × 10⁴ cells were seeded in a 96-well plate in the indicated medium. After 24 hours of incubation, cells were pelleted in the bottom and lysed to release the cytosolic contents. An aliquot of lysate was placed into a streptavidin precoated 96-well plate. Subsequently, a mixture of biotin conjugated antihistone antibody and peroxidase conjugated anti-DNA antibody were added and incubated for 2 hours. After removal of unbound antibodies, the amount of the bound nucleosomes was photometrically determined with 2,2′-Azino-di[3-ethylbenz-thiazolin-sulfonat] (ABTS) as a substrate. After reaction, the absorption optical density at 405 nm was measured by a THERMOmax microplate reader (Molecular Devices, Menlo Park, CA). The DNA fragmentation was analyzed as previously described.12 In brief, 1 million cells were cultured for 24 hours in the indicated medium, then washed, centrifuged, and resuspended in 50 μL of Williams lysis buffer (50 mmol/L Tris HCl, pH 8.0, 10 mmol/L EDTA, 0.5% Sarkosyl, and 500 μg/mL proteinase K) and incubated at 50°C for 3 hours. The samples were incubated for 1 hour at 37°C after addition of 10 μL of RNase A (2 mg/mL). After addition of 1 μL of ethidium bromide (10 mg/mL), the samples were extracted with an equal volume of phenol/chloroform (1:1), and stored at 4°C after the addition of 10 μL of 1% low melting agarose solution containing 10 mmol/L EDTA (pH 8.0). Samples were melted at 70°C and allowed to solidify inside the well before electrophoresis was initiated.
Phase contrast microscopy.
Phase contrast micrography was conducted as previously described.12 The photos were taken from three different fields for each sample, and a total of 300 to 500 cells were counted for each sample.
Retroviral construct and viral infection.
The entire coding region of hIL5Rα complementary DNA (cDNA) was released from pSG5IL5Rα by EcoRI digestion and cloned into the EcoRI site of pBabeNeo14 to yield pBabeNeohIL5Rα. This plasmid was then introduced into PA317 amphotropic packaging cells obtained from American Type Culture Collection (Rockville, MD). Stable packaging subclones were selected in the presence of 400 μg/mL of G418 by the standard procedure. Infectious virus was collected as a 24-hour conditioned supernatant from the virus-producing PA317 subclones and was used to infect TF-1 cells in the presence of 8 μg/mL of polybrene. Many independent stable infected subclones were established under the selection of G418 for two weeks.
Northern blot analysis.
Total RNA was isolated from cultured cells by the modified acidic phenol method described by Wilkinson.15 Twenty micrograms of each RNA sample was separated in 1% formaldehyde agarose gel and transferred to a Hybond N+ membrane (Amersham, Little Chalfont, Buckinghamshire, UK). The RNA blot was probed with [α-32P]-dCTP labeled cDNA for the hIL5Rα and G3PDH genes.
Western blot analysis.
Two hundred microgram lysates were subjected to standard Western blot analysis as previously described.16 After binding with horseradish peroxidase conjugated secondary antibodies, blots were visualized with an ECL detection system (Amersham). The anti–Bcl-2 antibody (N-19) and anti-Bax antibody (N-20) were purchased from Santa Cruz Biotechnology (Santa Cruz, CA). Monoclonal anti-α tubulin antibody was purchased from Amersham.
RESULTS
SCF enhances the proliferation effect of IL-5 but not GM-CSF in TF-1 cells.
Proliferation is defined in this report as the phenomenon of an increase of viable cell number in a given cell population. A successful proliferation under certain culture conditions is usually governed by the capabilities of cells that undergo mitogenesis, which is defined as an ability of cells to enter S phase and replicate DNA, and prevent apoptosis in individual cells. With the lack of either one of these capabilities, cytokines may only support survival or suboptimal proliferation of the target cells.
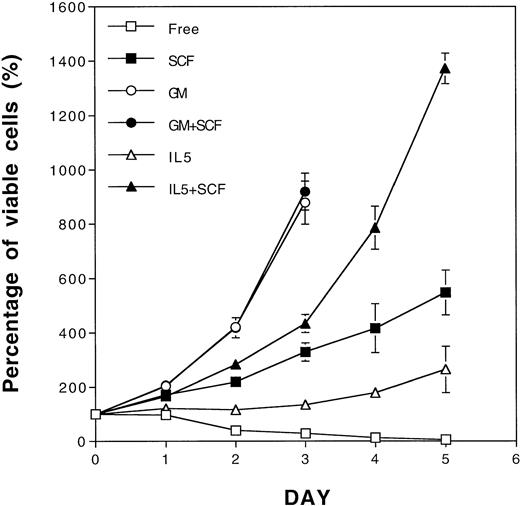
In a previous study, SCF in the GM-CSF–dependent cell lines was shown to act more as a survival factor and not a proliferation factor due to its ability to sustain viable cell numbers.11 In another study, a synergistic proliferation effect of SCF and IL-3 was only observed when SCF was cocultivated with low concentrations of IL-3 in an IL-3–dependent cell line.17 To extend the findings of the synergistic ability of SCF, we explored the possibility for SCF to complement the defective antiapoptotic effect of IL-5 in a GM-CSF–dependent TF-1 cell line. As shown in Fig 1, TF-1 cells only survived in IL-5–containing medium, but partially proliferated in SCF-containing medium (Fig 1). A synergistic proliferative response between IL-5 and SCF was clearly observed when TF-1 cells were costimulated with both factors for more than 3 days, and this phenomenon became even more obvious thereafter (Fig 1). SCF enhanced the growth of TF-1 cells cultured in all concentrations of IL-5 tested (data not shown), which is in contrast to previous observations using IL-317 (see below). Interestingly, GM-CSF, in its optimal concentration, stimulated the proliferation of TF-1 cells maximally regardless of the presence or absence of SCF (Fig 1). Therefore, TF-1 cells manifested a differential requirement of SCF costimulation in media containing IL-5 or GM-CSF for optimal proliferation.
Proliferation synergism of SCF with IL-5 in TF-1 cells. Rapid growing TF-1 cells were washed and cultured separately in cytokine-free medium (□), SCF (50 ng/mL, ▪), GM-CSF (2 ng/mL, ○), GM-CSF+SCF (•), IL-5 (5 ng/mL, ▵), or IL-5 + SCF (▴)-containing medium. The viable cell numbers were determined daily by trypan blue staining and are shown as the percentage of the initial viable cell number. Each number represents the average from four independent duplicated experiments. The standard deviations are indicated as error bars.
Proliferation synergism of SCF with IL-5 in TF-1 cells. Rapid growing TF-1 cells were washed and cultured separately in cytokine-free medium (□), SCF (50 ng/mL, ▪), GM-CSF (2 ng/mL, ○), GM-CSF+SCF (•), IL-5 (5 ng/mL, ▵), or IL-5 + SCF (▴)-containing medium. The viable cell numbers were determined daily by trypan blue staining and are shown as the percentage of the initial viable cell number. Each number represents the average from four independent duplicated experiments. The standard deviations are indicated as error bars.
The synergy of SCF is partly due to its antiapoptosis activity.
We next explored whether the synergistic proliferation of TF-1 cells in medium containing SCF and IL-5 was due to increased mitogenesis, decreased apoptosis, or both. Because TF-1 cells manifested differential growth rates in various culture media, we first examined the possibility of alteration of cell cycle distribution among viable cells in these culture conditions. Using BrdU-labeling and PI staining, we clearly showed that there was no obvious alteration of cell cycle distribution under all culture conditions examined (Fig 2A). The percentages of cells in the G1, S, and G2/M phases were generally about 37% ± 2%, 52% ± 2%, and 9% ± 1%, respectively, regardless of whether the cells were cultured in GM-CSF–, IL-5–, SCF-, or IL-5 + SCF-containing medium, or cytokine-free medium (Fig2A). We next investigated the DNA synthesis rate in an equal number of viable cells grown under various culture conditions. As shown in Fig2B, [3H]thymidine pulse-labeling assay showed that although SCF promoted mitogenic activity (Fig 2B, column SCF) at a level comparable to that achieved by IL-5 (Fig 2B, column IL5), neither synergism nor addition of mitogenic activity was observed in TF-1 cells costimulated with SCF and IL-5 (Fig 2B, column IL5 + SCF). Therefore, the synergism of proliferation was not due to the increase of mitogenic activity of TF-1 cells. On the other hand, SCF showed a dose-dependent suppression of apoptosis in TF-1 cells in a DNA fragmentation assay (data not shown). Interestingly, this suppression effect was never complete when TF-1 cells were treated with SCF at concentration up to 50 ng/mL (Fig 3A, lane 6). IL-5 was partially defective in suppression of apoptosis and a clear DNA ladder could be observed in the DNA fragmentation assay (Fig 3A, lane 4). This defect was rescued by SCF (Fig 3A, lane 5). Consistent with these observations, a quantitative measurement of apoptosis by histone release assay further showed a synergistic antiapoptosis effect between SCF and IL-5. As shown in Fig 3B, the apoptosis suppression activity of IL-5 was about half of that of GM-CSF, and this suppression activity was further suppressed when IL-5 was combined with SCF. When the efficiency of apoptosis suppression by GM-CSF was set as 100% and that under cytokine-free condition as 0%, IL-5 suppressed apoptosis with about 52% efficiency (Fig 3B, column IL5). SCF suppressed apoptosis with about 77% efficiency (Fig 3B, column SCF). When TF-1 cells were costimulated with optimal concentrations of both SCF and IL-5, apoptosis was further suppressed, up to 92% (Fig 3B, column IL5 + SCF). This synergism was highly reproducible and significant (P << .001). Although other factors cannot be excluded, our data suggested that the synergism in proliferation could partially be contributed by the synergism in antiapoptosis activity.
IL-5 in combination with SCF had no additional mitogenic activity. (A) Cell cycle distribution of TF-1 cells cultured in various combinations of cytokines. TF-1 cells were cultured in the indicated media as described in Fig 1 for 24 hours before BrdU-labeling and PI staining as described in Materials and Methods. Similar numbers of viable cells were analyzed for the percentages of cells in the G1, S, and G2/M phases and results are shown within the panel. The cytokines present in each culture medium are also indicated inside the panels. The x-axis represents the intensity of PI fluorescence and the y-axis represents the intensity of FITC-conjugated anti-BrdU antibody fluorescence. These plots are a set of representative results and the percentages of cells in various cell cycle stages are the averages from four independent determinations. (B) DNA synthesis rates of TF-1 cells cultured in various combinations of cytokines. TF-1 cells were cultured in the indicated media for 48 hours and ten thousand viable cells were subjected to [3H]thymidine incorporation assay to determine the DNA synthesis rate. The data shown are the averages of four independent triplicated experiments.
IL-5 in combination with SCF had no additional mitogenic activity. (A) Cell cycle distribution of TF-1 cells cultured in various combinations of cytokines. TF-1 cells were cultured in the indicated media as described in Fig 1 for 24 hours before BrdU-labeling and PI staining as described in Materials and Methods. Similar numbers of viable cells were analyzed for the percentages of cells in the G1, S, and G2/M phases and results are shown within the panel. The cytokines present in each culture medium are also indicated inside the panels. The x-axis represents the intensity of PI fluorescence and the y-axis represents the intensity of FITC-conjugated anti-BrdU antibody fluorescence. These plots are a set of representative results and the percentages of cells in various cell cycle stages are the averages from four independent determinations. (B) DNA synthesis rates of TF-1 cells cultured in various combinations of cytokines. TF-1 cells were cultured in the indicated media for 48 hours and ten thousand viable cells were subjected to [3H]thymidine incorporation assay to determine the DNA synthesis rate. The data shown are the averages of four independent triplicated experiments.
Synergistic antiapoptotic activity of SCF and IL-5 in TF-1 cells. (A) DNA fragmentation assay. The genomic DNA was prepared from TF-1 cells treated with various combinations of cytokines as indicated in the figure and was subjected to agarose gel electrophoresis. The dose of cytokines used in these experiments was identical to those used in Fig 1. (B) Histone releasing assay. TF-1 cells were cultivated in the indicated cytokines and the released cytosolic contents were subjected to histone measurement according to the manufacturer’s instruction. Data shown are the averages of two independent duplicated experiments. The difference between the values in columns SCF and IL5 + SCF was statistically significant (P<< .001). The relative antiapoptotic activities for cells cultured in various conditions are referred to that of cells in cytokine-free medium (set as 0%) and in GM-CSF–containing medium (set as 100%) and are shown underneath the bar graph.
Synergistic antiapoptotic activity of SCF and IL-5 in TF-1 cells. (A) DNA fragmentation assay. The genomic DNA was prepared from TF-1 cells treated with various combinations of cytokines as indicated in the figure and was subjected to agarose gel electrophoresis. The dose of cytokines used in these experiments was identical to those used in Fig 1. (B) Histone releasing assay. TF-1 cells were cultivated in the indicated cytokines and the released cytosolic contents were subjected to histone measurement according to the manufacturer’s instruction. Data shown are the averages of two independent duplicated experiments. The difference between the values in columns SCF and IL5 + SCF was statistically significant (P<< .001). The relative antiapoptotic activities for cells cultured in various conditions are referred to that of cells in cytokine-free medium (set as 0%) and in GM-CSF–containing medium (set as 100%) and are shown underneath the bar graph.
High level expression of IL5Rα also results in apoptosis suppression.
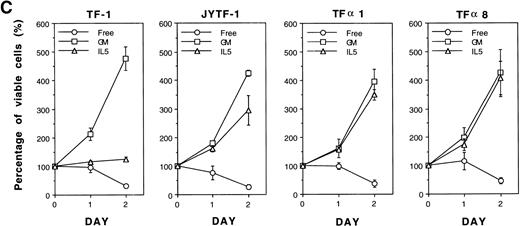
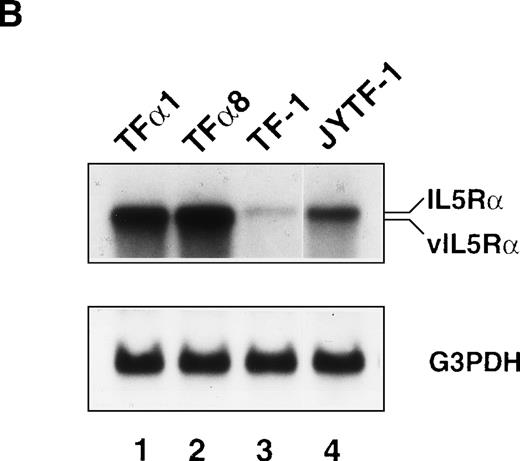
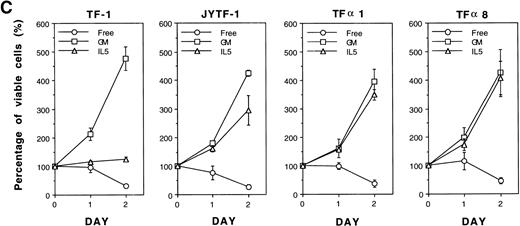
In our previous study we successfully isolated a variant of the TF-1 cell line, JYTF-1, which proliferated well in IL-5 and had an increased expression of IL5Rα.12 One possible explanation for why IL-5 cannot support the long-term growth of parental TF-1 cells is that there may be a mutation in the IL5Rα gene that renders its gene product nonresponsive to IL-5. In the present study, we ruled out this possibility by sequencing the PCR-amplified cDNA from TF-1 cells. The result showed that the sequence of IL5Rα in parental TF-1 cells was identical to the published sequence of IL-5R (data not shown). Because JYTF-1 cells had an increased expression of the IL5Rα gene, we performed gene transfer experiments to determine whether the high-level expression of IL5Rα rescues the antiapoptosis defect and confers the phenotype of IL-5–dependent growth in parental TF-1 cells. A retroviral expression plasmid of IL5Rα was constructed and transferred into TF-1 cells by virus infection. Several stable transfectants of IL5Rα were established after retroviral infection and G418 selection. Surface overexpression of hIL5Rα protein was further confirmed (Fig 4A) by indirect immunofluorescence staining and flow cytometric analysis with a mouse monoclonal anti-hIL5Rα antibody A14. TF-1 cells expressed the lowest level of hIL5Rα on individual cells, JYTF-1 expressed about three times more hIL5Rα, and both TFα1 and TFα8 cells expressed the highest amount of hIL5Rα (about 10 times more). The expression levels of βc were also checked with specific mouse monoclonal antihuman βc antibody and the results confirmed similar expression levels of βc in all cell lines (data not shown). The expression of virus-derived hIL5Rα messenger RNA (mRNA) was confirmed by Northern blot analysis (Fig 4B). A hybridization signal (∼5 kb) that moved slightly faster than that of the endogenous full-length hIL5Rα mRNA (∼6 kb) was observed in two representative transfectants, TFα1 and TFα8 (Fig4B, vIL5Rα v IL5Rα). Quantitatively, TF-1 cells expressed the lowest level of IL5Rα. JYTF-1 cells expressed about six times more IL5Rα than TF-1 cells, and TFα1 and TFα8 expressed 13 and 16 times more than TF-1 cells, respectively (densitometric analysis, data not shown). The growth property of transfectants were then compared with that of TF-1 and JYTF-1 cells in the presence or absence of IL-5. In the presence of IL-5, TFα1, and TFα8 grew very well and the growth rate was comparable to the same cells cultivated in medium containing GM-CSF, whereas TF-1 cells in IL-5 only survived and JYTF-1 grew at a suboptimal rate (Fig 4C). The growth rates of TFα8 cells were not further stimulated when cells were cultured in a combination of IL-5 and SCF (see below). These results strongly suggested that high-level expression of IL5Rα ensured optimal proliferation of the hematopoitic progenitor cell line in response to IL-5 in an SCF-independent manner.
Establishment of hIL5R overexpressing TF-1 cells. (A) Surface expression of hIL5R protein in TF-1, JYTF-1, and hIL5R transfectants TF1 and TF8 cells. The target cells were cultured in IL-5 for 24 hours and then subjected to flow cytometric analysis as described in Materials and Methods. The primary antibody was either a control mouse IgG (dashed line) or a mouse monoclonal anti-hIL5R antibody (solid line). The X-axis indicates the viable cell number and the Y-axis shows the fluorescence intensity. (B) Expression of the virus-derived IL5R mRNA in TF1 and TF8 cells. Total RNA was isolated from the indicated cell lines and 20 μg of RNA was analyzed by Northern blot hybridization. Probes used were cDNA-specific for the IL5R gene (upper panel) or for the glyceraldehyde-3–phosphate dehydrogenase (G3PDH) gene (lower panel), which were used as internal controls for the loading control. The positions of the endogenous full-length IL5R mRNA (IL5R) and the virus-encoded IL5R mRNA (v IL5R) are indicated at the right-hand side of the figure. (C) Distinct growth curve of TF-1, JYTF-1, TF1, and TF8 cells in IL-5. Cells were grown in the absence of cytokine (○) or in the presence of GM-CSF (□) or IL-5 (▵) at densities of 5 × 10⁵ cells/mL and 1 × 10⁵ cells/mL (GM-CSF and IL-5), respectively. Viable cell number was counted at 0 hours, 24 hours (day 1), and 48 hours (day 2) after seeding and was converted into the percentage of initial cell number (at day 0) as shown on the left-hand side of each plot. Each value is the average of four independent measurements.
Establishment of hIL5R overexpressing TF-1 cells. (A) Surface expression of hIL5R protein in TF-1, JYTF-1, and hIL5R transfectants TF1 and TF8 cells. The target cells were cultured in IL-5 for 24 hours and then subjected to flow cytometric analysis as described in Materials and Methods. The primary antibody was either a control mouse IgG (dashed line) or a mouse monoclonal anti-hIL5R antibody (solid line). The X-axis indicates the viable cell number and the Y-axis shows the fluorescence intensity. (B) Expression of the virus-derived IL5R mRNA in TF1 and TF8 cells. Total RNA was isolated from the indicated cell lines and 20 μg of RNA was analyzed by Northern blot hybridization. Probes used were cDNA-specific for the IL5R gene (upper panel) or for the glyceraldehyde-3–phosphate dehydrogenase (G3PDH) gene (lower panel), which were used as internal controls for the loading control. The positions of the endogenous full-length IL5R mRNA (IL5R) and the virus-encoded IL5R mRNA (v IL5R) are indicated at the right-hand side of the figure. (C) Distinct growth curve of TF-1, JYTF-1, TF1, and TF8 cells in IL-5. Cells were grown in the absence of cytokine (○) or in the presence of GM-CSF (□) or IL-5 (▵) at densities of 5 × 10⁵ cells/mL and 1 × 10⁵ cells/mL (GM-CSF and IL-5), respectively. Viable cell number was counted at 0 hours, 24 hours (day 1), and 48 hours (day 2) after seeding and was converted into the percentage of initial cell number (at day 0) as shown on the left-hand side of each plot. Each value is the average of four independent measurements.
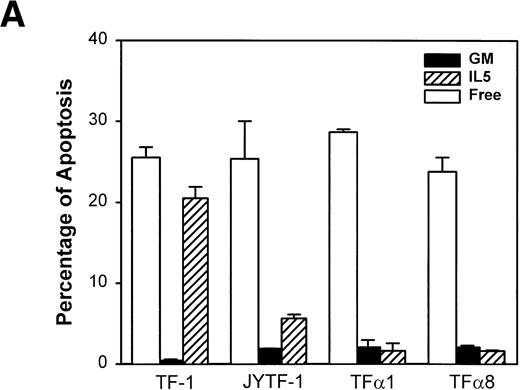
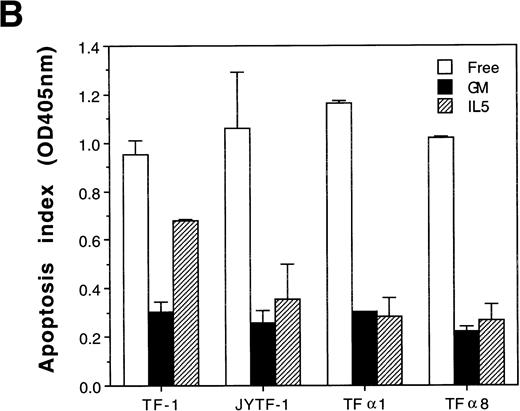
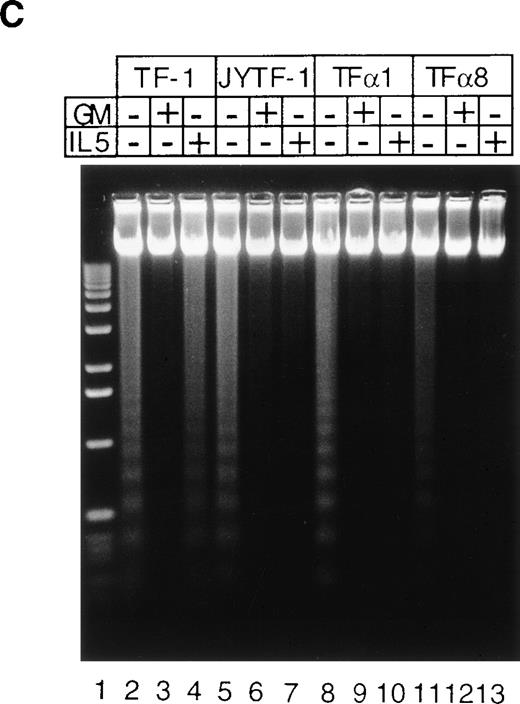
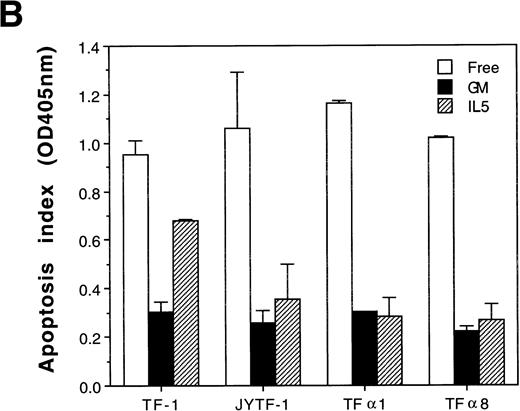
Pulse labeling of TFα1 and TFα8 cells with [3H]thymidine showed that levels of DNA synthesis activity were similar to levels in TF-1 and JYTF-1 cells in the presence of IL-5 (Fig 5). These numbers were about twofolds of the levels of DNA synthesis activity in the absence of cytokine. These results further suggested that the mechanism leading to optimal growth effect of IL-5 was not due to enhanced mitogenesis. We then examined if the enhanced growth of TFα1 and TFα8 in IL-5 was due to decreased apoptosis. To address this issue, three distinct methods were employed to assess the degree of the apoptosis, including (1) micrographic analysis (Fig 6A), (2) histone-releasing analysis (Fig 6B), and (3) DNA fragmentation analysis (Fig 6C). As shown in Fig6, all three assays showed that TF-1 cells were more prone to undergo apoptosis in IL-5–containing media (21% in Fig 6A) than cells overexpressing IL5Rα, including JYTF-1 (6% in Fig 6A), TFα1 (2%, Fig 6A), and TFα8 cells (2%, Fig 6A). Therefore, we concluded that overexpression of IL5Rα correlated very well with the improvement of antiapoptotic activity of TF-1 cells in IL-5–containing medium, rather than with the increase of mitogenic activity.
Overexpression of IL5R does not increase the mitogenic activity of IL-5. Rapid growing TF-1, JYTF-1, TF1, and TF8 cells were cultured in IL-5–containing (▧) or cytokine-free (□) media for 24 hours and then 1 × 10⁴ viable cells were subjected to [3H]thymidine pulse-labeling assay as described in Materials and Methods. For each sample, data shown is the average of 13 to 17 independent measurements (n).
Overexpression of IL5R does not increase the mitogenic activity of IL-5. Rapid growing TF-1, JYTF-1, TF1, and TF8 cells were cultured in IL-5–containing (▧) or cytokine-free (□) media for 24 hours and then 1 × 10⁴ viable cells were subjected to [3H]thymidine pulse-labeling assay as described in Materials and Methods. For each sample, data shown is the average of 13 to 17 independent measurements (n).
Suppression of apoptosis by overexpression of IL5R in TF-1 cells. (A) Microscopic measurement. Cells were grown in indicated culture media for 24 hours and the percentage of apoptotic cells in the whole population was calculated from the photomicrographs (see Materials and Methods). Each number represents the average of two independent measurements. For each measurement, 300 cells were counted in cytokine-free cultures (□); 500 cells were counted in GM-CSF– (▪) and IL-5–containing (▨) medium. (B) Histone-releasing assay. Cells were treated as described in (A), and were lysed to release the cytoplasmic contents. The bound nucleosomes were detected with ELISA as described in Materials and Methods. A representative set of data of three independent duplicated experiments is shown and each number is the average of two measurements. (C) DNA fragmentation analysis. Cells grown in the cultures as described in (A) were harvested and the genomic DNA was prepared and analyzed as described in Fig 3A and Materials and Methods. A molecular weight marker (1 kb ladder from Life Technology, Gaithersburg, MD) is loaded at the left-hand side of the figure.
Suppression of apoptosis by overexpression of IL5R in TF-1 cells. (A) Microscopic measurement. Cells were grown in indicated culture media for 24 hours and the percentage of apoptotic cells in the whole population was calculated from the photomicrographs (see Materials and Methods). Each number represents the average of two independent measurements. For each measurement, 300 cells were counted in cytokine-free cultures (□); 500 cells were counted in GM-CSF– (▪) and IL-5–containing (▨) medium. (B) Histone-releasing assay. Cells were treated as described in (A), and were lysed to release the cytoplasmic contents. The bound nucleosomes were detected with ELISA as described in Materials and Methods. A representative set of data of three independent duplicated experiments is shown and each number is the average of two measurements. (C) DNA fragmentation analysis. Cells grown in the cultures as described in (A) were harvested and the genomic DNA was prepared and analyzed as described in Fig 3A and Materials and Methods. A molecular weight marker (1 kb ladder from Life Technology, Gaithersburg, MD) is loaded at the left-hand side of the figure.
Oncogenic protein Bcl-2 also supports the optimal proliferation of progenitor cells.
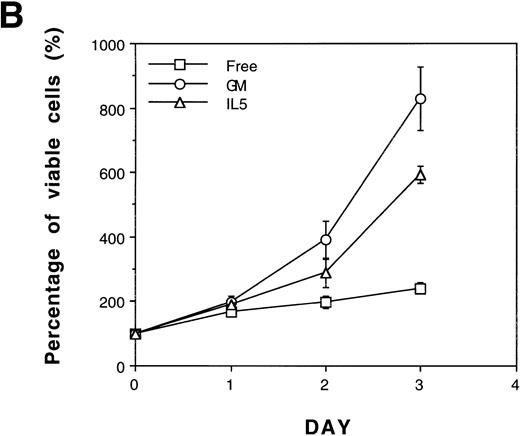
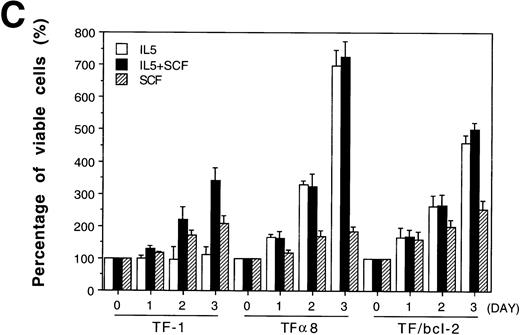
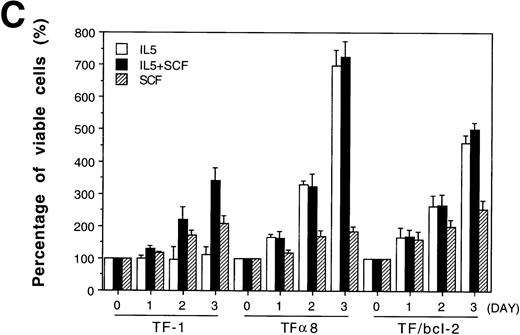
The Bcl-2 oncogene, first identified in human follicular lymphomas18,19 and implicated in the formation and therapeutic resistance of numerous human tumors, is a powerful antiapoptosis gene.20-22 We were interested in determining whether the role of SCF in antiapoptosis could be replaced by the overexpression of Bcl-2 oncoprotein. A pool of mixed TF-1 stable clones overexpressing human Bcl-2 oncoprotein was established by retroviral infection as previously described13 and was further analyzed in the present study. As shown in Fig 7, panel A, Bcl-2 protein was dramatically overexpressed in TF/Bcl-2 cells compared with both TF-1 and JYTF-1 cells (lanes 1, 2,and 3). Cytokine-withdrawal–induced apoptosis was dramatically blocked by Bcl-2 oncoprotein in TF/Bcl-2 cells according to DNA fragmentation,19 morphological observation (data not shown), and viable cell counting (Fig 7B). These cells showed a significant proliferation response to IL-5 that was comparable to the proliferation activity obtained by SCF costimulation or IL5Rα overexpression (Fig 1 and Fig 4C). In contrast, the proliferation response of TF/Bcl-2 cells in the GM-CSF–containing medium remained unchanged compared with that of TF-1 cells (Fig 7Bv Fig 1). Interestingly, SCF did not show synergistic proliferation when costimulated with IL-5 in either TFα8 (Fig 7C) or TF/Bcl-2 cells (Fig 7C). These data further suggested that the mechanism of SCF costimulation with IL-5 in TF-1 cells and the effect of IL5Rα overexpression were mainly due to suppression of apoptosis.
Overexpression of Bcl-2 oncoprotein rescues the proliferation of TF-1 cells in IL-5. (A) Overexpression of Bcl-2 protein in TF/Bcl-2 cells. Two hundred and fifty micrograms of protein lysates from each indicated cell line were analyzed by Western blot for the expression of Bcl-2, Bax, and -tubulin proteins (indicated at the right-hand side of the figure). (B) The growth curves of TF/Bcl-2 cells in the indicated culture media. TF/Bcl-2 cells were grown in media as indicated and the viable cell numbers were determined at each time point by trypan blue staining. (C) TF/Bcl-2 and TF8 cells were refractory to SCF stimulation in IL-5–containing medium. TF-1, TF8, and TF/Bcl-2 cells were treated with IL-5 alone (□), SCF alone (▨), or IL-5 + SCF (▪) and the numbers of viable cells were determined by trypan blue staining at different time points. The dose of cytokines was the same as described in Fig 1. The results were the averages from three duplicated experiments. The error bars represent the standard deviations.
Overexpression of Bcl-2 oncoprotein rescues the proliferation of TF-1 cells in IL-5. (A) Overexpression of Bcl-2 protein in TF/Bcl-2 cells. Two hundred and fifty micrograms of protein lysates from each indicated cell line were analyzed by Western blot for the expression of Bcl-2, Bax, and -tubulin proteins (indicated at the right-hand side of the figure). (B) The growth curves of TF/Bcl-2 cells in the indicated culture media. TF/Bcl-2 cells were grown in media as indicated and the viable cell numbers were determined at each time point by trypan blue staining. (C) TF/Bcl-2 and TF8 cells were refractory to SCF stimulation in IL-5–containing medium. TF-1, TF8, and TF/Bcl-2 cells were treated with IL-5 alone (□), SCF alone (▨), or IL-5 + SCF (▪) and the numbers of viable cells were determined by trypan blue staining at different time points. The dose of cytokines was the same as described in Fig 1. The results were the averages from three duplicated experiments. The error bars represent the standard deviations.
DISCUSSION
In this study, by taking advantage of a human leukemic cell line, we explored the relationship between the differential expression of cytokine receptors and the differential requirement of costimulation for proliferation of cells in the early differentiation stage of hematopoiesis. The TF-1 cell line we used may represent a clonal cell population at the committed multilineage progenitor stage. It expressed the markers and receptors specific for stem and progenitor cells at high levels, including CD34,10 c-kit,11erythropoietin receptor,23 IL-3 receptor α subunit, common receptor β subunit, and GM-CSF receptor α subunit.12 However, the IL-5 receptor α subunit was expressed only at a low level.12 Low-level expression of IL5Rα may be a characteristic of these multilineage progenitor cells wherein costimulation of SCF and IL-5 is usually necessary for eosinophil colony formation in vitro.
We showed in this study that differential expression levels of the IL-5 receptor have a tight relationship with the antiapoptosis ability of IL-5. Cells like TF-1 having low numbers of IL5Rα are intrinsically defective in antiapoptosis ability and the underlying mechanism remains to be investigated. Although SCF itself had some mitogenic activity in TF-1 cells, it did not exert any additive or synergistic mitogenic activity with IL-5 in TF-1 cells (Fig 2). Instead, SCF played a significant role in synergizing with IL-5 in the antiapoptotic activity (Fig 3C). However, SCF was not always required for IL-5 to achieve its optimal proliferation. When IL5Rα was overexpressed, SCF was no longer effective in synergizing with IL-5 and was not required for optimal proliferation (Fig 7C). Therefore, according to our results, the requirement of SCF for optimal proliferation is largely dependent on the quality of IL-5 signals.
These results are consistent with recent observations in other studies of the function of cytokine receptors.6,7 In early studies many cytokines were shown to require the SCF costimulation to achieve maximum efficacy for blast cell growth in in vitro colony formation assays. However, when receptors of these cytokines were molecularly cloned and highly expressed in surrogate factor-dependent cell lines, most receptors achieved maximal growth effect by their cognate cytokine alone.6,7 24 There was no evidence in previous studies that costimulation with SCF was absolutely required for the function of any specific cytokine receptor. Whether or not the expression levels of these cytokine receptors were low and hence there was a deficiency in the activity of cell death suppression in the purified stem cell population remains to be investigated.
It has been shown that in the presence of SCF, IL-3 at concentrations below ED50 could stimulate growth similar to that of IL-3 alone at the saturation dose in an IL-3–dependent cell line that highly expressed IL-3 receptors. The mitogenic and antiapoptotic effects of IL-5 were uncoupled in TF-1 cells, and it was not clear whether this uncoupling also occurred when IL-3 concentration went below ED50. Nevertheless, according to our and others data, SCF was effective in complementing the defects caused by either low levels of receptors or low levels of cytokines. These observations may have significance in suggesting the functions of SCF in vivo. Previous studies showed that mice with Steel or Wv mutations that lack the ability either to produce SCF or SCF receptors have much less response to G-CSF in stimulating granulopoiesis and in elevating progenitor cells.25 Therefore, the role of SCF in preventing the apoptosis of the early hematopoietic progenitor cells may be an important function of hematopoiesis.
Predisposition of Bcl-2 overexpression in transgenic animals has been shown to increase the chance of occurrence of lymphoproliferative disorders due to its potent antiapoptosis activity.26-28Recently, high level expression of Bcl-2 proteins was also observed in many human tumors, including cholangiocarcinoma,29endometrial carcinoma,30 acute myeloid leukemia (AML),31 solitary fibrous tumor,32 and medullary thyroid tumor.33 Our demonstration of replacing SCF with Bcl-2 expression in Fig 7 had two major implications. First, it re-emphasized the notion that antiapoptosis is one of the major contributions of SCF costimulation. Second, it indicated that the Bcl-2–transduced cells became immortal and had growth advantages over normal progenitor cells in the absence of cytokines. These Bcl-2 overexpressing cells were not factor-independent, however, they survived for a longer period of time and re-entered proliferation rapidly in the presence of cytokines. It is known that some primary leukemia cells from patients with AML are dependent on exogenous growth factors.34 The mechanism involved in this phenomenon remains to be investigated, and it will be interesting to explore the correlation between survival response and the expression of Bcl-2 protein in these leukemia cells.
Strong suppression of apoptosis by exogenous overexpression of Bcl-2 in TF-1 cells may suggest an important role for Bcl-2 in the regulation of cytokine-withdrawal induced apoptosis. However, the regulation of endogenous Bcl-2 cannot explain the mechanism of cytokine-withdrawal–induced apoptosis or apoptosis in IL-5–containing medium (unpublished data). Instead, another Bcl-2 member, Mcl-1, showed a nice correlation between expression level and the occurrence of apoptosis (unpublished data and Chao et al13) in several cytokine-dependent cell lines. Further study on the regulation of the Mcl-1 gene and the signal transduction of IL-5 in TF-1 cells should shed light on the antiapoptosis signaling pathways of cytokines in hematopoietic cells.
ACKNOWLEDGMENT
The authors thank Dr Charles Shih (PharMingen) for the gift of antihuman IL-5R antibody, and Dr Mi-Hua Tao for his careful reading of this manuscript and helpful suggestions.
Supported by grants from both Academia Sinica and the National Science Council of Taiwan, NSC85-2331-B-001-007 to J.J.Y.Y.
The publication costs of this article were defrayed in part by page charge payment. This article must therefore be hereby marked “advertisement” in accordance with 18 U.S.C. section 1734 solely to indicate this fact.

![Fig. 2. IL-5 in combination with SCF had no additional mitogenic activity. (A) Cell cycle distribution of TF-1 cells cultured in various combinations of cytokines. TF-1 cells were cultured in the indicated media as described in Fig 1 for 24 hours before BrdU-labeling and PI staining as described in Materials and Methods. Similar numbers of viable cells were analyzed for the percentages of cells in the G1, S, and G2/M phases and results are shown within the panel. The cytokines present in each culture medium are also indicated inside the panels. The x-axis represents the intensity of PI fluorescence and the y-axis represents the intensity of FITC-conjugated anti-BrdU antibody fluorescence. These plots are a set of representative results and the percentages of cells in various cell cycle stages are the averages from four independent determinations. (B) DNA synthesis rates of TF-1 cells cultured in various combinations of cytokines. TF-1 cells were cultured in the indicated media for 48 hours and ten thousand viable cells were subjected to [3H]thymidine incorporation assay to determine the DNA synthesis rate. The data shown are the averages of four independent triplicated experiments.](https://ash.silverchair-cdn.com/ash/content_public/journal/blood/93/8/10.1182_blood.v93.8.2569/5/m_blod40808002ax.jpeg?Expires=1766247443&Signature=auBqkdxDS4XWCWt6LgrfxGannUdc1qNnl~3~HjfGJbRgPF81d5CA05i4yYG8Txxyyf7v4WHlMkWuYJfoA6idYZ5K2-u6QxRrjcXRHXLo7hkyi7E4P0W70ln6XHt3YVoO5dkOhemo1F2oIjhqOgkwT3RwWP3WSVfnJFYjJyBLPE6Iv4HVjhZVPPGVhQboi5sdg2OE~p1h0RDZPm9DSiaUSd6C4VoAPyy9HPoIQ1Jc5sZJoPQdHPATXu8JGCg29mf-DVQ8VZFnrXhPZdT4g3QlZ59N295kA2Brxsr5mXNv6NzbRqER4gMWjuPOoE4TjDHXgMICaziqkx7zK~lFqKY~hQ__&Key-Pair-Id=APKAIE5G5CRDK6RD3PGA)
![Fig. 2. IL-5 in combination with SCF had no additional mitogenic activity. (A) Cell cycle distribution of TF-1 cells cultured in various combinations of cytokines. TF-1 cells were cultured in the indicated media as described in Fig 1 for 24 hours before BrdU-labeling and PI staining as described in Materials and Methods. Similar numbers of viable cells were analyzed for the percentages of cells in the G1, S, and G2/M phases and results are shown within the panel. The cytokines present in each culture medium are also indicated inside the panels. The x-axis represents the intensity of PI fluorescence and the y-axis represents the intensity of FITC-conjugated anti-BrdU antibody fluorescence. These plots are a set of representative results and the percentages of cells in various cell cycle stages are the averages from four independent determinations. (B) DNA synthesis rates of TF-1 cells cultured in various combinations of cytokines. TF-1 cells were cultured in the indicated media for 48 hours and ten thousand viable cells were subjected to [3H]thymidine incorporation assay to determine the DNA synthesis rate. The data shown are the averages of four independent triplicated experiments.](https://ash.silverchair-cdn.com/ash/content_public/journal/blood/93/8/10.1182_blood.v93.8.2569/5/m_blod40808002bx.jpeg?Expires=1766247443&Signature=CIiAO-TIqYj9j98yJb7lqgh8vile01PmZOz6TTvEylqq6zxPPOE6iBK66w9sO4u3MPc1UKXCMUN5eDb7G1HRs~PfBYehOI3YUGBZ5vcDGdcjapqUn3CJEmWtVrqVNYisOxY81dY8uvY8-bT-YBvSdfDcA44x5kA3ectOukyBRwQ9Z~se7GQJ51vkNkDIckch~GJVvfw3vnmA0vfu69MgBGkbRTyktr9WjIVJRsqeN1~9BlxYmG1Cqkg-DofFVN~xXxNSjDuSF9XGqoIUpIUpf3M--YBcZ7StKnQUnrtCQSLEegbdS8vrsYKOHUoBKcjsw1n2hfPQ6nmlf1v1cjAwAQ__&Key-Pair-Id=APKAIE5G5CRDK6RD3PGA)


![Fig. 5. Overexpression of IL5R does not increase the mitogenic activity of IL-5. Rapid growing TF-1, JYTF-1, TF1, and TF8 cells were cultured in IL-5–containing (▧) or cytokine-free (□) media for 24 hours and then 1 × 10⁴ viable cells were subjected to [3H]thymidine pulse-labeling assay as described in Materials and Methods. For each sample, data shown is the average of 13 to 17 independent measurements (n).](https://ash.silverchair-cdn.com/ash/content_public/journal/blood/93/8/10.1182_blood.v93.8.2569/5/m_blod40808005x.jpeg?Expires=1766247443&Signature=dx7Ak0XzjaGv9zRCLQ3WPb6XkSc4XfZnN1R5tQw8ng1MSzvKlfgs16mqzOfXGonRY0wEFlP2z4UP-cSjF11pi4sXcHokE~f7-iV6euhSolUmkUaP7BuxL8SqPhxZHCH7ECusGln1LZiWRjDs--noB0jfG7YV8LnZjXJECUoITIidgWWz-EvroUtbkPV9SKDjtjpZYKOxidr~4lYgg0jO3jg3DAOPFeQtip~tmbA62EwsRkJTaOUcUiWQkwGomVL4LO59POa1KI3gp3~u3sMYrpwpcy05N4cyHuZJGqK9q0kFsWpJtFU4-zbqpwvsft27f2rzl8QyYJzb1L738264eQ__&Key-Pair-Id=APKAIE5G5CRDK6RD3PGA)





![Fig. 2. IL-5 in combination with SCF had no additional mitogenic activity. (A) Cell cycle distribution of TF-1 cells cultured in various combinations of cytokines. TF-1 cells were cultured in the indicated media as described in Fig 1 for 24 hours before BrdU-labeling and PI staining as described in Materials and Methods. Similar numbers of viable cells were analyzed for the percentages of cells in the G1, S, and G2/M phases and results are shown within the panel. The cytokines present in each culture medium are also indicated inside the panels. The x-axis represents the intensity of PI fluorescence and the y-axis represents the intensity of FITC-conjugated anti-BrdU antibody fluorescence. These plots are a set of representative results and the percentages of cells in various cell cycle stages are the averages from four independent determinations. (B) DNA synthesis rates of TF-1 cells cultured in various combinations of cytokines. TF-1 cells were cultured in the indicated media for 48 hours and ten thousand viable cells were subjected to [3H]thymidine incorporation assay to determine the DNA synthesis rate. The data shown are the averages of four independent triplicated experiments.](https://ash.silverchair-cdn.com/ash/content_public/journal/blood/93/8/10.1182_blood.v93.8.2569/5/m_blod40808002ax.jpeg?Expires=1766249295&Signature=pmo2rS8LZmV7yr0XUP02rbbHUj8kJIS959vy0DY8gbdhU5n6qiyRTYIl76HJxHcRpIfxgUXNpR95d916bynVhA9erJSl~P3pkk6X2B4WPDGw2fooIAgfAOZcHJLeG-dLrpj3ZpRN7wqThFRlevR5csOyo2B15kT8nQB7H64ERJFx50IQ~SfFx~HyDquJy3zb8EGY6h5A7KGZdWDRX2J6xQCFfnxRkeDHMu6FSxlpTpcbUeOEbz9AXmidY0hO29CBu4Iq-EOep7OtZkQhPTlEDIdVs88z86fyCs4YXy19VBwRgM8zKEyzf6Okt4sJCKsV2AmVWnArefjgSVTTNZ48wA__&Key-Pair-Id=APKAIE5G5CRDK6RD3PGA)
![Fig. 2. IL-5 in combination with SCF had no additional mitogenic activity. (A) Cell cycle distribution of TF-1 cells cultured in various combinations of cytokines. TF-1 cells were cultured in the indicated media as described in Fig 1 for 24 hours before BrdU-labeling and PI staining as described in Materials and Methods. Similar numbers of viable cells were analyzed for the percentages of cells in the G1, S, and G2/M phases and results are shown within the panel. The cytokines present in each culture medium are also indicated inside the panels. The x-axis represents the intensity of PI fluorescence and the y-axis represents the intensity of FITC-conjugated anti-BrdU antibody fluorescence. These plots are a set of representative results and the percentages of cells in various cell cycle stages are the averages from four independent determinations. (B) DNA synthesis rates of TF-1 cells cultured in various combinations of cytokines. TF-1 cells were cultured in the indicated media for 48 hours and ten thousand viable cells were subjected to [3H]thymidine incorporation assay to determine the DNA synthesis rate. The data shown are the averages of four independent triplicated experiments.](https://ash.silverchair-cdn.com/ash/content_public/journal/blood/93/8/10.1182_blood.v93.8.2569/5/m_blod40808002bx.jpeg?Expires=1766249295&Signature=ZOYe4f2RFAQXN6Q4cRjpHw-UzvW70Wqr2CAOnQpBwm8VfTEuBLtgDbLLT8NpPqm73m-sKq4ltI2MGCKm6PwkTJ4KdB8IMAxM3Y-HUUdxsQUg6uIy1wjrNjX9RF~stiqQmwbugfNNCj9DhqOBoFadkKEbtFOJg1F-trjydmwLWuAU1vEiOy6n1HQ3F3HNP8GIuOiLGq7w4~A6CCEK8Wa9UeY~KXuW8vdJP-9LvqstDE4hCZa8Wwa3dFSqdrQyIFTk9rujxV1CEeQDX-sIN1Db1TBY9KVsvKY6a9UtCQP19bs7UkP6A2oEnjLD8TzYXkTP5s5xkRbrXGGJUt7qIyR8OQ__&Key-Pair-Id=APKAIE5G5CRDK6RD3PGA)


![Fig. 5. Overexpression of IL5R does not increase the mitogenic activity of IL-5. Rapid growing TF-1, JYTF-1, TF1, and TF8 cells were cultured in IL-5–containing (▧) or cytokine-free (□) media for 24 hours and then 1 × 10⁴ viable cells were subjected to [3H]thymidine pulse-labeling assay as described in Materials and Methods. For each sample, data shown is the average of 13 to 17 independent measurements (n).](https://ash.silverchair-cdn.com/ash/content_public/journal/blood/93/8/10.1182_blood.v93.8.2569/5/m_blod40808005x.jpeg?Expires=1766249295&Signature=ugq8JTJuHmeJrreX-O~FOoDfE-vz4GfLNCRNJkSdtU9CRwDDBLyTKqWoR2Yz3OSTR9v1FZE7h~TkiSq8qdzmUbHZQXVqSZR858EvOc5ObwxiZlOglL9FMYyvfkkYV4KYiASkjhLV1v06H~O4YWbS3arKWM7B12YOjGzxNNVrmvh5JVn~-wS53jB4Hg-CFLLcQljRDGWyfoh4QBU8jdx5JTK9uAi3Zwbbg421fITFCZa9coQ2TMHMlHfPBCvpFP0BqG8SLojFUvdYg1j77nW45hKIxwYaDT5v6RtJpBMmDGjaqd2kY9p1vXkbaQ6EiEUh2Lt6JfiScCk0B~8hnLmR3Q__&Key-Pair-Id=APKAIE5G5CRDK6RD3PGA)
