Key Points
Low levels of most aGVHDs (before/after treatment) and immune cell markers (before treatment) positively affect the probability of response.
Models (baseline and day 14) can help identify patient characteristics and biomarkers for improved response to ruxolitinib vs BAT.
Abstract
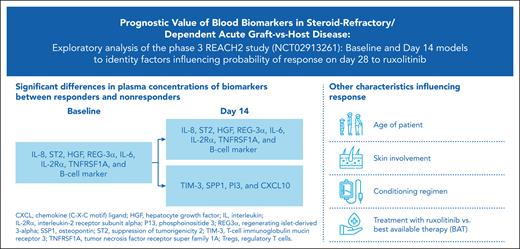
Systemic steroids are the standard first-line treatment for acute graft-versus-host disease (aGVHD), but ∼50% of patients become steroid-refractory or dependent (SR/D). Ruxolitinib is the only Food and Drug Administration– and European Medicines Agency–approved therapy for patients with SR/D aGVHD. In the phase 3 REACH2 trial (NCT02913261), ruxolitinib demonstrated superior efficacy in SR/D aGVHD, with a significantly higher overall response rate (ORR) on day 28, durable ORR on day 56, and longer median overall survival compared with the best available therapy (BAT). Identifying biomarkers and clinical characteristics associated with increased probability of response can guide treatment decisions. In this exploratory analysis of the REACH2 study (first biomarker study), we developed baseline (pretreatment) and day 14 models to identify patient characteristics and biomarkers (12 aGVHD-associated cytokines/chemokines, 6 immune cell types, and 3 inflammatory proteins) before and during treatment, which affected the probability of response at day 28. Treatment with ruxolitinib, conditioning, skin involvement, and age were strongly associated with an increased likelihood of response in the ≥1 model. Lower levels of most aGVHD and immune cell markers at baseline were associated with an increased probability of response. In the day 14 model, levels of aGVHD markers at day 14, rather than changes from baseline, affected the probability of response. For both models, the bias-corrected area under the receiver operating characteristic values (baseline, 0.73; day 14, 0.80) indicated a high level of correspondence between the fitted and actual outcomes. Our results suggest potential prognostic value of selected biomarkers and patient characteristics.
Introduction
Allogeneic hematopoietic stem cell transplantation (allo-HSCT) is used to treat a variety of hematologic conditions. Although allo-HSCT can be curative, patients are at an increased risk of developing graft-versus-host disease (GVHD), whereby donor T cells initiate an immune response against host tissues. GVHD is a major cause of nonrelapse mortality among patients who have undergone allo-HSCT1 and can present as acute or chronic. Even with prophylactic treatment, ∼40% to 60% of allo-HSCT recipients develop acute GVHD (aGVHD),2 typically within 100 days of transplantation.
Systemic steroids are the recommended first-line treatment for aGVHD,3 but ∼50% of patients become steroid-refractory or dependent (SR/D).4 The overall survival is reduced in such patients,5 highlighting the need for effective second-line treatment. The Janus kinase inhibitor, ruxolitinib, is the only therapy approved by the US Food and Drug Administration for the treatment of SR-aGVHD in adults and pediatric patients aged ≥12 years. This approval was based on findings from the phase 2, single-arm REACH1 study, in which 54.9% of patients with grade II-IV SR/D aGVHD had a response on day 28.6
In the phase 3 randomized REACH2 trial, ruxolitinib demonstrated superior efficacy to the best available therapy (BAT), leading to a significantly higher overall response rate (ORR; complete or partial response) on day 28 (62.3% vs 39.4%; odds ratio [OR], 2.64; P < .001) and durable ORR on day 56 (39.6% vs 21.9%; OR, 2.38; P < .001).7 Similarly, the rate of best overall response at any time up to day 56 was greater with ruxolitinib (81.8% vs 60.6%; OR, 3.07), and the median overall survival was prolonged compared with BATs (11.1 vs 6.5 months). Treatment with ruxolitinib did not result in any new safety signals from those previously observed,6,8 and the rates of adverse events were similar between the treatment arms, even with a longer follow-up.
Identifying biomarkers and/or clinical characteristics with prognostic value in patients with SR/D aGVHD could help to guide treatment approaches. In the REACH2 study, plasma samples were collected at baseline (pretreatment) and during the trial. Various markers were measured, including immune cell subtypes, inflammatory cytokines, and proteins associated with the GVHD-damaged target organs. Using these data and patient clinical characteristics at baseline, baseline and day 14 models were developed to identify variables that affect the probability of patient response on day 28. Here, we present the results of this analysis, which, to our knowledge, is the first study to be conducted among patients with SR/D aGVHD in the context of a randomized trial.
Methods
Patients and study design
Eligible patients in the REACH2 trial (NCT02913261) were ≥12 years old, had undergone allo-HSCT, and developed grade II-IV SR/D aGVHD requiring systemic immunosuppressive therapy.7
Patients were randomized (1:1; stratified by aGVHD grade) to receive ruxolitinib 10 mg twice daily or BAT (investigator’s choice from the 9 options). In both treatment arms, patients could continue to receive steroids ± calcineurin inhibitors.
Sample collection and processing
Blood samples for biomarker analysis were collected predose on days 1 (baseline), 14, 28, 56, and 168 (or discontinuation). Regenerating islet-derived protein 3α (REG-3α), suppression of tumorigenicity 2 (ST2), tumor necrosis factor receptor superfamily member 1A (TNFRSF1A), and elafin (PI3) levels were evaluated using a 4-plex Ella automated immunoassay system (R&D Systems Inc, Minneapolis, MN). An 8-plex Luminex microbead assay was used to measure B-cell–activating factor (BAFF), interleukin 2 receptor subunit alpha (IL-2Rα), chemokines CXCL10, CXCL11, CXCL9, matrix metalloproteinase-3, osteopontin (SPP1), and hepatocyte growth factor (HGF). Interferon γ (IFN-γ), IL-1β, IL-2, IL-4, IL-6, IL-8, IL-10, IL-12p70, IL-13, and TNF levels were assessed using a 10-plex Multispot immunoassay (Meso Scale Diagnostics, Rockville, MD). T-cell immunoglobulin mucin receptor 3 (TIM-3) was assessed using a sandwich enzyme-linked immunosorbent assay. Immune markers for regulatory T cells (Tregs), helper T 17 (TH17) cells, CD8+ T cells, CD4+ T cells, natural killer (NK) cells, and B cells were assessed in peripheral blood using Epiontis ID (Precision Medicine Group, Bethesda, MD). The upper and lower limits of quantitation are summarized in supplemental Table 1.
All assays were validated with interrun precision percent coefficients of variation ≤25%. Quality control samples were assayed during the qualification of the new kit lot to ensure reagent lot consistency alongside the study samples to ensure run validity. The batch effect was expected to be minimal and acceptable based on the assay validation reports. In addition, the assays were performed in multiple small batches; batch-to-batch differences were unlikely to correlate with any key variables.
Statistical methods
Data for the 29 biomarkers were analyzed from samples collected at baseline and 14 days after treatment initiation because the availability of patient samples decreased for subsequent dates. Six biomarkers were excluded from the analysis because their baseline values exceeded the limits of quantitation in most patients (IL-1β, 85.5%; IL-12p70, 97.9%; IL-13, 90.0%; IL-2, 96.8%; and IL-4, 98.9% [below lower limits]; matrix metalloproteinase-3, 77.3% [above upper limits]), and a similar trend was observed 14 days after treatment initiation. Changes in biomarkers over time were of interest for exploratory analyses and were assessed for each biomarker for all patients. Values for the remaining 23 biomarkers across time points were rank-transformed, and a general F test was applied to assess the evidence for an effect of visit—either as a main effect or as interacting with treatment, with patient effects included. The P values for the F tests were < .05 for all 23 biomarkers, except for CXCL9 (P = .0951), TNF (P = .368), and IL-10 (P = .981). Because of the lack of statistically detectable changes over time, TNF and IL-10 were excluded from further analysis; the remaining 21 biomarkers were included (supplemental Figure 1, available on the Blood website).
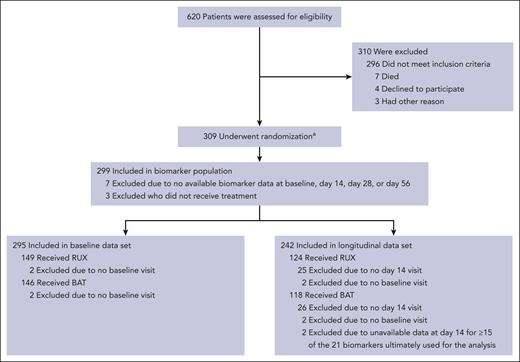
The baseline data set consisted of 295 eligible patients (Figure 1) for any of the 21 biomarkers of interest (RUX, n = 149 and BAT, n = 146). Of these patients, 242 had data for ≥6 biomarkers on day 14 (RUX, n = 124 and BAT, n = 118) and were included in the day 14 data set. Patients who were not assessed for efficacy on day 28 (or within the efficacy window) were excluded from the model.
REACH2 CONSORT diagram.aA total of 310 patients underwent randomization, but 1 patient was excluded from all analyses because written informed consent was not obtained. BAT, best available therapy; RUX, ruxolitinib.
REACH2 CONSORT diagram.aA total of 310 patients underwent randomization, but 1 patient was excluded from all analyses because written informed consent was not obtained. BAT, best available therapy; RUX, ruxolitinib.
To assess the probability of response to treatment, a logistic regression model was fitted to baseline data, and a second model was fitted to data available on/before day 14.9 We applied exploratory modeling, to avoid bias, using the described methodology, with models regarded as probability and not class-label generators.9 Predictive values did not guide the selection/rejection of independent variables. We assessed the use of these models with (bias-corrected) area under the receiver operating characteristic (AUROC), which does not require specific thresholds to be determined.
Biomarker values were log10-transformed (log10[x + 1]) before analysis, and those below the 2.5% quantile or above the 97.5% quantile were imputed to the 2.5% and 97.5% quantiles. Biomarker values below the assay limit of detection were imputed and assigned half of the value of the lower assay limit. In addition, missing biomarker values were imputed via an iterated random forest algorithm using the R package missForest,10 with the imputation for missing baseline values based on the other available biomarker values at baseline, and the imputation for missing biomarker values in the day 14 model based on the available baseline values and changes from baseline (supplemental Table 2).
The baseline model used baseline biomarker values and patient characteristics as covariates (supplemental Table 3). The day 14 model used the baseline biomarker values and baseline patient characteristics for the day 14 data set (n = 242) in addition to the change in biomarker values over time (day 14--baseline) for the same patients. Biomarkers were categorized into 1 of the 3 classes as follows: aGVHD-associated cytokines/chemokines (CXCL9, CXCL10, CXCL11, HGF, ST2, IL-2Rα, REG-3α, SPP1, TIM-3, PI3, BAFF, and TNFRSF1A), immune cells (B cells, CD4+ T cells, CD8+ T cells, NK cells, TH17 cells, and Tregs), and inflammatory proteins (IFN-γ, IL-6, and IL-8). For the day 14 and baseline models, data from the corresponding data sets were used to generate principal components with centering and scaling for each group of biomarkers.11 For the day 14 model, principal components were generated for baseline and difference from baseline to day 14. Principal components were selected to account for most of the variance in the data (supplemental Table 4; supplemental Figure 2). For further details about the principal components and model building, see the supplemental Material.
Trial management
The trial was designed and conducted in accordance with the guidelines by Good Clinical Practice of the International Council for Harmonization, applicable local regulations, and the Declaration of Helsinki. The protocol was approved at each participating center by the relevant institutional review board, independent ethics committee, or research ethics board. An independent data monitoring committee reviewed safety on a regular basis. Informed consent was obtained from all the patients (or their guardians).
Results
Biomarker profiles between treatment responders and nonresponders over time in REACH2
A total of 29 proteins or markers of immune cell subsets were assessed in samples collected at baseline and on day 14 of treatment. Because of the large number of patients with missing biomarker data for subsequent dates, the analysis was limited to these 2 time points. These biomarkers were selected based on previous findings showing their elevated levels in patients with aGVHD and/or their role in aGVHD pathology.8,12-25 Eight biomarkers were excluded as detailed in “Methods.”
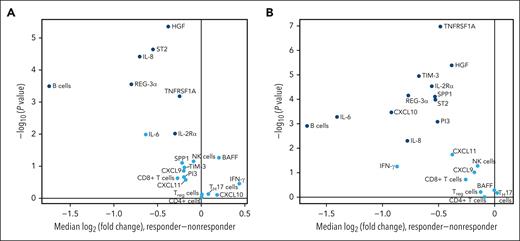
Of the 21 biomarkers included in the final analysis, 8 exhibited a significant difference (P < .01; IL-8, ST2, HGF, REG-3α, IL-6, IL-2Rα, TNFRSF1A, and B-cell marker) in plasma concentrations between responders and nonresponders at both baseline (Figure 2A) and day 14 (Figure 2B). The plasma concentrations of TIM-3, SPP1, PI3, and CXCL10 differed significantly between responders and nonresponders on day 14 (Figure 2B). At both time points, the biomarkers that significantly differed between patient subsets were higher in nonresponders than in responders. The absolute value of the median log2 (fold change) between these 2 patient subsets exceeded 0.5 for 5 of the biomarkers (IL-8, ST2, REG-3α, IL-6, and B-cell marker) at baseline and 10 of the biomarkers (IL-8, ST2, REG-3α, IL-6, IL-2Rα, B-cell marker, TIM-3, SPP1, PI3, and CXCL10) at day 14.
Biomarker expression in responders vs nonresponders at baseline (A) and day 14 (B). Biomarkers with median log2 (fold change) values that significantly differed (P≤.01) between responders and nonresponders are shown in dark blue. MMP3, matrix metalloproteinase-3; PI3, phosphoinositide 3.
Biomarker expression in responders vs nonresponders at baseline (A) and day 14 (B). Biomarkers with median log2 (fold change) values that significantly differed (P≤.01) between responders and nonresponders are shown in dark blue. MMP3, matrix metalloproteinase-3; PI3, phosphoinositide 3.
Model fitting
To aid in building the baseline and day 14 models, principal components were generated for the markers in each of the 3 categories (aGVHD, immune, and inflammatory) separately using the baseline (n = 295) and day 14 (n = 242) data sets. Generally, the coefficients of the first principal component within each group were similar across markers in both the baseline and day 14 analysis, indicating that the main axis of multivariate variation within each category comprised markers that tended to vary together.
The independent variables for the baseline model were the selected principal components of the baseline biomarker data set, along with their baseline clinical characteristics. The independent variables for the day 14 model were the baseline patient characteristics and principal components for the baseline biomarker levels of the day 14 patient population as well as the principal components for the change in biomarkers (day 14--baseline). The process of fitting penalized logistic regression models revealed that only the main effects, and no higher order or nonlinear effects, were warranted for inclusion in both models.
As the day 14 data set included fewer patients (n = 242) than the baseline (n = 295) (Figure 1), we assessed whether baseline characteristics were balanced between the patients included and excluded on day 14. This analysis indicated a lower rate of liver and lower gastrointestinal (GI) tract involvement among patients included in the day 14 subset; therefore, these characteristics were accounted for in the model.
Contribution of independent variables to the probability of response
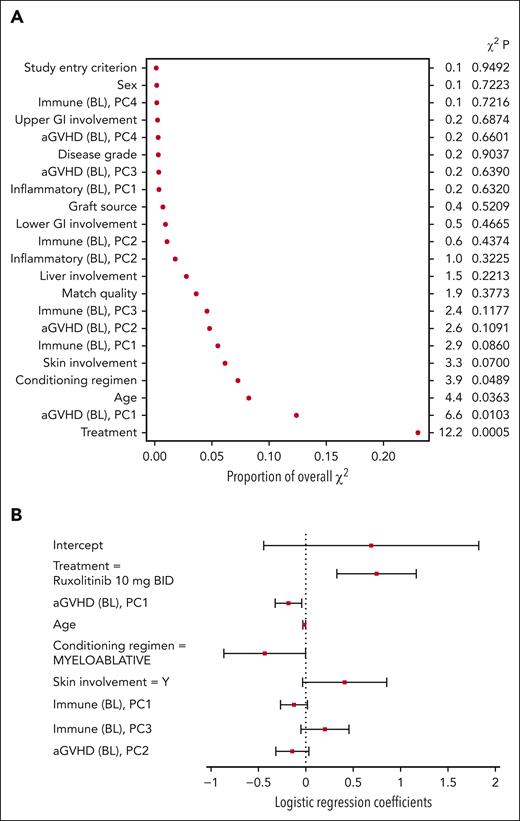
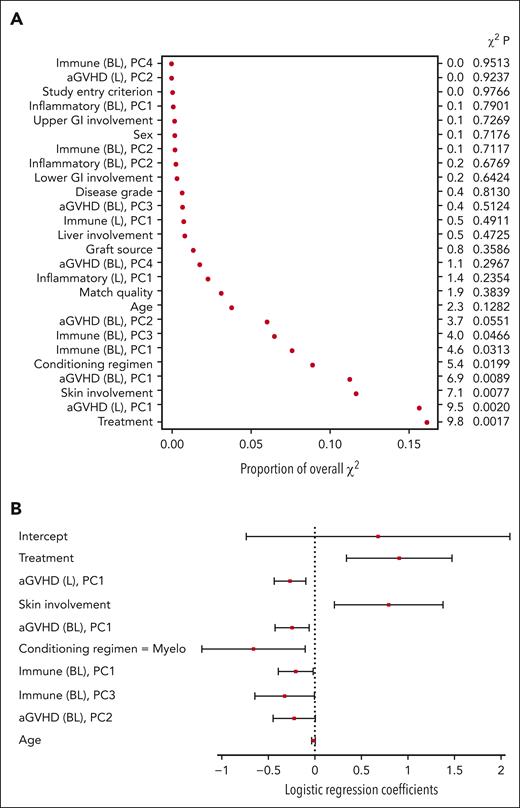
For the baseline model, treatment, the first principal component of the aGVHD biomarkers, age, and conditioning regimen were among the most important covariates P < .05) (Figure 3A). Based on the covariate coefficients, randomization to ruxolitinib was associated with an increased probability of a clinical response on day 28 (Figure 3B). Conversely, the first principal component of the aGVHD markers (in which the values of all biomarkers, excluding CXCL9 and CXCL11, tended to be elevated) and a myeloablative conditioning regimen were associated with a decreased probability of a clinical response on day 28. The coefficient for age indicated a decreased likelihood of clinical response with increased age. The small regression coefficient for age (−0.0165) does not indicate that age was necessarily unimportant because the numerical range of age was larger than the values for other variables.
Baseline model variables of importance (A) and coefficients (B). Levels for each categorical variable are listed in supplemental Table 3. BL, baseline model principal component; PC, principal component.
Baseline model variables of importance (A) and coefficients (B). Levels for each categorical variable are listed in supplemental Table 3. BL, baseline model principal component; PC, principal component.
For the day 14 model, the most important covariates included treatment, the first principal component of the aGVHD markers at baseline, difference between baseline and day 14, skin involvement at baseline, conditioning regimen, first and third principal components of the immune markers at baseline, and second principal component of the aGVHD markers at baseline (Figure 4A). The first principal component for the aGVHD markers at baseline and the difference between day 14 and baseline had similar coefficients in the model (−0.24 vs −0.27), suggesting that the biomarker value at day 14, regardless of the baseline value or change from baseline, is most relevant to the model. As in the baseline model, treatment with ruxolitinib was associated with an increased probability of clinical response on day 28, whereas the myeloablative conditioning regimen was associated with a decreased probability of response (Figure 4B). Skin involvement at baseline was also positively associated with a clinical response on day 28. The first and third principal components of the immune markers were both negatively associated with the response. Prophylaxis at baseline did not affect the response to treatment (supplemental Appendix 1).
Validating the fitted models
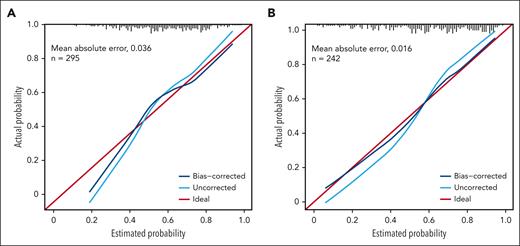
The accuracy of the 2 models was assessed using Somers D and the associated AUROC value. The apparent estimate (using the data the model was generated with) of Somers D for the baseline model was 0.576, resulting in an AUROC value of 0.788 (a value of 1 indicates a perfect relationship between the fitted and actual values; a value of 0.5 indicates no relationship). The bootstrap bias-corrected Somers D did not indicate a marked overfitting of the model (D, 0.459; AUROC, 0.730). The apparent estimate of Somers D for the day 14 model was 0. 729 (AUROC, 0.864), and the bootstrap-corrected estimate was 0.602 (AUROC, 0.801).
In addition, the calibration of the models was assessed to gauge how well the modeled probabilities of a response corresponded to the observed (internal) and out-of-sample (external) response rates. As demonstrated by tracking with the ideal curve, estimated response probabilities appeared unbiased for probabilities >0.4 in the baseline model, but tended to be overestimated for probabilities <0.4 (Figure 5A). For the day 14 model, there was a modest indication of overfitting of uncorrected probabilities, but the bias-corrected probabilities were consistent with the actual response rates (Figure 5B; supplemental Appendix 2).
Discussion
GVHD is characterized by an increase in chemokines and proinflammatory cytokines that drive immune response activation, leading to tissue damage.26 Multiple studies have sought to identify biomarkers that can provide a measure of GVHD severity and/or the probability of response to treatment. Many proteins are upregulated in patients with GVHD, some of which serve as prognostic and/or diagnostic markers. In accordance with the disease pathology, these include numerous cytokines (IFN-γ,12 IL-6,8,13 and IL12p7014) and their receptors (IL-2Rα,8,15 ST2,13,16 and TNFRSF1A13,15); chemokines (HGF,15 IL-8,15 CXCL9,17 BAFF,18,19 CXCL10,18,19 and CXCL1118); markers of tissue damage that can denote organ involvement (REG-3α,20-22 and PI322,23); and immune cell surface markers (TIM313,24,25). We analyzed these circulating biomarkers and immune cell subsets upregulated by the proinflammatory state observed in aGVHD, which in turn contribute to further cytokine secretion.
Biomarker expression was compared between responders and nonresponders regardless of treatment. Approximately one-third of the biomarkers (IL-8, ST2, HGF, REG-3α, IL-6, IL-2Rα, TNFRSF1A, and B-cell marker) had significantly higher expression in nonresponders than in responders at both baseline and day 14. Half of these markers (IL-8, IL-2Rα, TNFRSF1A, and HGF) were previously identified using logistic regression analysis as a diagnostic panel for predicting the development of aGVHD after allo-HSCT.15 Pretreatment plasma levels of IL-6 were also previously found to be predictive of developing grade III or IV aGVHD.13 In line with these observations, levels of IL-6 and IL-2Rα were elevated in patients with SR-aGVHD in a retrospective study.8 Notably, these patients demonstrated a significant decrease in blood IL-6 and IL-2Rα within 5 days of starting ruxolitinib treatment; all of these patients were also responders.8 However, in these studies and the present analysis, patient infection status was not considered. This could have affected the findings, as observed in prior work in which IL-6 levels were no longer considered elevated in patients with GVHD after bacterial and viral infections were accounted for.27 Previous work also revealed an increase in Tregs with ruxolitinib treatment in a murine model of aGVHD.28 In this study, Treg counts showed no significant difference between responders and nonresponders at either time point, but because this analysis did not delineate biomarker profiles based on treatment but, more broadly, based on response, further analyses are needed to examine ruxolitinib-specific associations.
To generate the baseline and day 14 models, biomarkers were classified based on their general biological roles as markers of aGVHD, inflammation, or immune cells. Reflecting the difficulty of replicating biological complexity in a model, these 3 categories do not necessarily capture the multifaceted roles that some of these biomarkers play. For example, the classification of IFN-γ as an inflammatory protein does not reflect its dual immunoregulatory-immunosuppressive function that can curb GVHD.12,29 However, this simplification was necessary when generating the 2 models because a total of 12 baseline clinical characteristics and 21 biomarkers were considered.
In these models, the effects of variables on the probability of response are independent of each other, so the effect of multiple variables could be additive. In both the day 14 and baseline models, the treatment and conditioning regimen had a strong effect on the probability of response. Specifically, treatment with ruxolitinib and nonmyeloablative conditioning was associated with an increased probability of response on day 28. The findings of this analysis align with the results of REACH2, in which treatment with ruxolitinib led to a significantly higher ORR on day 28 than treatment with BATs.7 Other clinical covariates that demonstrated prognostic value were skin involvement (in the day 14 model) and age (in the baseline model).
For each of the 3 biomarker categories, both at baseline and longitudinally, the first principal components had coefficients with the same sign and similar magnitudes relative to the range (with the exceptions noted below). This indicated that within a given patient, the levels of biomarkers in each group tended to be similar (all elevated or all low). Thus, when examining individual patients, the behavior of 1 biomarker within a group tended to be representative of that of other biomarkers in the same group. Among aGVHD markers, CXCL9 and CXCL11 did not follow this pattern. Because almost all biomarkers within a category behaved similarly, each contributed information about the overall intensity of that biomarker group. In the models generated, the overall intensity of certain biomarker groups (the aGVHD group at baseline and change from baseline on day 14; the immune group at baseline in both models) was an important metric for the prognostic value of that category. For these particular biomarker groups, the more elevated each biomarker in a patient, the greater the biomarker group’s intensity, and, thus, lesser the probability of achieving a response on day 28.
The first principal component for aGVHD markers at baseline, excluding CXCL9 and CXCL11, had prognostic value in both models. However, in the day 14 model, the similar coefficient of the first principal component for the day 14 aGVHD subset canceled out baseline and changed from baseline, indicating that the levels of aGVHD markers on day 14 had an effect on the probability of response, rather than a change from baseline at day 14. Increased levels of aGVHD markers (excluding CXCL9 and CXCL11) were associated with reduced probability of response. The aGVHD group included 2 biomarkers indicative of specific organ involvement, REG-3α (GI) and PI3 (skin). Future analyses could include more recently identified organ-specific markers, such as glucagon-like peptide 2, which is elevated in patients with GI GVHD and is associated with a higher incidence of nonrelapse mortality.30
In addition to the first principal component noted earlier, the third principal component of the immune category of markers at baseline also appeared to have a prognostic value in both models, but the evidence was only significant for the day 14 model (P = .05 vs P = .12), in which the regression coefficient was positive (indicating an increased likelihood of response). The third principal component represented the contrast of Tregs vs NK cells, CD8+ T cells, and B cells. Though B cells emerged dominant in principal component 2 (supplemental Table 4), this may be interpreted with caution because B cells are conventional components in chronic and not acute GVHD.31
The bias-corrected AUROC values were >0.72 for both models, indicating a strong monotonic relationship between the fitted and actual probabilities. The accuracy and calibration of the day 14 model were greater than those of the baseline model. In the baseline model, estimated probabilities of response <0.4 were likely to be overestimates of the actual probability. Future refinements of the models are possible using additional data. For example, revised transformations or the inclusion of nonlinear components can address the miscalibration of estimated P < .4. However, making these adjustments based on the current data set could induce overfitting, which would be difficult to characterize.
Although only the main effects were included in the 2 models, the contribution of higher-order terms (nonlinearities or interactions) cannot be ruled out. The model-building process included such higher-order terms but applied coefficient penalties to optimize the Akaike information criterion corrected for a small sample size. This exploratory method for model building mitigates overfitting while allowing higher-order terms if they sufficiently improve the Akaike information criterion. For these models, the optimal penalties for groups of higher-order terms were effectively infinite; thus, the coefficients for such terms were excluded from the models.
Because ruxolitinib treatment has shown efficacy in treating aGVHD and is highly important in the models generated, treatment likely drives some variation in these markers. However, this relationship was not investigated using our model. Regardless, in these models, treatment still conveyed important information, even when accounting for biomarker values and vice versa. Based on the current data, there were no indications of a differential biomarker role between treatment arms; the levels of biomarkers in the biomarker groups were prognostic for response regardless of the treatment received.
If a clinical diagnosis is to be deployed, a subset of assays may be selected. We did not investigate specific subsets, although the important coefficients for the principal components offer some direction. For the first principal components for the aGVHD and immune biomarker groups, principal component coefficients (except CXCL9 and CXCL11) were similar and shared signs. These biomarker contributions are analogous to replicates: excluding some would lose precision, but no critical information. For principal components beyond the first, biomarkers with larger PC coefficients should be preferred.
Overall, the results of this analysis highlight the prominent role of ruxolitinib vs BAT in increasing the probability of response on day 28 in patients in the REACH2 study. The levels of aGVHD markers at baseline and on day 14 affected the probability of patient response in both the treatment arms. Immune cell markers at baseline were also noted to have a potential prognostic value. Finally, skin aGVHD at baseline, age, and conditioning regimen were the variables of interest in 1 or both models for their effect on the probability of response at day 28. These findings should be confirmed in future studies to establish applications in clinical practice.
Acknowledgments
The REACH2 trial (NCT02913261) was designed and the data were analyzed by the sponsor (Novartis) in collaboration with the trial steering committee. Funding for this study was provided by Novartis and Incyte. Writing and editorial assistance were provided by Jenna M Gaska, (ArticulateScience, LLC) and Tarveen Jandoo (Novartis Healthcare Pvt. Ltd) and was funded by Novartis. R.Z. was supported by the Deutsche Forschungsgemeinschaft, Germany (SFB-1479 Project ID: 441891347).
Authorship
Contribution: J.G. and A.P. analyzed the data; and all authors had access to primary clinical trial data, are responsible for the accuracy and completeness of the data, and for the fidelity of the trial to the protocol.
Conflict-of-interest disclosure: R.Z. received honoraria from Novartis, Incyte, and Mallinckrodt. G.S. received honoraria and lecture fees and travel grants from Novartis, Incyte, Xenikos, and Elsalys. D.N. received honoraria from Novartis, Cellectis, and Amgen and has participated on advisory boards with Bayer and is the President of Worldwide Network for Blood & Marrow Transplantation (WBMT). N.v.B received honoraria from Novartis and Takeda, a travel grant from Gilead, and is a steering committee member with Novartis. J.G. has stock options with Novartis. J.S. has received consulting fees from Novartis, Takeda, Alexion, and Sobi, honoraria from Takeda, Alexion, and Sobi, and has participated in advisory boards with Eli Lilly.
A complete list of the REACH2 investigators appears in the supplemental Appendix.
Correspondence: Gerard Socié, Assistance Publique Hôpitaux de Paris, Hématologie-Transplantation, Hôpital St Louis, Université de Paris-Cité, Paris, France, INSERM Unité Mixte de Recherche 976, Paris, France; e-mail: gerard.socie@aphp.fr.
References
Author notes
∗G.S. and D.N. contributed equally to this work.
Novartis is committed to providing qualified external researchers with access to patient-level data and supporting clinical documents from eligible studies. These requests are reviewed and approved by an independent review panel on the basis of scientific merit. All data provided is anonymized to respect privacy of patients who have participated in the trial in line with applicable laws and regulations. Data availability from this trial is in accordance with the criteria and process described in the clinical study data request platform at www.clinicalstudydatarequest.com.
The online version of this article contains a data supplement.
There is a Blood Commentary on this article in this issue.
The publication costs of this article were defrayed in part by page charge payment. Therefore, and solely to indicate this fact, this article is hereby marked “advertisement” in accordance with 18 USC section 1734.

