

Key Points
DBA erythroid precursors with ribosomal protein haploinsufficiency interfere with the erythroid differentiation of genetically normal cells.
Erythroblastic island macrophages process the heme exported from erythroblasts and may mediate this interference.

Abstract
We follow a patient with Diamond-Blackfan anemia (DBA) mosaic for a pathogenic RPS19 haploinsufficiency mutation with persistent transfusion-dependent anemia. Her anemia remitted on eltrombopag (EPAG), but surprisingly, mosaicism was unchanged, suggesting that both mutant and normal cells responded. When EPAG was withheld, her anemia returned. In addition to expanding hematopoietic stem/progenitor cells, EPAG aggressively chelates iron. Because DBA anemia, at least in part, results from excessive intracellular heme leading to ferroptotic cell death, we hypothesized that the excess heme accumulating in ribosomal protein-deficient erythroid precursors inhibited the growth of adjacent genetically normal precursors, and that the efficacy of EPAG reflected its ability to chelate iron, limit heme synthesis, and thus limit toxicity in both mutant and normal cells. To test this, we studied Rpl11 haploinsufficient (DBA) mice and mice chimeric for the cytoplasmic heme export protein, FLVCR. Flvcr1-deleted mice have severe anemia, resembling DBA. Mice transplanted with ratios of DBA to wild-type marrow cells of 50:50 are anemic, like our DBA patient. In contrast, mice transplanted with Flvcr1-deleted (unable to export heme) and wild-type marrow cells at ratios of 50:50 or 80:20 have normal numbers of red cells. Additional studies suggest that heme exported from DBA erythroid cells might impede the nurse cell function of central macrophages of erythroblastic islands to impair the maturation of genetically normal coadherent erythroid cells. These findings have implications for the gene therapy of DBA and may provide insights into why del(5q) myelodysplastic syndrome patients are anemic despite being mosaic for chromosome 5q deletion and loss of RPS14.
Introduction
Diamond-Blackfan anemia (DBA) is a congenital hypoproliferative anemia and the first human disease linked to ribosomal dysfunction.1 Autosomal dominant haploinsufficiency of the ribosomal protein (RP) RPS19 accounts for 25% of cases. Loss-of-function mutations or deletions in 20 other genes involved in ribosomal biogenesis are also linked to DBA, accounting for an additional 55% of patients with DBA.1,2 However, how RP deficiency and impaired messenger RNA translation cause ineffective erythropoiesis is unclear. Decreased erythroid proliferation, decreased erythroid differentiation, and increased erythroid progenitor apoptosis have been linked to different RP mutations, and may affect common pathways involving stabilization of p53 protein and activation of p53 targets, increased caspase-induced cleavage of GATA1, and/or decreased GATA1 expression.1 However, none of these abnormalities fully explain the erythroid tropism of DBA.1 Lack of pathophysiologic understanding hampers design of rational targeted therapies. Current treatments remain corticosteroids, which are effective and/or tolerated in a minority of patients, red blood cell transfusions, or allogeneic hematopoietic stem cell transplantation.
A unifying pathophysiologic concept was introduced by our group several years ago.3 We hypothesized that the anemia in DBA, as well as in del(5q) myelodysplastic syndrome (MDS) phenocopying DBA with an acquired loss of RPS14, is due to slowed globin chain synthesis and secondary heme toxicity. We found evidence for impaired and delayed translation of globin in DBA erythroid precursors, heme and reactive oxygen species (ROS) excesses, and proerythroblast cell death, which improved when heme synthesis was reduced.3 GATA1 deficiency can result from and can contribute to globin/heme disequilibrium.4,5 These findings suggested that patients with DBA might benefit from interventions that decrease or slow heme production in developing erythroid cells and thus rebalance heme and globin synthesis.
We recently reported that the 1 patient with DBA enrolled in a trial of the drug eltrombopag (EPAG) for patients with moderate aplastic anemia or unilineage hypoproliferative cytopenias had a robust drug-dependent erythroid response.6 EPAG was designed as a thrombopoietin (TPO) agonist, but given the lack of TPO receptors on developing erythroid cells7 and the finding that EPAG is an extremely potent intracellular iron chelator,8 we postulated that this response reflected heme depletion. Here, we present the surprising finding that this patient was mosaic for a pathogenic RSP19 mutation and was persistently anemic before EPAG therapy despite the presence of many unmutated hematopoietic stem and progenitor cells (HSPCs). This suggests excess heme present in RP-deficient erythroid precursors could inhibit normal precursors. We next used RP and FLVCR murine models to investigate these interactions, with implications for gene and transplantation therapies of DBA.
Methods
Clinical protocol, sample processing, and analysis
Blood and skin biopsy were obtained on an institutional review board–approved protocol after informed consent. The patient participated in a prospective phase 2 dose escalation study of EPAG (#NCT01328587) approved by the National Heart, Lung, and Blood institutional review board. Details of the protocol and study results were previously published.6 Bone marrow mononuclear cells (BMMNCs) were sorted after staining with the monoclonal antibodies given in supplemental Table 1 on the Blood Web site. BMMNCs were plated in colony-forming unit (CFU) assays under either myeloid or erythroid conditions and individual CFUs were analyzed for RPS19 mutations. Quantitation of the fraction of mutated RPS19 alleles (RPS19 c.356 + 3A>C) was performed via droplet digital polymerase chain reaction (PCR; Bio-Rad, CA). Primers and probes were designed by Bio-Rad (unique assay number: dMDS474462401). For polysome profiling, allelic mapping, and RPS19 RNA expression and splicing analyses, see supplemental Methods.
Animals and transplant studies
Inducible deletion of adult Flvcr+/+;Mxcre (Mx control), Flvcrflox/flox;Mxcre (Flvcr1-deleted), Rpl11+/+;ERT2cre (T2 control), and Rpl11+/lox;ERT2cre (Rpl11 haploinsufficient) mice was performed as reported.9,10 Ubiquitin green fluorescent protein (GFP) transgenic mice11 were used as wild-type (WT) donors in competitive transplantation studies. Whole marrow isolated from Flvcr1-deleted, Mx control, Rpl11 haploinsufficient, and T2 control mice was mixed with whole marrow from GFP transgenic mice and transplanted into myeloablated CD45.1/2 F1 recipients. The frequency of GFP+ cells in each lineage was determined by flow cytometry. Erythroblastic islands (EBIs) were isolated as described.12 Total RNA was isolated and analyzed via quantitative PCR.13 Antibody and probe sets are listed in supplemental Tables 2 and 3. See supplemental Materials for additional details.
Results
Index patient clinical history
The patient is a 33-year-old Hispanic woman diagnosed with DBA at the age of 1 month because of severe hyporegenerative normochromic anemia (hemoglobin, 2.9 g/dL; absolute reticulocyte count, 28 000/μL). She was transfusion dependent and had chronic iron overload despite intermittent chelation therapy (see supplemental Materials). She was found to have a predicted pathogenic novel mutation in intron 4 (c.356 + 3 A>C) of the RPS19 gene, disrupting a splice donor site previously implicated in DBA.14 No other mutations were identified on the 2021 Inherited Bone Marrow Failure Sequencing Panel (University of Chicago Genomics).
Response of the index patient to EPAG
At age 25 years, the transfusion-dependent patient was enrolled in a phase 2 clinical trial (NCT01328587) of EPAG. She was the sole patient with DBA entered. Details of the treatment regimen and overall trial results have been reported.6 The patient’s anemia responded by the primary endpoint of 16 weeks, and she received her last red blood cell transfusion the day before EPAG initiation (Figure 1A). She continued EPAG on the extension protocol for 6 more months. Then, EPAG was discontinued per protocol for a sustained robust response (hemoglobin >10 g/dL). After discontinuation, the patient's hemoglobin steadily declined. After 8 months, EPAG was reinitiated at the previous dose, with resolution of anemia.

Clinical and molecular analyses of a patient with RSP19 mosaic DBA. (A) Hemoglobin level (left y-axis) is plotted as a function of time in months from eltrombopag initiation to present. Blue shading indicates dosing of eltrombopag (right y-axis). Red triangles indicate RBC transfusions; green triangle indicates a single therapeutic phlebotomy for iron removal (ferritin was 2985 mcg/L, see panel B). (B) Ferritin (left y-axis) is plotted as a function of time from eltrombopag initiation to present. Blue shading indicates dosing of eltrombopag (right y-axis). (C) Fraction of mutant alleles (RPS19 c.356 + 3A>C) in cultured skin fibroblasts, bone marrow mononuclear cells, and marrow subpopulations measured by digital droplet PCR at different time points in months in relation to eltrombopag initiation. (D) Fraction of mutant allele of granulocyte–macrophage and erythrocyte colony-forming unit (CFU-GM and CFU-E) grown from the patient’s bone marrow before and on treatment with eltrombopag. All CFUs were wild-type or heterozygous-mutated. Grans, granulocytes; NRBC, nucleated red blood cells; RBC, red blood cells.
Clinical and molecular analyses of a patient with RSP19 mosaic DBA. (A) Hemoglobin level (left y-axis) is plotted as a function of time in months from eltrombopag initiation to present. Blue shading indicates dosing of eltrombopag (right y-axis). Red triangles indicate RBC transfusions; green triangle indicates a single therapeutic phlebotomy for iron removal (ferritin was 2985 mcg/L, see panel B). (B) Ferritin (left y-axis) is plotted as a function of time from eltrombopag initiation to present. Blue shading indicates dosing of eltrombopag (right y-axis). (C) Fraction of mutant alleles (RPS19 c.356 + 3A>C) in cultured skin fibroblasts, bone marrow mononuclear cells, and marrow subpopulations measured by digital droplet PCR at different time points in months in relation to eltrombopag initiation. (D) Fraction of mutant allele of granulocyte–macrophage and erythrocyte colony-forming unit (CFU-GM and CFU-E) grown from the patient’s bone marrow before and on treatment with eltrombopag. All CFUs were wild-type or heterozygous-mutated. Grans, granulocytes; NRBC, nucleated red blood cells; RBC, red blood cells.
Over the next 6 years, 2 slow tapers of EPAG were attempted, with recurrence of moderate to severe anemia when the EPAG dose was lowered to less than 75 mg/d or discontinued (Figure 1A). Of note, the ferritin level declined slowly, consistent with prior observations in marrow failure patients receiving prolonged EPAG because of potent iron chelation by the drug8 (Figure 1B). Bone marrow morphology normalized on EPAG, with an increase in erythroid maturation and no dysplasia. Twice-yearly cytogenetics were normal, and sequencing was negative for myeloid somatic mutations at baseline and after 5 years.6
Hematologic mosaicism in the index patient
Review of the patient’s whole peripheral blood ribosomal gene germline sequencing panel revealed a lower-than-expected variant allele frequency (VAF = 24%) for the RSP19 mutation. Blood cells from both parents were negative for the mutation, implying a de novo mutation in the patient. We performed digital droplet PCR to quantitate VAFs in various cell types from the patient (Figure 1C). Skin fibroblasts had a VAF of 50% (as predicted for nonmosaic heterozygous mutations), whereas BMMNCs and whole blood had lower VAFs of between 25% and 37%, consistent with mosaicism, whether on or off EPAG, with no appreciable change over a span of more than 12 years. Samples collected while the patient was on or off EPAG were sorted by flow cytometry. Blood B and T lymphocytes had VAFs of 42% to 45% vs lower VAFs of 24% to 32% in granulocytes and marrow CD34+ HSPCs. Of note, marrow erythroid progenitors (CD45–CD71+) had the lowest VAF of 8% to 14%, with no clear difference on or off EPAG. Bone marrow cells collected from the patient on or off EPAG were cultured in methylcellulose and individual myeloid and erythroid CFUs were genotyped. The fraction of heterozygous mutant myeloid colonies did not change when the patient was on or off EPAG. The fraction of heterozygous mutant erythroid colonies trended lower than mutant myeloid colonies (7/49 or 14% in erythrocyte CFUs [CFU-Es] vs 15/50 or 30% in granulocyte–macrophage CFUs [CFU-GMs]; P = .090, Fisher exact test), and somewhat higher on EPAG (23% on vs 14% off EPAG) (Figure 1D). There were no apparent morphological differences between the WT and mutant CFU-Es or CFU-GMs (supplemental Figure 1).
A high-density single nucleotide polymorphism array on patient peripheral blood mononuclear cell culture samples collected in 2012 and 2018 showed the region of the long arm of chromosome 19 containing the RPS19 gene was mosaic, with evidence for uniparental disomy (UPD) (Figure 2A). Between 2012 and 2018, there was a slow increase in the degree of UPD, without a change in overall intensity, indicating copy number–neutral UPD. Thus, mosaicism was due to UPD, with evidence for mild selection for the WT allele over time at the HSPC level, but no impact on transfusion dependence at the current level of mosaicism before or during discontinuation of EPAG.

Molecular characterization and pathology of the patient’s novel RPS19 mutation. (A) The patient’s 2012 and 2018 chromosome 19 single nucleotide polymorphism genotype: the upper pattern is the B allele frequency and the lower pattern is the log R ratio. Red arrows indicate the B allele frequency splitting widening over time; blue arrows indicate no change in intensity of the total alleles. (B) Identification and visualization of RPS19 transcripts using the Integrative Genome Viewer. De novo transcript assembly identified 2 transcripts that mapped to the RPS19 gene locus (MSTRG.7258.1 and MSTRG.7258.2) and are shown below the reference RPS19 locus. Of note, although MSTRG.7258.1 resembles the reference transcripts, MSTRG.7258.2 lacks exon 4 (red box). (C) The normalized FPKM values of the indicated RPS19 transcripts are shown for all samples. MSTRG.7258.1, the WT transcript, was expressed in all samples, but MSTRG.7258.2 was expressed in the patient sample. (D) Patient and control complementary DNA transcripts were amplified using primers in exon 3 and exon 5 of the RPS19 gene. The red arrow indicates the WT transcript; the blue arrow the truncated transcript skipping exon 4 found in the patient but not control. Results were validated by Sanger sequencing. (E) 40s and 60s ribosomal subunit abundance determined by the areas under the peaks to calculate 40s/60s abundance ratios. Bars indicate standard deviation (n = 3). *P < .05. FPKM, fragments per kilobase per million.
Molecular characterization and pathology of the patient’s novel RPS19 mutation. (A) The patient’s 2012 and 2018 chromosome 19 single nucleotide polymorphism genotype: the upper pattern is the B allele frequency and the lower pattern is the log R ratio. Red arrows indicate the B allele frequency splitting widening over time; blue arrows indicate no change in intensity of the total alleles. (B) Identification and visualization of RPS19 transcripts using the Integrative Genome Viewer. De novo transcript assembly identified 2 transcripts that mapped to the RPS19 gene locus (MSTRG.7258.1 and MSTRG.7258.2) and are shown below the reference RPS19 locus. Of note, although MSTRG.7258.1 resembles the reference transcripts, MSTRG.7258.2 lacks exon 4 (red box). (C) The normalized FPKM values of the indicated RPS19 transcripts are shown for all samples. MSTRG.7258.1, the WT transcript, was expressed in all samples, but MSTRG.7258.2 was expressed in the patient sample. (D) Patient and control complementary DNA transcripts were amplified using primers in exon 3 and exon 5 of the RPS19 gene. The red arrow indicates the WT transcript; the blue arrow the truncated transcript skipping exon 4 found in the patient but not control. Results were validated by Sanger sequencing. (E) 40s and 60s ribosomal subunit abundance determined by the areas under the peaks to calculate 40s/60s abundance ratios. Bars indicate standard deviation (n = 3). *P < .05. FPKM, fragments per kilobase per million.
Index patient has a novel pathogenic RPS19 mutation
Given that the patient’s RPS19 mutation has not been previously reported but is predicted pathogenic based on disrupted splicing in a similar mutation,14 we performed bulk RNA sequencing on BMMNC samples collected from the patient with DBA and 3 healthy controls. The patient had 2 distinct RPS19 transcripts (Figure 2B): 1 full-length WT transcript containing all 5 exons (MSTRG.7258.1) and a shorter transcript (MSTRG.7258.2) lacking exon 4, as predicted from the mutation location. The mutant RPS19 transcript accounted for ∼22% of all transcripts, matching the percent of mutant cells in the patient’s BMMNCs at that time. Total RPS19 transcripts were decreased 47% in the patient compared with control samples, despite comparable sequencing coverage (Figure 2C). Abnormal RPS19 splicing in the DBA patient samples was confirmed by targeted PCR and Sanger sequencing (Figure 2D).
To confirm impact of this mutation on ribosomal biogenesis, we performed polysome profiling on cultured T cells from the patient, the patient’s mother (mutation negative), and 2 unrelated controls. There was a significant decrease in the 40S/60S ribosome subunit abundance ratio in the patient sample (Figure 2E), consistent with the predicted 40S ribosomal biogenesis defect and confirming that the RPS19 mutation was pathogenic.
Disparate impact of mixed chimerism in Rpl11 vs Flvcr1 mutant mice
The striking response of the patient to EPAG led us to use a well-characterized murine Rpl11 haploinsufficiency model of DBA10,15 to ask whether and how RP-deficient erythroid progenitors could inhibit output from WT erythroid progenitors. Both Flvcr1-deleted and this mouse model display a CFU-E/proerythroblast block resulting in ineffective erythropoiesis and reticulocytopenia (Mx control, 5.03 ± 0.83 × 10⁵/μL; Flvcr1-deleted, 3.16 ± 0.47 × 10⁵/μL; P = .003; T2 control, 4.74 ± 0.14 × 10⁵/μL; Rpl11 haploinsufficient, 3.58 ± 0.34 × 10⁵/μL; P = .003) without evidence of significant stem cell defects.9,10,13,15,16 Both have macrocytosis and anemia. In Flvcr1-deleted mice, deletion of the heme exporter FLVCR results in heme toxicity because of early erythroid progenitors being unable to export heme during the short lag between the upregulation of erythroid heme synthesis and production of globin chains able to bind heme.13 Ribosomal protein haploinsufficiency in Rpl11-mutant mice results in slowed protein synthesis and hence insufficient globin production in CFU-E/Proerythroblasts. In contrast, the small amount of heme synthetic enzymes is sufficient for normal heme synthesis. The resulting intracellular heme accumulation overwhelms heme export mechanisms, leading to macrocytic anemia.10
We previously demonstrated that as little as 5% WT marrow cells mixed with 95% Flvcr1-deleted marrow cells in a competitive transplantation model completely reversed anemia and macrocytosis,16 documenting the expected cell-intrinsic erythroid defect associated with FLVCR loss that can be compensated for by increased erythropoiesis by even a small fraction of normal HSPCs. To determine whether the presence of normal HSPCs could reverse anemia and macrocytosis in the Rpl11 DBA model, we performed competitive transplantations using mixtures of WT GFP+ cells and Rpl11 heterozygous cells at varying ratios (Figure 3A). Heterozygous gene deletion in Rpl11 mice induced by tamoxifen treatment 5 weeks before transplantation was very efficient (supplemental Figure 2) and resulted in the expected degree of anemia and macrocytosis in both Rpl11-haploinsufficient donor mice and myeloablated congenic recipient mice transplanted with 100% Rpl11-haploinsufficient marrow mononuclear cells (Figure 3B; supplemental Figure 3). Engraftment was complete at this dose of myeloablation (1.6 ± 0.7% CD45.1/2+ peripheral blood mononuclear cell culture host cells 8 weeks after transplantation). However, mice transplanted with 50% and 80% Rpl11-haploinsufficient marrow cells mixed with WT (GFP+) competitor cells (termed Rpl11-chimeras) showed only partial improvement in anemia and macrocytosis, with the degree of improvement correlating with the ratio of normal competitor cells transplanted (ie, more normal cells resulted in more improvement; Figure 3B-C, supplemental Figure 3). This is in marked contrast to studies using the same competitive transplantation design with Flvcr1-deleted marrow cells, termed Flvcr-chimeras (Figure 3B-C) and our previous studies in which as few as 5% normal HSPCs completely corrected anemia and macrocytosis.16
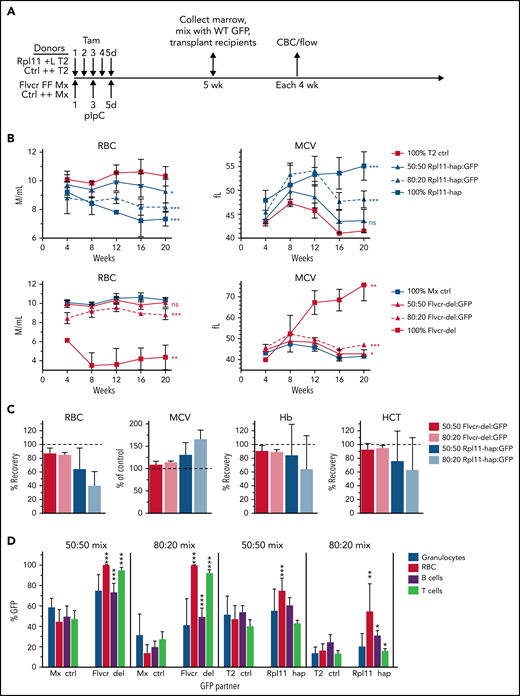
Rpl11 haploinsufficient chimeras model DBA mosaicism. (A) The experimental design for generation of 0%, 50%, 80%, and 100% mutant chimeras and their controls. Flvcr1-deleted (FFMx) and Mxcre (++Mx) control mice are treated with pIpC, whereas Rpl11 haploinsufficient (+LT2) and T2cre (++T2) control mice are treated with tamoxifen starting 5 weeks before transplant. Marrow cells from femurs and tibias from the deleted and control mice were mixed with wild-type marrow cells from untreated ubiquitin-GFP mice (WT GFP) at 50:50 and 80:20 ratios and then transplanted into recipient mice. Because mice receiving 100% Flvcr1-deleted marrow succumb to severe anemia by 7 weeks posttransplant,13 the 100% FFMx and control ++Mx transplants were performed before pIpC treatment. These recipient mice were then treated with pIpC after engraftment 4 weeks later. Deletion efficiency of donor mice is shown in supplemental Figure 1. (B) Monthly analysis of red cell counts and MCV of Rpl11 chimeras, Flvcr chimeras, along with their respective cre control chimeras. (C) The relative RBC, Hb, and HCT of Rpl11 and Flvcr chimeras compared with transplants that received 100% deleted (0% recovery) or control (100% recovery) marrow. MCV is presented as a percent of control transplants. (D) The frequency of peripheral blood granulocytes, RBC, B cells, and T cells that were from the WT (GFP+) partner cells in the chimeric mice 16 weeks after transplant are shown with significant differences compared with the respective control chimeras indicated. Data are presented as mean ± standard deviation (mean ± standard error of the mean, panel C) from 3 to 8 Flvcr chimeras, 6 Mx control chimeras, 6 to 9 Rpl11 chimeras, and 7 T2 control chimeras. *P < .05; **P < .01; ***P < .001 from Student t test. CBC, complete blood count; ctrl, control; Hb, hemoglobin; HCT, hematocrit; MCV, mean corpuscular volume; pIpC, polyI-polyC.
Rpl11 haploinsufficient chimeras model DBA mosaicism. (A) The experimental design for generation of 0%, 50%, 80%, and 100% mutant chimeras and their controls. Flvcr1-deleted (FFMx) and Mxcre (++Mx) control mice are treated with pIpC, whereas Rpl11 haploinsufficient (+LT2) and T2cre (++T2) control mice are treated with tamoxifen starting 5 weeks before transplant. Marrow cells from femurs and tibias from the deleted and control mice were mixed with wild-type marrow cells from untreated ubiquitin-GFP mice (WT GFP) at 50:50 and 80:20 ratios and then transplanted into recipient mice. Because mice receiving 100% Flvcr1-deleted marrow succumb to severe anemia by 7 weeks posttransplant,13 the 100% FFMx and control ++Mx transplants were performed before pIpC treatment. These recipient mice were then treated with pIpC after engraftment 4 weeks later. Deletion efficiency of donor mice is shown in supplemental Figure 1. (B) Monthly analysis of red cell counts and MCV of Rpl11 chimeras, Flvcr chimeras, along with their respective cre control chimeras. (C) The relative RBC, Hb, and HCT of Rpl11 and Flvcr chimeras compared with transplants that received 100% deleted (0% recovery) or control (100% recovery) marrow. MCV is presented as a percent of control transplants. (D) The frequency of peripheral blood granulocytes, RBC, B cells, and T cells that were from the WT (GFP+) partner cells in the chimeric mice 16 weeks after transplant are shown with significant differences compared with the respective control chimeras indicated. Data are presented as mean ± standard deviation (mean ± standard error of the mean, panel C) from 3 to 8 Flvcr chimeras, 6 Mx control chimeras, 6 to 9 Rpl11 chimeras, and 7 T2 control chimeras. *P < .05; **P < .01; ***P < .001 from Student t test. CBC, complete blood count; ctrl, control; Hb, hemoglobin; HCT, hematocrit; MCV, mean corpuscular volume; pIpC, polyI-polyC.
We next evaluated the frequency of WT (GFP+) competitor cells among the erythroid vs myeloid cells of the chimeric mice (Figure 3D). Rpl11-chimeras had only a partial increase in WT (GFP+) red cells (3.4-fold) compared with control chimeras, whereas Flvcr1-deleted chimeras, which increased to 100% WT (GFP+) red cells, had a sevenfold increase over controls. In contrast, for neutrophils, the %GFP+ cells matched the input ratios for both control and Rpl11-chimeras. Thus, erythropoiesis derived from normal competitor HSPCs was unable to expand and produce sufficient red blood cells to compensate for defective Rpl11-haploinsufficient erythroid cells.10,15 This failure of the normal erythroid cells to compensate is consistent with the observations in the mosaic DBA patient.
Inhibition of normal erythropoiesis by Rpl11 haploinsufficient cells in erythroblastic islands
We next investigated possible explanations for the lack of erythroid compensation by WT erythropoiesis. Flvcr1-deleted cells are incapable of exporting heme, whereas RP-haploinsufficient erythroid precursors have intact FLVCR expression and increase heme export in attempt to compensate for their slowed globin synthesis.3,5,17 This led us to hypothesize that excess heme exported from Rpl11-haploinsufficient developing erythroid cells in the chimeric mice (or RPS19-insufficient cells in our patient) is toxic to genetically normal developing erythroid cells held in together in close proximity to mutant erythroid cells by macrophages within EBIs. All erythropoiesis takes place within EBIs,18,19 which comprised a central macrophage and 10 to 50 surrounding adherent erythroid cells.20-23 We hypothesized that the capacity of the EBI central macrophage to break down excess heme or process excess iron was being overwhelmed in the Rpl11-chimeras.
We next asked whether normal and Rpl11 mutant erythroid cells cohabitated within the same EBIs, analyzing EBIs purified from recipient chimeric mice transplanted at least 6 months previously with mixtures of normal and either Rpl11 or Flvcr mutant marrow cells. We recovered intact EBIs with at least 20 erythroid precursor cells associated with a single macrophage (Figure 4A). EBIs from chimeric mice always included erythroid cells from both mutant and normal donors (Figure 4B; supplemental Figure 4), indicating that EBIs are not clonally seeded. Instead, output from multiple independent precursors are associated with a macrophage into a single EBI. Flow cytometric analysis showed precursors at all stages of erythroid cell differentiation in the EBIs. Cells at the earlier stages were greatly enriched compared with whole marrow, whereas the cells at later stages were far less prevalent than in whole marrow as anticipated (Figure 4C; supplemental Figure 5).
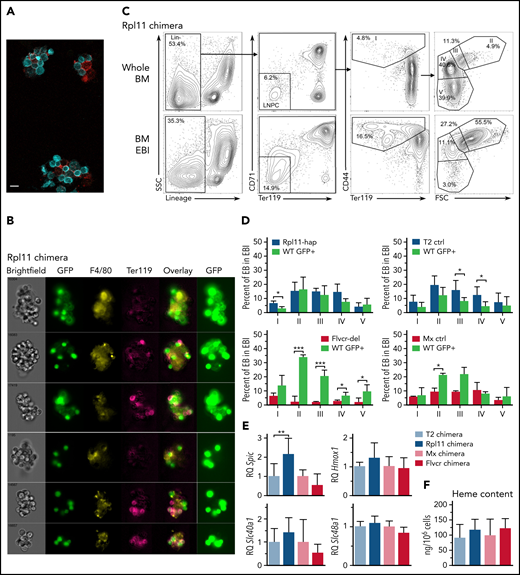
RPL11 haploinsufficient cells prevent expansion of normal erythroid cells on erythroblastic islands. (A) Photomicrograph of 3 erythroblastic islands (EBIs) from wild-type C57Bl/6J mice. Ter119+ cells are in cyan; F4/80+ macrophages are in red. The indicator bar is 10 μM. (B) Representative ImageStream flow cytometry analysis of enriched bone marrow EBI from a 50:50 Rpl11 chimeric transplant mouse showing both GFP+ and Rpl11 haploinsufficient (GFP–) Ter119+ erythroid cells attached within the same EBIs. GFP is overexposed in the panels on the right to aid in resolution of whether the macrophages express GFP or not because macrophage GFP is difficult to detect compared with the very high erythroid GFP expression. The top 3 EBI panels contain GFP+ macrophages. About 2/3 of the imaged EBIs included GFP+ (therefore control WT) macrophages. Of 18 EBIs examined from Rpl11-chimeras, all contained both GFP+ and GFP– Ter119+ erythroid precursors. ImageStream analysis of T2 control and Flvcr-chimeras are in supplemental Figure 4. (C) Representative flow cytometry analysis of mouse bone marrow erythroid precursor cells from a 50:50 Rpl11-chimeric transplant mouse before (whole BM) and after enrichment for erythroblastic islands (BM EBI). Cells are gated to identify BFU-E through reticulocytes as before.13 Gating includes lineage-negative precursors (LNPC), erythroid precursor population I includes BFU-E, CFU-E, and proerythroblasts, whereas populations II-V are basophilic, polychromatic, orthochromatic erythroblasts, and reticulocytes, respectively. The isolated EBIs included between 6.6% and 12.8% of the total marrow mononuclear cells recovered from whole marrow in the chimeric mice. Representative flow analysis of T2 control and Flvcr-chimeras are in supplemental Figure 5. (D) Erythroid precursor cell composition of EBIs isolated from 50:50 chimeras. Rpl11-hap:GFP (N = 3), T2 control:GFP (N = 6), Flvcr-del:GFP (N = 4), and Mx control:GFP (N = 2) mice showing the percentage of cre+ control or mutant erythroblast cells along with the percentage of GFP+ partner cells in each population stage (I-V) of erythroid differentiation in EBI isolated from marrow. (E) Quantitative PCR analysis showing relative expression of heme induced genes Spic, Hmox1, Slc40a1 (ferroportin), and Slc48a1 (HRG1) in F4/80+ EBI macrophages isolated from 50:50 chimeric transplant mice (Rpl11 and T2 control chimeras, N = 5 mice; Flvcr and Mx control chimeras, N = 3 mice). The cre control or mutant F4/80+ macrophages (GFP– and their wild-type (GFP+) chimeric partner F4/80+ macrophages were sorted separately and analyzed as technical replicates to eliminate potential bias from unequal prevalence. (F) Heme content in WT/GFP+ polychromatic erythroblasts (population III) isolated from EBI of chimeric mice (N = 3-8 mice). Data are presented as mean ± standard deviation. *P < .05; **P < .01; ***P < .001 from Student t test. BFU-E, burst-forming unit–erythroid; BM, bone marrow.
RPL11 haploinsufficient cells prevent expansion of normal erythroid cells on erythroblastic islands. (A) Photomicrograph of 3 erythroblastic islands (EBIs) from wild-type C57Bl/6J mice. Ter119+ cells are in cyan; F4/80+ macrophages are in red. The indicator bar is 10 μM. (B) Representative ImageStream flow cytometry analysis of enriched bone marrow EBI from a 50:50 Rpl11 chimeric transplant mouse showing both GFP+ and Rpl11 haploinsufficient (GFP–) Ter119+ erythroid cells attached within the same EBIs. GFP is overexposed in the panels on the right to aid in resolution of whether the macrophages express GFP or not because macrophage GFP is difficult to detect compared with the very high erythroid GFP expression. The top 3 EBI panels contain GFP+ macrophages. About 2/3 of the imaged EBIs included GFP+ (therefore control WT) macrophages. Of 18 EBIs examined from Rpl11-chimeras, all contained both GFP+ and GFP– Ter119+ erythroid precursors. ImageStream analysis of T2 control and Flvcr-chimeras are in supplemental Figure 4. (C) Representative flow cytometry analysis of mouse bone marrow erythroid precursor cells from a 50:50 Rpl11-chimeric transplant mouse before (whole BM) and after enrichment for erythroblastic islands (BM EBI). Cells are gated to identify BFU-E through reticulocytes as before.13 Gating includes lineage-negative precursors (LNPC), erythroid precursor population I includes BFU-E, CFU-E, and proerythroblasts, whereas populations II-V are basophilic, polychromatic, orthochromatic erythroblasts, and reticulocytes, respectively. The isolated EBIs included between 6.6% and 12.8% of the total marrow mononuclear cells recovered from whole marrow in the chimeric mice. Representative flow analysis of T2 control and Flvcr-chimeras are in supplemental Figure 5. (D) Erythroid precursor cell composition of EBIs isolated from 50:50 chimeras. Rpl11-hap:GFP (N = 3), T2 control:GFP (N = 6), Flvcr-del:GFP (N = 4), and Mx control:GFP (N = 2) mice showing the percentage of cre+ control or mutant erythroblast cells along with the percentage of GFP+ partner cells in each population stage (I-V) of erythroid differentiation in EBI isolated from marrow. (E) Quantitative PCR analysis showing relative expression of heme induced genes Spic, Hmox1, Slc40a1 (ferroportin), and Slc48a1 (HRG1) in F4/80+ EBI macrophages isolated from 50:50 chimeric transplant mice (Rpl11 and T2 control chimeras, N = 5 mice; Flvcr and Mx control chimeras, N = 3 mice). The cre control or mutant F4/80+ macrophages (GFP– and their wild-type (GFP+) chimeric partner F4/80+ macrophages were sorted separately and analyzed as technical replicates to eliminate potential bias from unequal prevalence. (F) Heme content in WT/GFP+ polychromatic erythroblasts (population III) isolated from EBI of chimeric mice (N = 3-8 mice). Data are presented as mean ± standard deviation. *P < .05; **P < .01; ***P < .001 from Student t test. BFU-E, burst-forming unit–erythroid; BM, bone marrow.
To determine if the Rpl11 haploinsufficient cells interfere with WT precursor maturation within the same EBIs, we characterized the percentage of precursors from each donor at each stage of differentiation (Figure 4D). EBIs isolated from Flvcr-chimeras showed a significant expansion of the WT (GFP+) cells in populations II-V basophilic erythroblasts, polychromatic erythroblasts, orthochromatic erythroblasts, and reticulocytes, unlike control chimeras (Figure 4D). EBIs from Rpl11-chimeras showed no expansion of WT (GFP+) cells present at each individual stage of differentiation, comparable to the control chimeras. Because there are fewer total red blood cells in the Rpl11-chimeras (Figure 3B), this indicates the block in differentiation in the Rpl11-haploinsufficient cells equivalently affected the WT (GFP+) cells.
We previously showed that a key driver of ineffective erythropoiesis in Rpl11 haploinsufficient mice is excess heme,10 so we evaluated whether EBI macrophages from the Rpl11-chimeras vs control or Flvcr-chimeras showed evidence of exposure to excess heme. Because macrophages efficiently and rapidly degrade heme,23 we were unable to directly measure heme content in EBI macrophages based on the detection sensitivity of the assay. Instead, to investigate possible increased heme exposure in Rpl11-chimeric EBI macrophages, we evaluated expression of heme-responsive genes including the Spic transcription factor, the endosomal heme importer Slc48a1 (HRG1), Hmox1, and the iron exporter Slc40a1 (ferroportin)24-27 (Figure 4E). We found expression of the heme-responsive transcription factor Spic was significantly increased in EBI macrophages from Rpl11-chimeras compared with the control chimeras, but not in EBI macrophages from the Flvcr-chimeras. The changes in the other heme-responsive genes were not significantly different, but they all shared the same trends that were observed with Spic and were consistent with increased heme delivery to the EBI macrophages in the Rpl11-chimeras. This would suggest that the excess heme exported from Rpl11-haploinsufficient precursor cells is interfering with central macrophage function, which in turn impairs expansion and maturation of the adjacent WT cells (Figure 5).
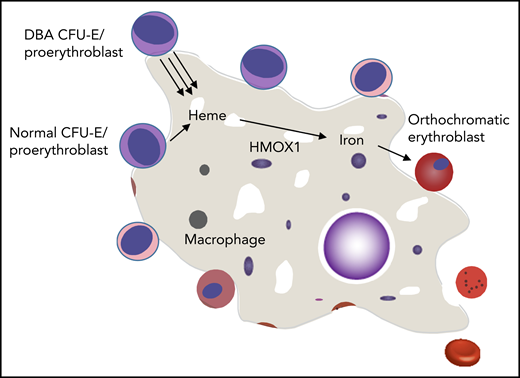
Mechanisms by which normal erythropoiesis would fail. Because EBIs contain both DBA and normal erythroid cells, the high heme export from DBA CFU-E/proerythroblasts to the central macrophage might saturate its uptake mechanism and/or its processing abilities (eg, HMOX1). This could then inhibit further heme export from both DBA and normal CFU-E/proerythroblasts that share this EBI, and both die of resulting heme toxicities. An alternative possibility is that the excessive heme disrupts central macrophage transcription, translation, or hemoprotein formation and thus disrupts its “nurse cell” function, impairing the differentiation of all (ie, DBA and normal) adherent red cell precursors.
Mechanisms by which normal erythropoiesis would fail. Because EBIs contain both DBA and normal erythroid cells, the high heme export from DBA CFU-E/proerythroblasts to the central macrophage might saturate its uptake mechanism and/or its processing abilities (eg, HMOX1). This could then inhibit further heme export from both DBA and normal CFU-E/proerythroblasts that share this EBI, and both die of resulting heme toxicities. An alternative possibility is that the excessive heme disrupts central macrophage transcription, translation, or hemoprotein formation and thus disrupts its “nurse cell” function, impairing the differentiation of all (ie, DBA and normal) adherent red cell precursors.
Recent studies have shown that EPAG increases mouse hematopoietic stem cell (HSC) production but cannot increase platelet numbers, suggesting that it does not function as a TPO receptor agonist in mice28 as predicted by differences in amino acid sequence at the EPAG binding site in the mouse compared with the human TPO receptor MPL. Given our hypothesis that EPAG improved erythropoiesis in our patient with DBA mosaic via intracellular iron chelation and decreased heme accumulation, we tested whether it would improve red cell differentiation and anemia in our murine models. Rpl11-haploinsufficient mice showed no improvement in their anemia with 8 weeks of daily treatment with 50 mg/kg of EPAG (supplemental Figure 6), a dose shown to decrease ROS and protect normal HSC in a prior study.28 Because the anemia of Flvcr1-deleted mice (positive control13) treated concurrently also did not improve, these data suggest that rescue of erythropoiesis in these mice may require higher dosages than achievable orally in mice (see supplemental Results).
Discussion
Previous studies, including our own, have uncovered the importance of close synchronization between heme and globin synthesis in early erythroid progenitors,13 and the role of heme excess in failure to complete erythropoiesis when globin synthesis is slowed because of RP mutations in DBA.3,5 Heme, a toxic molecule, catalyzes ROS formation and releases redox-reactive iron, damaging membranes, proteins, and nucleic acids and inducing inflammation, apoptosis, and iron-specific ferroptosis.29 The only route for erythroid precursors to rid themselves of excess heme is via the FLVCR exporter. In normal cells, this is sufficient to protect erythroid precursors from heme toxicity during the interval before globin chain production initiates, but this pathway is overwhelmed in DBA because of slowed globin chain synthesis, amplified by the premature downregulation of GATA1 by excess heme.4 In addition, high hepcidin levels in patients with DBA and severe anemia downregulates activity of the iron exporter ferroportin, which could further increase the intracellular iron concentration and thus heme production and toxicity.30,31
These pathophysiologic observations suggest that limiting heme synthesis via reduction of the intracellular iron pool could improve erythropoiesis in DBA. The synthetic small molecule EPAG was originally developed as a TPO agonist, able to activate the MPL receptor via direct receptor binding. We observed that patients treated with prolonged high doses of EPAG for aplastic anemia showed marked progressive decreases in ferritin.8 EPAG was shown to be an extremely potent chelator of the intracellular labile iron pool in cell culture studies, resulting in reduction of ROS in iron-replete conditions, with greater activity than other chelators such as deferasirox.32 Recently, EPAG was also demonstrated to dramatically restore erythroid maturation in an induced human pluripotent stem cell model of DBA.33
In addition to anemia reversal via EPAG in our patient with DBA, it is notable that intensive iron chelation with deferasirox has been reported to improve anemia in a significant minority of patients with MDS,34 although no information is available specifically regarding patients with del(5q) MDS, deficient in RPS14. As a small molecule, EPAG can chelate intracellularly and thus can decrease iron trafficking and heme synthesis in erythroid cells before induction of systemic iron deficiency. Whether the HSC-stimulatory properties of EPAG also played a role in the response of our patient is unknown. Some patients with DBA eventually progress to pancytopenia, and many patients have hypocellular marrows morphologically, with a decreased content of primitive HSPCs.35 A phase 2 trial of EPAG in DBA is ongoing (NCT04269889). EPAG might both amplify HSPCs to increase numbers of erythroid precursors and chelate iron to optimize their differentiation.
Our current studies both in our patient with RPS19 mosaic DBA and in our experimental chimeric Rpl11 murine model suggest that excess heme and labile iron have not only cell-autonomous but also cell-nonautonomous toxicity in DBA, preventing compensatory expansion of erythroid output from nonmutated erythroid precursors in vivo. Groups of up to 50 developing erythroid cells are held in proximity by individual bone marrow macrophages in EBIs.36 We have shown that both Rpl11-mutant and WT erythroid precursors are present in individual EBIs from chimeric mice. Thus, macrophages and WT erythroid precursors in the EBIs would be directly exposed to the excess heme and labile iron released from mutant erythroid precursors, either via export of heme through the Flvcr transporter, export of iron via ferroportin, or apoptotic/ferroptotic cell death. Whether the WT erythroid precursors themselves are directly impacted vs via toxicity to the EBI macrophage is not certain. Ahead, single-cell gene expression analyses may help shed light on how erythropoiesis is inhibited in mosaic patients and experimental murine models. It is interesting to note that in our patient, EPAG did not increase the fraction of marrow erythroblasts containing the RPS19 mutation to the higher level observed in myeloid cells or CD34+ HSPCs, suggesting that EPAG did not fully correct the defect in mutant compared with WT erythroid precursors.
Up to 20% of patients with DBA experience spontaneous remissions by age 25 years, characterized by improved red cell production and transfusion independence.37 These remissions are not always stable and therefore might be related to changes in iron homeostasis from growth, chelation, or hormonal changes, but these patients have not been systematically studied for reversion events leading to mosaicism or relationship to iron balance. Recent studies showed patients with RPL11 or RPL24 mutations have a higher frequency of spontaneous remission and that RPL mutations can lead to less severe anemia, but ultimately patients with RPL mutations do not have a higher frequency of transfusion independence.2,38,39 Notably, in several studies describing UPD-mediated mosaicism for RP mutations, anemia persisted despite appreciable fractions of reverted HSPC, as in our index patient.40,41 One patient with a chr15q deletion of RPL4 had resolution of mild postnatal anemia with progressive UPD reversion, eventually reaching homozygosity, suggesting a competitive advantage for reversion at an HSC level, although the deleted region contained multiple other genes,42 which may have contributed to the selection of reverted cells. A threshold effect for inhibition of RP-reverted erythropoiesis by mutant cells was suggested by longitudinal studies in 1 patient that remained transfusion dependent when 50% of blood cells contained an RPS19 mutation but became transfusion independent when the fraction of UPD-corrected HSPCs increased over time to >70%,43 a finding consistent with a dose effect of heme toxicity on WT cells present in mosaic patients. Patients with reversion events may normalize erythropoiesis once most of the cells entering the erythroid lineage no longer produce sufficient labile heme to inhibit WT cells.
Together with the clinical course in our mosaic patient, these reports demonstrate that the presence of even a large fraction of WT HSPCs may not be able to correct abnormal erythropoiesis in DBA. That adult patients with the acquired del(5q) MDS, a phenocopy of the DBA erythroid phenotype linked to heterozygous loss of the RPL14 gene, develop macrocytic anemia before complete replacement of hematopoiesis by the abnormal HSPC clone also supports this model.44 As few as 5% WT murine HSPCs correct anemia and macrocytosis from loss of the heme exporter Flvcr, documenting that a small fraction of WT HSPCs can result in normalization of erythropoiesis when excess heme is retained within mutant cells and is not exported into the EBI environment.16
An increase in WT hematopoietic cells of all lineages over time in several of the DBA cases detailed previously, together with reports of trilineage marrow failure in some adult DBA patients,35 suggest eventual loss of HSPCs from ribosomal dysfunction. Rps19-deficient murine HSPCs had a disadvantage in a competitive repopulation model,45 which may contribute to the ability of WT HSPCs to engraft, expand, and eventually correct anemia in Rps19-deficient recipient mice following nonablative transplantation.46
The possibility that residual mutated DBA erythroid cells could inhibit erythroid output from corrected HSPCs has implications for the development of HSPC gene therapies and nonmyeloablative transplantation strategies for DBA. Gene addition of a normal RPS19 complementary DNA to DBA patient HSPCs or engineered RPS19-deficient HSPCs improved in vitro erythroid colony formation and erythroid differentiation in suspension cultures, but EBIs do not form in these assays and thus a potential inhibitory effect of residual mutant cells cannot be addressed.47,48 Murine HSPCs containing an inducible short hairpin RNA against Rsp19 were transduced with a lentivirus expressing Rps19 or a control vector and transplanted into irradiated recipients.49 Mice engrafted with control vector–transduced cells developed marrow failure and severe anemia following induction of the short hairpin RNA, in contrast to almost normal red blood cell counts in induced mice engrafted with Rps19-vector transduced cells. However, this model results in more severe Rps19 depletion than in heterozygote DBA patients or mice, with a profound impact on HSPC proliferation in vitro and on multilineage in vivo hematopoiesis; thus, it is unclear if erythroid precursors without vector correction persisted. It is possible that the proliferative stress of transplantation following corrective gene addition or editing of HSPCs of patients with DBA would select for successfully corrected HSPCs and a profound engraftment advantage. An increase in WT hematopoietic cells of all lineages over time in several of the DBA cases detailed previously, together with reports of trilineage marrow failure in some adult DBA patients,35 suggest eventual loss of HSPCs because of ribosomal dysfunction. If HSPC selection is not sufficient to eventually increase above a threshold required to restore sufficient erythropoiesis, it will be necessary to address the issue of inhibition of corrected erythroid cells by residual mutant erythropoiesis.
Acknowledgments
The authors thank David Bodine (National Human Genome Research Institute, National Institutes of Health [NIH]) and Thomas Dever (Eunice Kennedy Shriver National Institute of Child Health and Human Development, NIH) for helpful discussions and support. They also thank Evette Barranta for clinical trial management. For author S.K.Y.-B., the views expressed in this manuscript are those of the authors and do not reflect the views of the Department of Defense or the Uniformed Services University of the Health Sciences.
This research was funded by NIH grant HL031823 (J.L.A.), National Heart, Lung, and Blood Institute, Division of Intramural Research funding (C.E.D.), and a Cooperative Research and Development Agreement with Novartis used for clinical trial support.
Authorship
Contribution: R.T.D., Z.P., and C.E.D. designed the clinical study; D.J.Y., T.W., R.D., Z.P., and C.E.D. provided clinical care; R.T.D. and J.L.A. designed the animal studies; R.T.D., S.R.P., X.F., D.J.Y., S.K.Y.-B., and S.C.C. performed the experiments; R.T.D., J.L., K.S., and F.X.D. collected and analyzed data; X.F., R.T.D., J.L.A., and C.E.D. wrote and edited the manuscript; and all authors reviewed and approved the manuscript.
Conflict-of-interest disclosure: The authors declare no competing financial interests.
Correspondence: Janis L. Abkowitz, Division of Hematology, Department of Medicine, University of Washington School of Medicine, Health Sciences Building, Seattle, WA 98195; e-mail: janabk@uw.edu; and Cynthia E. Dunbar, NHLBI, NIH, Building 10-CRC, Room 4E-5132, 10 Center Dr, Bethesda, MD 20892; e-mail: dunbarc@nhlbi.nih.gov.
For original murine and DBA patient data, please contact janabk@uw.edu and dunbarc@nih.gov, respectively.
The online version of this article contains a data supplement.
There is a Blood Commentary on this article in this issue.
The publication costs of this article were defrayed in part by page charge payment. Therefore, and solely to indicate this fact, this article is hereby marked “advertisement” in accordance with 18 USC section 1734.


