Key Points
Kras−/−; NrasQ61R/+ mice develop early onset of T-cell malignancy that recapitulates many biological and molecular features of human ETP-ALL.
We identify Rasgrp1 as a negative regulator of Ras/ERK signaling in oncogenic Nras-driven ETP-like leukemia.

Abstract
Early T-cell precursor acute lymphoblastic leukemia (ETP-ALL) is an aggressive subtype of T-cell ALL. Although genetic mutations hyperactivating cytokine receptor/Ras signaling are prevalent in ETP-ALL, it remains unknown how activated Ras signaling contributes to ETP-ALL. Here, we find that in addition to the frequent oncogenic RAS mutations, wild-type (WT) KRAS transcript level was significantly downregulated in human ETP-ALL cells. Similarly, loss of WT Kras in NrasQ61R/+ mice promoted hyperactivation of extracellular signal-regulated kinase (ERK) signaling, thymocyte hyperproliferation, and expansion of the ETP compartment. Kras−/−; NrasQ61R/+ mice developed early onset of T-cell malignancy that recapitulates many biological and molecular features of human ETP-ALL. Mechanistically, RNA-sequencing analysis and quantitative proteomics study identified that Rasgrp1, a Ras guanine nucleotide exchange factor, was greatly downregulated in mouse and human ETP-ALL. Unexpectedly, hyperactivated Nras/ERK signaling suppressed Rasgrp1 expression and reduced Rasgrp1 level led to increased ERK signaling, thereby establishing a positive feedback loop to augment Nras/ERK signaling and promote cell proliferation. Corroborating our cell line data, Rasgrp1 haploinsufficiency induced Rasgrp1 downregulation and increased phosphorylated ERK level and ETP expansion in NrasQ61R/+ mice. Our study identifies Rasgrp1 as a negative regulator of Ras/ERK signaling in oncogenic Nras-driven ETP-like leukemia.
Introduction
Early T-cell precursor acute lymphoblastic leukemia (ETP-ALL) is a recently recognized aggressive subtype of T-cell ALL (T-ALL), accounting for ∼12% of T-ALL in children and 7.4% in adults.1 Even with contemporary treatment regimens, ETP-ALL patients still suffer from poor clinical outcomes with higher risk of failure to achieve remission or relapse than those with general T-ALL (non-ETP T-ALL) (72% vs 10% at 10 years). ETP-ALL is characterized by coexpression of myeloid (eg, CD11b[Mac1]) and/or stem cell markers (eg, CD117[cKit]) and expansion of ETP cells. Importantly, ETP-ALL contains prevalent genetic lesions that are rarely identified in general T-ALL but are characteristic for myeloid leukemias. These lesions include activating mutations in genes involved in cytokine receptor/Ras signaling (eg, NRAS, KRAS, and FLT3).2
The mammalian Ras proteins, H-, N-, and K-Ras, belong to the small guanosine triphosphatase (GTPase) superfamily and serve as the master switches in cytokine receptor signaling. They cycle between active guanosine triphosphate (GTP)-bound and inactive guanosine diphosphate (GDP)-bound states.3,4 Conversion of the GTP-bound form to the GDP-bound form is mediated by the intrinsic GTPase activity of Ras proteins, which is greatly accelerated by Ras-associated GTPase-activating proteins. By contrast, conversion of the GDP-bound form to the GTP-bound form is triggered by activation of cytokine receptors and mediated by Ras guanine nucleotide exchange factors (Ras GEFs).
Sos1 and Rasgrp1 are 2 major Ras GEFs with distinct biochemical features and functional roles in T-cell development. Sos1 is ubiquitously expressed in many cell types, including hematopoietic cells.5-7 Its catalytic domain (Soscat) contains a REM domain and a CDC25 homology domain. Consistent with Soscat domain structure, a previous crystallographic study identified 2 distinct binding sites on Soscat8 : the allosteric site binds to active Ras (Ras-GTP), whereas the catalytic site binds to empty Ras. These features set up a positive feedback mechanism of Sos1 activation by Ras-GTP and subsequent additional GTP-loading of Ras,8 leading to high level Ras/extracellular signal-regulated kinase (ERK) signaling.9 Furthermore, Ras-GTP binding to the allosteric site of Sos1 provides an additional membrane anchor,10 which sustains Sos1-mediated Ras/ERK signaling.11 Analogously, oncogenic Ras can hijack this mechanism to amplify cell signaling and greatly boost its transforming activity by cross-activating wild-type (WT) Ras/ERK signaling during tumorigenesis.12-15 During thymic T-cell development, Sos1 is required for pre-T-cell receptor (pre-TCR) signaling.16 Sos1 deficiency leads to reduced pre-TCR-evoked proliferation, differentiation, and phosphorylated ERK (pERK) level in thymocytes.
By contrast, Rasgrp1 is specifically expressed in certain cell types, including thymic T cells.6 Unlike Sos1, Rasgrp1 is not activated allosterically by Ras-GTP and thus its intrinsic Ras GEF activity is 1000-fold lower than allosterically activated Sos1.17 In T-cell development, Rasgrp1 is required for TCR signaling and orchestrates Ras signaling in 2 ways: (1) by activating Ras directly and (2) by providing Ras-GTP that binds the allosteric site of Sos1 to prime and enhance Sos1 in vivo activity.18 Deregulated, overexpressed Rasgrp1 has been described in general T-ALL19,20 and Rasgrp1 overexpression through retroviral transduction or via transgenic expression in thymocytes can trigger general T-ALL-like phenotypes.21-23 Despite its well-established, critical role in the development of T cells in the thymus,6,24 the function of Rasgrp1 in ETP-ALL remains elusive.
Canonical, cancer-associated RAS mutations occur at codons G12, G13, or Q61 and severely compromise the hydrolysis of GTP to GDP, leading to the accumulation of Ras-GTP and hyperactivation of Ras downstream signaling pathways (eg, the Raf/MEK/ERK pathway). Mutations in the KRAS and NRAS genes are frequently identified in several hematological malignancies, including various myeloid disorders (15%-60%), plasma cell myeloma (21%-42%), and ETP-ALL (∼20%).25 In all these malignancies, the frequency of NRAS mutations is significantly higher than that of KRAS mutations.26,27 In contrast to the wide disease spectrum in patients with oncogenic NRAS mutations, we and others show that mice expressing NrasG12D or NrasQ61R from its endogenous locus predominantly develop a myeloid disease, suggesting that oncogenic Nras requires additional genetic mutation(s) to promote lymphoid malignancies.28-30 Here, we show that in the absence of WT Kras, NrasQ61R promotes Rasgrp1 downregulation and an ETP-like leukemia.
Methods
Mice
All mouse lines were maintained in a pure C57BL/6 genetic background (>N10). Kras conditional knockout mice (Krasfl/fl), conditional oncogenic Nras (NrasLox-stop-Lox (LSL) Q61R/+), and Rasgrp1+/− mice were previously described.24,30-33 Mx1-Cre mice were purchased from the Jackson Laboratory. Genotyping of different alleles was performed as previously described.24,30,31
To induce Mx1-Cre expression, 6- to 7-week-old mice were injected intraperitoneally with 100 µg of polyinosinic-polycytidylic acid (pI-pC; GE Healthcare) every other day for a total of 5 times. Treated mice were euthanized either ∼4 weeks after the last pI-pC injection (day 37) or at their moribund stage for analysis. All animal experiments were conducted in accordance with the Guide for the Care and Use of Laboratory Animals and approved by an Animal Care and Use Committee at University of Wisconsin-Madison. The program is accredited by the Association for Assessment and Accreditation of Laboratory Animal Care.
Additional methods are described in supplemental Materials and Methods, available on the Blood Web site.
Results
Loss of WT Kras promotes early onset of highly malignant ETP-like ALL in NrasQ61R/+ mice
We mined previously published datasets of ETP-ALL and general T-ALL (non-ETP childhood T-ALL).2,34 In addition to the prevalent oncogenic NRAS and KRAS mutations in ETP-ALL (18/79; 23%) vs general T-ALL (17/187; 9%), we found that multiple ETP-ALL cases showed heterozygous loss of WT KRAS gene (5/79), which was rare in general T-ALL (4/187) (supplemental Figure 1A-B). Of note, oncogenic RAS mutation occurred along with haploinsufficiency of WT KRAS in 2 ETP-ALL patients. In patients without detectable genetic abnormalities at the KRAS locus, KRAS expression was lower in ETP-ALL cells than that in general T-ALL cells in the cohort reported by Zhang et al2 (supplemental Figure 1C) but not reported by Liu et al (supplemental Figure 1D).34 These data suggest that WT KRAS may have tumor suppressive function in ETP-ALL.
To determine whether downregulation of WT Kras cooperates with oncogenic Nras to promote T-cell malignancies, we generated Krasfl/fl; Mx1-Cre, NrasLSL Q61R/+; Mx1-Cre, Krasfl/+; NrasLSL Q61R/+; Mx1-Cre; and Krasfl/fl; NrasLSL Q61R/+; Mx1-Cre mice as previously described.35,36 At 6 to 7 weeks old, these mice were administrated pI-pC to induce oncogenic Nras expression from its endogenous locus and simultaneously delete Kras expression. The day of the first pI-pC injection was defined as day 1 and all mice were euthanized on day 37 (∼4 weeks after the last pI-pC injection) or upon reaching a moribund stage (Figure 1A). We refer to the pI-pC treated compound mice as Kras−/−, NrasQ61R/+, Kras+/−; NrasQ61R/+, and Kras−/−; NrasQ61R/+ mice, respectively; pI-pC treated Mx1-Cre mice were used as controls throughout the study. We evaluated the efficiency of Kras deletion and oncogenic Nras activation in Kras−/−; NrasQ61R/+ thymocytes on day 37. Kras appeared to be completely deleted in Kras−/− and Kras−/−; NrasQ61R/+ T cells, and the floxed NrasQ61R allele was fully recombined in NrasQ61R/+ and Kras−/−; NrasQ61R/+ thymocytes (Figure 1A).

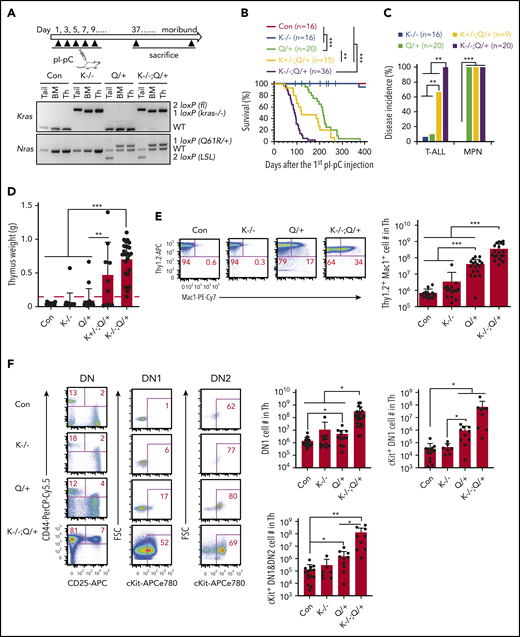
Loss of Kras promotes an early-onset ETP-like ALL in NrasQ61R/+ mice. Six- to 7-week-old Mx1-cre (Con), Kras−/− (K−/−), NrasQ61R/+ (Q/+), Kras+/−; NrasQ61R/+ (K+/−; Q/+), and Kras−/−; NrasQ61R/+ (K−/−; Q/+) mice were treated with pI-pC as described in "Materials and methods." Moribund Q/+ or K−/−; Q/+ mice and age-matched control and K−/− mice were euthanized for analysis. (A) Experimental scheme and genotyping of Kras and Nras alleles in different groups of animals. (B) Kaplan-Meier survival curves were plotted against days after the first pI-pC injection. P values were determined using the log-rank test. (C) Disease incidence in K−/−, Q/+, K+/−; Q/+, and K−/−; Q/+ mice. χ2 analysis was performed. (D) Quantification of thymus weight. T-cell malignancy is defined as thymus weight >150 mg (red dashed line). (E) Quantification of the number of Thy1.2+ Mac1+ thymocytes. (F) Quantification of the number of early T-cell precursors. DN, CD4− CD8− T cells; DN1, CD44+ CD25− DN cells; DN2, CD44+ CD25+ DN cells. Data are plotted as mean + standard deviation (SD). P values were calculated with a 2-tailed Student t test. *P < .05; **P < .01; ***P < .001.
Loss of Kras promotes an early-onset ETP-like ALL in NrasQ61R/+ mice. Six- to 7-week-old Mx1-cre (Con), Kras−/− (K−/−), NrasQ61R/+ (Q/+), Kras+/−; NrasQ61R/+ (K+/−; Q/+), and Kras−/−; NrasQ61R/+ (K−/−; Q/+) mice were treated with pI-pC as described in "Materials and methods." Moribund Q/+ or K−/−; Q/+ mice and age-matched control and K−/− mice were euthanized for analysis. (A) Experimental scheme and genotyping of Kras and Nras alleles in different groups of animals. (B) Kaplan-Meier survival curves were plotted against days after the first pI-pC injection. P values were determined using the log-rank test. (C) Disease incidence in K−/−, Q/+, K+/−; Q/+, and K−/−; Q/+ mice. χ2 analysis was performed. (D) Quantification of thymus weight. T-cell malignancy is defined as thymus weight >150 mg (red dashed line). (E) Quantification of the number of Thy1.2+ Mac1+ thymocytes. (F) Quantification of the number of early T-cell precursors. DN, CD4− CD8− T cells; DN1, CD44+ CD25− DN cells; DN2, CD44+ CD25+ DN cells. Data are plotted as mean + standard deviation (SD). P values were calculated with a 2-tailed Student t test. *P < .05; **P < .01; ***P < .001.
Upon Kras deletion and activation of oncogenic Nras, Kras−/−; NrasQ61R/+ mice had a dramatically shortened survival compared with NrasQ61R/+ mice (50% survival: 89 days vs 216 days), whereas Kras+/−; NrasQ61R/+ mice had an intermediate survival between Kras−/−; NrasQ61R/+ and NrasQ61R/+ mice (50% survival: 152 days) (Figure 1B). Of note, 1/16 Kras−/− mice died with T-ALL (Figure 1C-D). As for NrasQ61R/+ mice, 20/20 died with a significant myeloproliferative neoplasm (MPN) (supplemental Figure 3A) as we previously reported30 and only 2/20 mice developed a significant T-ALL (Figure 1C-D). By contrast, 9/9 Kras+/−; NrasQ61R/+ mice developed MPN and 5/9 died with a T-cell malignancy, whereas all Kras−/−; NrasQ61R/+ mice developed MPN and a highly aggressive T-cell malignancy (supplemental Figure 3A; Figure 1C-D).
We examined thymic T cells, in particular the developmental status of the Thy1.2+ CD4− CD8− double-negative (DN) cells at day 37 (supplemental Figure 2). Depending on the status of CD44 and CD25 expression, normal DN thymocytes can be further divided into 4 successive subpopulations: CD44+CD25− (DN1), CD44+CD25+ (DN2), CD44−CD25+ (DN3), and CD44−CD25− (DN4). In various studies, early T-cell precursors (ETPs) are defined as DN1,37 cKit+ DN1,38 or cKit+ DN1+DN2 cells.39 Compared with control thymi, NrasQ61R/+, Kras+/−; NrasQ61R/+, and Kras−/−; NrasQ61R/+ thymi had increased number of T lymphoblasts simultaneously expressing Mac1, a myeloid cell marker (Thy1.2+ Mac1+) (supplemental Figure 2A) and expansion of ETPs (supplemental Figure 2B). In general, Kras+/−; NrasQ61R/+ mice developed intermediate phenotypes between Kras−/−; NrasQ61R/+ and NrasQ61R/+ mice. Because Kras−/−; NrasQ61R/+ mice rapidly developed T-cell malignancy with a full penetrance, we primarily focused on these mice. Compared with the T-ALL commonly seen in NrasQ61R/+ and other oncogenic Ras mice, the malignant T cells in Kras−/−; NrasQ61R/+ mice were highly invasive and often infiltrated the lung, liver, and mediastinal lymph nodes (supplemental Figure 3B-C). Flow analysis demonstrated that the infiltrating T cells in mediastinal lymph nodes largely preserved the immunophenotypes of those from thymus (supplemental Figure 3D).
At the moribund stage, detailed immunophenotypic analyses showed that in NrasQ61R/+ mice, the number of Thy1.2+ Mac1+ T lymphoblasts significantly increased compared with those in age-matched control and Kras−/− mice (>12-fold) (Figure 1E). This number further increased in Kras−/−; NrasQ61R/+ mice (∼8.4 fold vs NrasQ61R/+ mice) (Figure 1E). Regardless of ETP definitions, we observed a marked expansion of ETP compartment in NrasQ61R/+ mice compared with control (4.5-fold as in DN1, 30-fold in cKit+ DN1, and 14-fold in cKit+ DN1+DN2 cells), and a further expansion in Kras−/−; NrasQ61R/+ mice over NrasQ61R/+ mice (∼43-fold increase in DN1, 82-fold in cKit+ DN1, and 74-fold in cKit+ DN1+DN2 cells) (Figure 1F). Together, the expansion of Mac1+ T cells and ETPs in Kras−/−; NrasQ61R/+ mice suggest that these mice developed an ETP-like ALL.
We transplanted total bone marrow cells from control, NrasQ61R/+, and Kras−/−; NrasQ61R/+ mice 2 days after the last pI-pC injection (day 11). All the recipients of Kras−/−; NrasQ61R/+ cells died within 105 days with a similar ETP-like ALL as that observed in primary Kras−/−; NrasQ61R/+ mice, whereas all the recipients of NrasQ61R/+ cells died much later with either a predominant T-ALL (14/23) or MPN (9/23) (supplemental Figure 4). Our results suggest that Kras−/− and NrasQ61R/+ promoted ETP-like ALL mainly in a cell-autonomous manner.
Upon transplantation of thymic leukemia cells from moribund Kras−/−; NrasQ61R/+ mice into recipients, all the recipient mice died within 5 weeks with a lethal ETP-like leukemia as the donor (supplemental Figure 5A-B). The leukemia cells spread throughout hematopoietic tissues, including bone marrow and spleen (supplemental Figure 5C), indicating that this ETP-like leukemia is transplantable.
Kras−/−; NrasQ61R/+ thymocytes show hyperactivation of ERK signaling, hyperproliferation, and gene signatures characteristic of human ETP-ALL
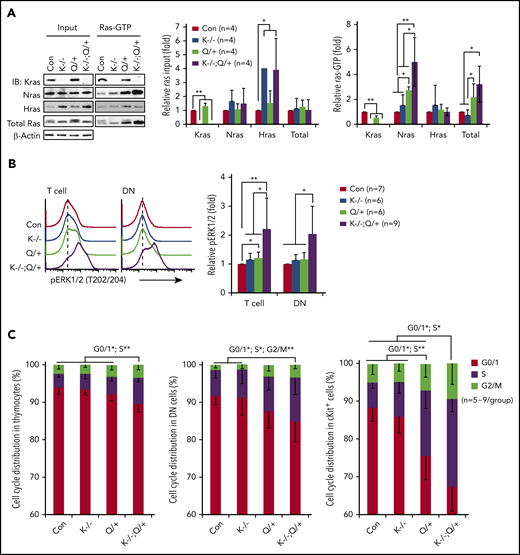
To investigate the mechanisms underlying the T-cell malignancy in Kras−/−; NrasQ61R/+ mice, we first analyzed Ras/ERK signaling in thymic T cells on day 37. Hras expression was upregulated in Kras−/− and Kras−/−; NrasQ61R/+ thymocytes (Figure 2A) but not in Kras−/− myeloid cells or other tissues.31,40 Despite Hras upregulation, Hras-GTP levels remained comparable to that of control cells in Ras-GTP pull down assays, suggesting that Hras was not hyperactivated by NrasQ61R/+. This observation is consistent with our prior result in NrasQ61R/+ myeloid cells.30 NrasQ61R/+ thymocytes exhibited higher levels of Nras-GTP level and increased ERK1/2 signaling compared with control cells, whereas pERK1/2 level in NrasQ61R/+ DN cells was comparable to that of control cells (Figure 2A-B). To our surprise, Nras/ERK signaling was further enhanced in Kras−/−; NrasQ61R/+ thymocytes and DN cells (Figure 2A-B). Associated with hyperactivation of the Nras/ERK pathway, Kras−/−; NrasQ61R/+ thymocytes, DN cells, and cKit+ thymocytes were hyperproliferative (Figure 2C).

Kras−/−; NrasQ61R/+ thymic T cells show hyperactivation of Nras/MEK/ERK signaling and hyperproliferation. Six- to 7-week-old Mx1-cre (Con), Kras−/− (K−/−), NrasQ61R/+ (Q/+), and Kras−/−; NrasQ61R/+ (K−/−; Q/+) mice were treated with pI-pC as described in "Materials and methods." Thymocytes were collected for analysis on day 37. (A) Whole cell lysates (WCL) were extracted and analyzed for expression levels of different Ras isoforms, which were quantified against the levels of β-actin using ImageStudioLite software. Ras-GTP was affinity purified from WCL using a glutathione S-transferase (GST) fusion with the Ras binding domain of Raf (Raf RBD) immobilized on agarose beads. The levels of Ras-GTP bound forms were quantified against the levels of their corresponding Ras isoforms. The ratios of Ras-GTP/Ras in control cells are arbitrarily set at 1. (B) Phosphorylated ERK1/2 (pERK1/2) in the indicated populations of thymocytes were quantified with phospho-flow assay. Representative results from 1 set of experiment and quantification of 6 to 9 independent experiments were shown. (C) Cell-cycle analysis of different populations of thymocytes using 4′,6-diamidino-2-phenylindole (DAPI) staining. Data are presented as mean – SD. P values were calculated with a 2-tailed Student t test. *P < .05; **P < .01.
Kras−/−; NrasQ61R/+ thymic T cells show hyperactivation of Nras/MEK/ERK signaling and hyperproliferation. Six- to 7-week-old Mx1-cre (Con), Kras−/− (K−/−), NrasQ61R/+ (Q/+), and Kras−/−; NrasQ61R/+ (K−/−; Q/+) mice were treated with pI-pC as described in "Materials and methods." Thymocytes were collected for analysis on day 37. (A) Whole cell lysates (WCL) were extracted and analyzed for expression levels of different Ras isoforms, which were quantified against the levels of β-actin using ImageStudioLite software. Ras-GTP was affinity purified from WCL using a glutathione S-transferase (GST) fusion with the Ras binding domain of Raf (Raf RBD) immobilized on agarose beads. The levels of Ras-GTP bound forms were quantified against the levels of their corresponding Ras isoforms. The ratios of Ras-GTP/Ras in control cells are arbitrarily set at 1. (B) Phosphorylated ERK1/2 (pERK1/2) in the indicated populations of thymocytes were quantified with phospho-flow assay. Representative results from 1 set of experiment and quantification of 6 to 9 independent experiments were shown. (C) Cell-cycle analysis of different populations of thymocytes using 4′,6-diamidino-2-phenylindole (DAPI) staining. Data are presented as mean – SD. P values were calculated with a 2-tailed Student t test. *P < .05; **P < .01.
To further characterize the ETP-like leukemia at the molecular level, we performed an RNA-sequencing (RNA-seq) analysis using thymocytes from moribund Kras−/−; NrasQ61R/+ and age-matched control mice (Figure 3). We found that 506 genes were significantly upregulated, and 969 genes were downregulated in Kras−/−; NrasQ61R/+ thymocytes compared with control (fold-change >2 and P < .05) (Figure 3A). Gene set enrichment analysis (GSEA) identified many perturbed gene expression profiles in Kras−/−; NrasQ61R/+ cells (Figure 3B). Consistent with our signaling study (Figure 2A-B), both NRAS signaling and ERK1/2 cascade appeared to be enriched in leukemia cells (Figure 3C). In addition, gene signatures representing hematopoietic stem cells, myeloid cell development (Figure 3D), and IL6/JAK/STAT3 pathway (Figure 3E) were highly enriched in Kras−/−; NrasQ61R/+ thymocytes; many of these expression profiles have been shown to be enriched in an ETP-like leukemia mouse model driven by Ezh2 and Runx1 mutations.38 By contrast, TP53 activity signature was among the most unenriched in Kras−/−; NrasQ61R/+ cells. This result is consistent with prior publications showing that TP53 pathway is significantly downregulated in human ETP-ALL,2 and Ezh2 and p53 double knock-out mice develop an ETP-like leukemia.41 Most importantly, Kras−/−; NrasQ61R/+ cells expressed human ETP-ALL gene signatures (Figure 3G; supplemental Table 1).2 Because EZH2 and RUNX1 mutations concur with RAS mutations in several human ETP-ALL cases (supplemental Figure 1A), we examined Ezh2 and Runx1 genes in our RNA-seq data. None of the 3 ETP samples had a significant clone (variant allele frequency >5%) with Ezh2 or Runx1 coding mutations. To further validate the identity of Kras−/−; NrasQ61R/+ thymocytes, we compared our RNA-seq data with mouse thymic DN vs CD4+ CD8+ DP gene signature (supplemental Figure 6).42 We found that the DN vs DP downregulated genes were enriched in control thymocytes, suggesting that Kras−/−; NrasQ61R/+ thymocytes were predominantly DN cells. Taken together, our data indicate that the T-cell malignancy developed in Kras−/−; NrasQ61R/+ mice recapitulates many molecular features of human ETP-ALL.
![RNA-seq analysis identifies ETP-related gene signatures enriched in Kras−/−; NrasQ61R/+ thymocytes. RNA-seq analysis of thymocytes from moribund Kras−/−; NrasQ61R/+ (K−/−; Q/+) mice (n = 3) and age-matched controls (con) (n = 3). (A) Volcano plot of gene expression in K−/−; Q/+ cells vs control T cells. Dots located in the upper-left and upper-right sections represent 969 down- and 506 up-regulated genes respectively (fold-change [FC] >2 and P < .05). (B) Overview of GSEA. FDR, false discovery rate; NES, normalized enrichment score. (C-G) GSEA identified numerous gene signatures enriched in K−/−; Q/+ cells. (C-G) Representative examples include NRAS targets and ERK1/2 cascade (C), stem cell and myeloid cell development (D), IL6/JAK/STAT3 (E), TP53 targets (F), and human ETP-ALL gene signatures (G).](https://ash.silverchair-cdn.com/ash/content_public/journal/blood/137/23/10.1182_blood.2020009082/5/m_bloodbld2020009082f3.png?Expires=1769239380&Signature=e-gRBTC9EHoBzz0Q4CHqpduwnHysR~ph93J57-HC~lSKPZG2IBq7uPltUPQmr8XEDXvl~vKC8RAL9ReANCFpHJB9t4Z-9mH0DgGldHzj7~K1mPjMo8i4vC6kPE6hduWzkUMJgPtqgN8i-oBVzlzPm5PD-H4FoKJmZaKKII7zw7J89BQQC9EKHPs6hfPgux5qId13dQSzjvJuMoGld7wBaRFupuGMNIm7tZotG5xI91UGxT8lmfw9BFJqVozabq2fmcoLXnVV0MU7khwlENMkYO0elDYqxnwdqochmKOMiaxf71PFPBLdvwi00GM6wZJPjKqMrfmNPpR572X1QsAlPQ__&Key-Pair-Id=APKAIE5G5CRDK6RD3PGA)
RNA-seq analysis identifies ETP-related gene signatures enriched in Kras−/−; NrasQ61R/+ thymocytes. RNA-seq analysis of thymocytes from moribund Kras−/−; NrasQ61R/+ (K−/−; Q/+) mice (n = 3) and age-matched controls (con) (n = 3). (A) Volcano plot of gene expression in K−/−; Q/+ cells vs control T cells. Dots located in the upper-left and upper-right sections represent 969 down- and 506 up-regulated genes respectively (fold-change [FC] >2 and P < .05). (B) Overview of GSEA. FDR, false discovery rate; NES, normalized enrichment score. (C-G) GSEA identified numerous gene signatures enriched in K−/−; Q/+ cells. (C-G) Representative examples include NRAS targets and ERK1/2 cascade (C), stem cell and myeloid cell development (D), IL6/JAK/STAT3 (E), TP53 targets (F), and human ETP-ALL gene signatures (G).
RNA-seq analysis identifies ETP-related gene signatures enriched in Kras−/−; NrasQ61R/+ thymocytes. RNA-seq analysis of thymocytes from moribund Kras−/−; NrasQ61R/+ (K−/−; Q/+) mice (n = 3) and age-matched controls (con) (n = 3). (A) Volcano plot of gene expression in K−/−; Q/+ cells vs control T cells. Dots located in the upper-left and upper-right sections represent 969 down- and 506 up-regulated genes respectively (fold-change [FC] >2 and P < .05). (B) Overview of GSEA. FDR, false discovery rate; NES, normalized enrichment score. (C-G) GSEA identified numerous gene signatures enriched in K−/−; Q/+ cells. (C-G) Representative examples include NRAS targets and ERK1/2 cascade (C), stem cell and myeloid cell development (D), IL6/JAK/STAT3 (E), TP53 targets (F), and human ETP-ALL gene signatures (G).
Quantitative proteomics analysis identifies Rasgrp1 downregulation in Kras−/−; NrasQ61R/+ thymocytes
Because Kras is a major regulator of cytokine-stimulated ERK activation in mature myeloid cells and B cells,31,43 we hypothesized that loss of WT Kras leads to ETP expansion via modulating the cell signaling network and thus promoting the initiation of ETP-like leukemia. We investigated the potential molecular events that enable this initiation. On day 37, we collected thymocytes from representative control, NrasQ61R/+ and Kras−/−; NrasQ61R/+ mice and took a quantitative proteomics approach to identify potential driver events (Figure 4A). Of note, the percentages of DN cells were comparable in NrasQ61R/+ and Kras−/−; NrasQ61R/+ thymi but much higher than that in control thymi (supplemental Figure 7A).
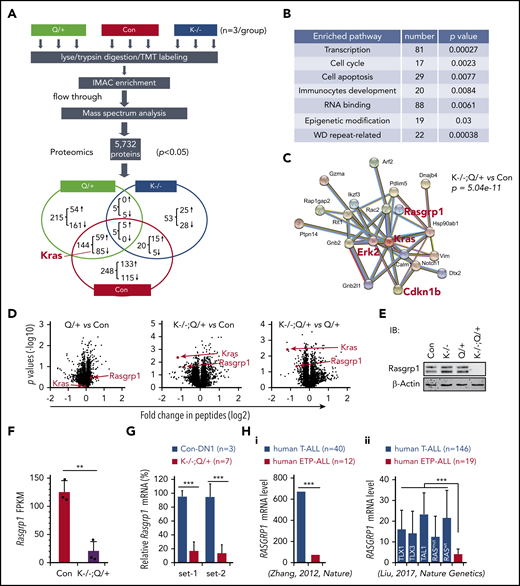
Proteomics analysis identifies downregulation of Rasgrp1 in Kras−/−; NrasQ61R/+ thymocytes. Six- to 7-week-old Mx1-cre (Con), NrasQ61R/+ (Q/+), and Kras−/−; NrasQ61R/+ (K−/−; Q/+) mice were treated with pI-pC as described in "Materials and methods." Thymocytes were collected ∼4 weeks after the last pI-pC injection for analysis. (A) Flowchart of quantitative proteomics studies of thymocytes (n = 3/group). P values were calculated using a 2-tailed Student t test. Peptides with P < .05 were selected for bioinformatics analysis. (B) Peptides with P < .05 in K−/−; Q/+ vs con comparison were selected for bioinformatics analysis using the Database for Annotation, Visualization, and Integrated Discovery (DAVID) Bioinformatics Resources 6.7 software. Representative enriched pathways are shown. (C) Peptides with P < .05 and >50% changes in K−/−; Q/+ vs con comparison were selected for protein–protein interaction analysis using STRING v9.1 software. An identified Kras-centered regulatory node is shown. (D) Volcano plot analysis of total peptides in the quantitative proteomics study. The x-axis represents fold-change of total peptides (log2) in Q/+ vs control, K−/−; Q/+ vs control, and K−/−; Q/+ vs Q/+, and the y-axis represents P values (log10). (E) Western blot analysis to validate the downregulation of Rasgrp1 in K−/−; Q/+ thymic cells. (F-G) Quantification of Rasgrp1 mRNA levels using RNA-Seq in control vs K−/−; Q/+ thymocytes (F) and quantitative reverse transcription polymerase chain reaction in control thymic DN1 cells vs K−/−; Q/+ thymocytes (G). FPKM, fragments per kilobase of transcript per million mapped reads. P values were calculated with a 2-tailed Student t test. (Hi) RAGRP1 mRNA levels in human ETP-ALL patients vs general T-ALL patients. P value was cited from Zhang et al.2 (Hii) RAGRP1 mRNA levels in human ETP-ALL patients vs T-ALL patients stratified based on subtypes or RAS mutation status.34 P values were calculated with a 2-tailed Student t test. **P < .01; ***P < .001.
Proteomics analysis identifies downregulation of Rasgrp1 in Kras−/−; NrasQ61R/+ thymocytes. Six- to 7-week-old Mx1-cre (Con), NrasQ61R/+ (Q/+), and Kras−/−; NrasQ61R/+ (K−/−; Q/+) mice were treated with pI-pC as described in "Materials and methods." Thymocytes were collected ∼4 weeks after the last pI-pC injection for analysis. (A) Flowchart of quantitative proteomics studies of thymocytes (n = 3/group). P values were calculated using a 2-tailed Student t test. Peptides with P < .05 were selected for bioinformatics analysis. (B) Peptides with P < .05 in K−/−; Q/+ vs con comparison were selected for bioinformatics analysis using the Database for Annotation, Visualization, and Integrated Discovery (DAVID) Bioinformatics Resources 6.7 software. Representative enriched pathways are shown. (C) Peptides with P < .05 and >50% changes in K−/−; Q/+ vs con comparison were selected for protein–protein interaction analysis using STRING v9.1 software. An identified Kras-centered regulatory node is shown. (D) Volcano plot analysis of total peptides in the quantitative proteomics study. The x-axis represents fold-change of total peptides (log2) in Q/+ vs control, K−/−; Q/+ vs control, and K−/−; Q/+ vs Q/+, and the y-axis represents P values (log10). (E) Western blot analysis to validate the downregulation of Rasgrp1 in K−/−; Q/+ thymic cells. (F-G) Quantification of Rasgrp1 mRNA levels using RNA-Seq in control vs K−/−; Q/+ thymocytes (F) and quantitative reverse transcription polymerase chain reaction in control thymic DN1 cells vs K−/−; Q/+ thymocytes (G). FPKM, fragments per kilobase of transcript per million mapped reads. P values were calculated with a 2-tailed Student t test. (Hi) RAGRP1 mRNA levels in human ETP-ALL patients vs general T-ALL patients. P value was cited from Zhang et al.2 (Hii) RAGRP1 mRNA levels in human ETP-ALL patients vs T-ALL patients stratified based on subtypes or RAS mutation status.34 P values were calculated with a 2-tailed Student t test. **P < .01; ***P < .001.
We identified 417 proteins that were differentially expressed (DE) in Kras−/−; NrasQ61R/+ vs control thymocytes (P < .05): 205 downregulated and 212 upregulated (Figure 4A). Of note, Kras was identified as the top downregulated protein in quantitative analysis of Kras−/−; NrasQ61R/+ vs control but not in the comparative analysis of NrasQ61R/+ vs control (Figure 4A,D). Consistent with our phenotypic characterizations, pathway analysis showed that the DE proteins were significantly enriched in transcription, cell-cycle regulation, RNA processing, and immunocyte development clusters (Figure 4B). To identify potential driver events that promote T-cell malignancies in Kras−/−; NrasQ61R/+ mice, we imported our DE protein list from Kras−/−; NrasQ61R/+ vs control analysis (P < .05 and >50% change) into the STRING database.44 A Kras-centered regulatory node was identified, including ERK2 and Cdkn1b (Figure 4C). Given the predominant role of MEK/ERK pathway in oncogenic Ras-driven leukemias, we were reassured by the significant upregulation of ERK2 protein in this Kras-centered node. A similar Kras-centered regulatory node was also identified in Kras−/−; NrasQ61R/+ vs NrasQ61R/+ analysis (supplemental Figure 7B). By contrast, 83 DE proteins from NrasQ61R/+ vs control analysis (P < .05 and >50% change) in the STRING database yielded 2 nodes that regulate RNA processing (supplemental Figure 7B, left) and ribosome biogenesis, respectively (supplemental Figure 7C, right).
In addition, Rasgrp1, a Ras guanine nucleotide exchange factor that plays an important role in regulating normal T cell development24 and has links to cancer as well,6 was also identified in the Kras regulatory node (Figure 4C; supplemental Figure 7B). Unexpectedly, despite the comparable percentages of DN cells in Kras−/−; NrasQ61R/+ and NrasQ61R/+ thymocytes (supplemental Figure 7A), the level of Rasgrp1 protein was markedly downregulated in Kras−/−; NrasQ61R/+ thymocytes compared with control or NrasQ61R/+ thymocytes but was indistinguishable between control and NrasQ61R/+ thymocytes (Figure 4D). Western blot analysis of thymocytes collected from day 37 mice further validated this proteomic finding (Figure 4E). Treatment with MG132, a proteasome inhibitor, blocked the degradation of ubiquitinated proteins in primary Kras−/−; NrasQ61R/+ thymocytes, but failed to upregulate Rasgrp1 protein levels (supplemental Figure 8A). Rather, the decreased Rasgrp1 protein levels appeared to be mediated by transcriptional repression upon Kras knockout and activation of oncogenic Nras, as shown in RNA-seq (Figure 4F). Consistent with our proteomics data, Rasgrp1 messenger RNA (mRNA) level in Kras−/−; NrasQ61R/+ thymocytes was much lower than that in control thymic DN1 (Thy1.2+ CD4− CD8− CD44+ CD25−) cells (Figure 4G), indicating that Rasgrp1 was indeed downregulated in ETP-like leukemia cells. Because Rasgrp1 levels in Kras−/− (supplemental Figure 8B) and NrasQ61R/+ (Figure 4D) T cells were comparable to that in control T cells, downregulation of Rasgrp1 in Kras−/−; NrasQ61R/+ thymocytes is likely to be induced by genetic synergism between Kras deficiency and oncogenic Nras. Corroborating our result, we found that RASGRP1 mRNA level was much lower in human ETP-ALL cells vs T-ALL regardless of T-ALL subtypes (TAL1 and TLX1/3) or RAS mutation status (Figure 4H),2,34 suggesting that Rasgrp1 downregulation might play an important role in ETP-ALL development.
A positive feedback loop couples MEK/ERK hyperactivation and Rasgrp1 downregulation
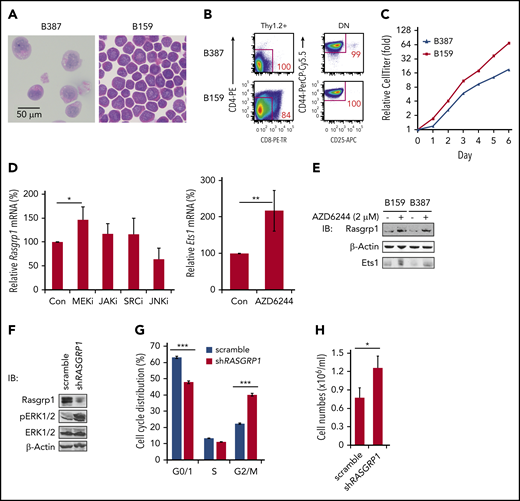
To determine how Rasgrp1 is transcriptionally repressed, we established 2 T-leukemia cell lines, B387 and B159, from leukemic thymocytes of 2 independent Kras−/−; NrasQ61R/+ mice. These 2 cell lines are morphologically atypical for T-ALL because they exhibit prominent eosinophilic granulation in the cytoplasm (Figure 5A). Both of them predominantly displayed DN1 immunophenotype (Figure 5B) and doubled once per day (Figure 5C). We treated these cell lines with various inhibitors to block different signaling pathways. Only AZD6244, a potent MEK inhibitor,45 upregulated both Rasgrp1 mRNA (Figure 5D) and protein levels (Figure 5E). Ets1, a key lymphocyte transcription factor, has been shown to bind to the Rasgrp1 promoter.46 Therefore, we investigated whether Rasgrp1 downregulation is possibly mediated by Ets1. GSEA of our RNA-seq results identified that the genes upregulated upon Ets1 knockout were enriched in Kras−/−; NrasQ61R/+ thymocytes (supplemental Figure 9A), suggesting downregulation of Ets1 activity in these cells. Ets1 mRNA levels were much lower in both mouse and human ETP-ALL cells (supplemental Figure 9B-C), even compared with control thymic DN1 cells (supplemental Figure 9D). As in the case of Rasgrp1, Ets1 level in Kras−/− T cells were comparable to that in control T cells (supplemental Figure 9E). Ets1 protein level in NrasQ61R/+ thymocytes was comparable to that in control cells but significantly higher than that in Kras−/−; NrasQ61R/+ thymocytes (supplemental Figure 9F). Because of larger variations among control samples, the Ets1 protein level in Kras−/−; NrasQ61R/+ thymocytes was lower than that in control thymocytes but did not reach a statistical significance (P = .07). More importantly, in B387 and B159 cells treated with AZD6244, Rasgrp1 upregulation was associated with Ets1 upregulation (Figure 5D-E). Our data suggest that Ets1 downregulation may contribute to Rasgrp1 downregulation.

A feedback loop couples MEK/ERK hyperactivation and Rasgrp1 downregulation. (A-B) Representative hemoxylin and eosin-stained images (A) and flow cytometric plots of 2 cell lines (B387 and B159) (B) derived from Kras−/−; NrasQ61R/+ thymocytes. (C) Cell growth was measured using Cell TiterGlo assay. (D) B387 and B159 were treated with DMSO, 2 µM MEK inhibitor (AZD6244), 2 µM JAK inhibitor (CYT387), 100 nM SRC inhibitor (dasatinib), or 10 µM JNK inhibitor (SP600125) for 18 hours. Rasgrp1 and Ets1 mRNA levels were quantified using quantitative reverse transcription polymerase chain reaction. (E) Western blot analysis of Rasgrp1 and Ets1 protein levels in the absence or presence of AZD6244. (F-H) Jurkat cells, a human T-ALL cell line, stably expressed a scrambled shRNA or a RASGRP1 shRNA. (F) Western blot analysis of Rasgrp1, ERK1/2 and pERK1/2 protein levels. (G) Cell-cycle analysis. (H) Jurkat T cells were seeded at the same density and cell numbers were counted 48 hours later. P values were calculated with a 2-tailed Student t test. *P < .05; ***P < .001.
A feedback loop couples MEK/ERK hyperactivation and Rasgrp1 downregulation. (A-B) Representative hemoxylin and eosin-stained images (A) and flow cytometric plots of 2 cell lines (B387 and B159) (B) derived from Kras−/−; NrasQ61R/+ thymocytes. (C) Cell growth was measured using Cell TiterGlo assay. (D) B387 and B159 were treated with DMSO, 2 µM MEK inhibitor (AZD6244), 2 µM JAK inhibitor (CYT387), 100 nM SRC inhibitor (dasatinib), or 10 µM JNK inhibitor (SP600125) for 18 hours. Rasgrp1 and Ets1 mRNA levels were quantified using quantitative reverse transcription polymerase chain reaction. (E) Western blot analysis of Rasgrp1 and Ets1 protein levels in the absence or presence of AZD6244. (F-H) Jurkat cells, a human T-ALL cell line, stably expressed a scrambled shRNA or a RASGRP1 shRNA. (F) Western blot analysis of Rasgrp1, ERK1/2 and pERK1/2 protein levels. (G) Cell-cycle analysis. (H) Jurkat T cells were seeded at the same density and cell numbers were counted 48 hours later. P values were calculated with a 2-tailed Student t test. *P < .05; ***P < .001.
To investigate how Rasgrp1 downregulation affects ERK activation and cell growth, we knocked down RASGRP1 expression in human Jurkat T cells, which were cultured in the presence of serum but absence of cytokines (Figure 5F). Compared with scrambled short hairpin RNA (shRNA), shRASGRP1 led to increased pERK levels (Figure 5F) and thus increased cell proliferation (Figure 5G) and growth (Figure 5H). Our data suggest that MEK/ERK signaling and Rasgrp1 downregulation forms a positive feedback loop: hyperactivated MEK/ERK signaling mediates Rasgrp1 transcriptional repression, whereas Rasgrp1 downregulation further promotes MEK/ERK hyperactivation.
Rasgrp1 haploinsufficiency promotes ERK hyperactivation and ETP expansion in NrasQ61R/+ mice
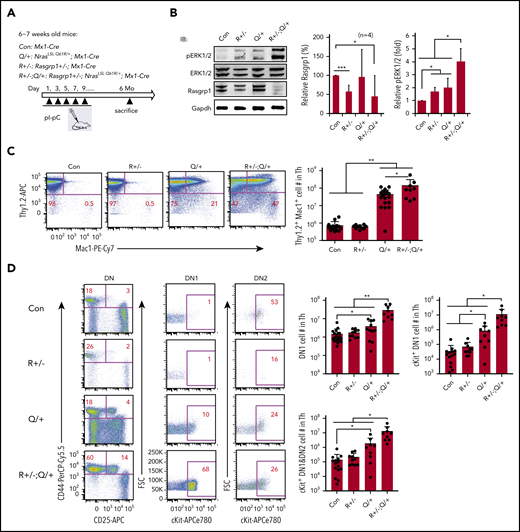
We further validated the role of Rasgrp1 downregulation in vivo. We generated Rasgrp1+/−; Mx1-Cre and Rasgrp1+/−; NrasLSL Q61R/+; Mx1-Cre mice and referred to them as Rasgrp1+/− and Rasgrp1+/−; NrasQ61R/+ mice upon pI-pC treatment (Figure 6A). These mice were euthanized ∼6 months after the last pI-pC injection. Consistent with our previous work,47 Rasgrp1 protein level was lower in Rasgrp1+/− and Rasgrp1+/−; NrasQ61R/+ cells compared with that in control cells (Figure 6B). ERK signaling was significantly elevated in Rasgrp1+/− and NrasQ61R/+ thymocytes and further increased in Rasgrp1+/−; NrasQ61R/+ cells (Figure 6B). Detailed immunophenotypic analyses showed that in Rasgrp1+/−; NrasQ61R/+ mice, the number of Thy1.2+ Mac1+ lymphoblasts significantly increased compared with those in control (∼196-fold) and NrasQ61R/+ mice (>threefold) (Figure 6C). Moreover, we examined ETP compartment and observed a marked expansion in Rasgrp1+/−; NrasQ61R/+ mice compared with control (19.5-fold as in DN1, 334-fold in cKit+ DN1, and 95-fold in cKit+ DN1+DN2 cells), and NrasQ61R/+ mice (∼4.3-fold increase in DN1, 11.5-fold in cKit+ DN1, and 6.7-fold in cKit+ DN1+DN2 cells) (Figure 6D). At this time point, only 3/9 Rasgrp1+/−; NrasQ61R/+ mice became moribund and 2/3 developed ETP-like leukemia. Together, our data demonstrate that Rasgrp1+/− promotes ERK hyperactivation and ETP expansion in NrasQ61R/+ mice in vivo.

Rasgrp1+/− promotes ERK hyperactivation and expansion of early T-cell precursors in NrasQ61R/+ mice. (A) Experimental scheme. R+/− and R+/−; Q/+ mice were euthanized at about 6 months after pI-pC treatment along with age-matched control mice. (B) Quantification of Rasgrp1 and pERK levels in thymocytes. Rasgrp1 levels were quantified against the levels of Gapdh using ImageStudioLite software. pERK levels were quantified against total ERK levels. The values in control cells are arbitrarily set at 1. (C) Quantification of the number of Thy1.2+ Mac1+ thymocytes. (D) Quantification of the number of early T-cell precursors. DN, CD4− CD8− T cells; DN1, CD44+ CD25− DN cells; DN2, CD44+ CD25+ DN cells. Data were plotted as mean + SD. P values were calculated with a 2-tailed Student t test. *P < .05; **P < .01.
Rasgrp1+/− promotes ERK hyperactivation and expansion of early T-cell precursors in NrasQ61R/+ mice. (A) Experimental scheme. R+/− and R+/−; Q/+ mice were euthanized at about 6 months after pI-pC treatment along with age-matched control mice. (B) Quantification of Rasgrp1 and pERK levels in thymocytes. Rasgrp1 levels were quantified against the levels of Gapdh using ImageStudioLite software. pERK levels were quantified against total ERK levels. The values in control cells are arbitrarily set at 1. (C) Quantification of the number of Thy1.2+ Mac1+ thymocytes. (D) Quantification of the number of early T-cell precursors. DN, CD4− CD8− T cells; DN1, CD44+ CD25− DN cells; DN2, CD44+ CD25+ DN cells. Data were plotted as mean + SD. P values were calculated with a 2-tailed Student t test. *P < .05; **P < .01.
Discussion
In this study, we established and characterized a novel Ras-driven ETP-like ALL model. We show that Kras−/− cooperates with NrasQ61R/+ signaling to downregulate Rasgrp1 expression, which in turn promotes further hyperactivation of the Nras/ERK signaling, T-cell hyperproliferation, expansion of ETP compartment, and development of a highly malignant T-cell leukemia. Our detailed characterizations of this malignancy (Figures 1 and 3) demonstrate that it represents most of biological and molecular features of human ETP-ALL.
Although WT Nras and Kras share highly conserved protein sequences, they play distinct roles in thymocyte development. In Nras−/− mice, the number of CD8+ single-positive T cells is significantly reduced, and antiviral immune response and T-cell functions are impaired.48 By contrast, in Kras−/− mice, thymic T-cell development is normal.43 However, Kras−/− CD4+ T cells show altered TCR-induced gene expression, including reduced expression of various inflammatory cytokines and chemokines. These molecular changes associate with their deficient graft-versus-host response but normal anti-cancer killing activity.49
WT Kras has been documented to exert tumor suppressor functions in some solid cancers.50-53 Although it was postulated that WT Kras may suppress tumorigenesis via distinct mechanisms in the presence of different oncogenic Ras isoforms,13 this hypothesis has not been systematically tested in vivo. In our prior study, we found that the hyperactivation of WT Nras and Hras by oncogenic Kras was further enhanced by WT Kras deletion.54,55 Hence, total Ras activity was higher in KrasG12D/− cells than in KrasG12D/+ cells. Consequently, hyperactivated Ras signaling in KrasG12D/− mice induces early-onset MPN with rapid progression. Contrasting observations in KrasG12D/− driven MPN, endogenous levels of oncogenic Nras (eg, NrasQ61R) are insufficient to promote WT Kras and Hras hyperactivation in myeloid cells.15,30 In thymocytes, enhanced Nras activation (see the following section) in Kras−/−; NrasQ61R/+ cells appeared to compensate for loss of Kras and thus total Ras activity is comparable between NrasQ61R/+ and Kras−/−; NrasQ61R/+ cells (Figure 2A). However, there seems to have some qualitative, yet unknown, differences between the signaling networks in NrasQ61R/+ and Kras−/−; NrasQ61R/+ thymocytes. The distinct signaling in Kras−/−; NrasQ61R/+ thymocytes promotes low Rasgrp1 expression (Figure 4) and the early onset of ETP-like leukemia in these mice (Figure 1).
STRING analysis of DE proteins between Kras−/−; NrasQ61R/+ and control thymocytes identified a Kras-centered regulatory node, including Rasgrp1 (Figure 4C). Rasgrp1 downregulation mainly occurred at the gene transcription step, downstream of MEK/ERK signaling (Figure 5D-E) and possibly mediated by Ets1 (Figure 5E; supplemental Figure 9). In thymic T cells, both Rasgrp1 and Ets1 are expressed at a low level in early CD4− CD8− DN cells (supplemental Figure 10). Their expression levels are upregulated followed T-cell differentiation from DN to CD4+ CD8+ DP T cells and peak in single-positive cells.56,57 In Ets1−/− or Rasgrp1−/− mice, T-cell development is blocked at the transition steps from DN to DP cells and early DN cells are accumulated.24,57,58 Therefore, it is possible that lower levels of Ets1 and Rasgrp1 in Kras−/−; NrasQ61R/+ thymocytes might be due to the expansion of DN cells. Alternatively, Ets1 and Rasgrp1 levels are truly downregulated in leukemia cells. Our data are in favor of the latter scenario. First, we showed that despite the comparable percentages of DN cells (supplemental Figure 7A), Ets1 and Rasgrp1 protein levels in Kras−/−; NrasQ61R/+ thymocytes were much lower than those in NrasQ61R/+ thymocytes (Figure 4D; supplemental Figure 9F). Notably, although DN compartment was expanded in NrasQ61R/+ thymocytes (supplemental Figure 7A), these cells expressed comparable levels of Ets1 and Rasgrp1 as control thymocytes (Figure 4D; supplemental Figure 9F). Second, we compared Ets1 and Rasgrp1 mRNA levels in mouse thymic DN1 cells vs Kras−/−; NrasQ61R/+ thymocytes and found that they were much lower in ETP-like ALL cells (Figure 4G; supplemental Figure 9D). Therefore, we believe that Ets1 and Rasgrp1 levels were indeed downregulated in leukemia cells, and lower levels of Rasgrp1 promoted the initiation of ETP-like ALL. Corroborating this idea, our in vivo study demonstrates that Rasgrp1+/− downregulated Rasgrap1 expression in NrasQ61R/+ thymocytes and promoted ETP expansion (Figure 6). Expanded ETP cells may provide an opportunity for further leukemic transformation. Not surprisingly, low expression level of Ets1 and Rasgrp1 is part of the gene signature of ETP-ALL cells (Figure 4F-H; supplemental Figure 9B-C). Because Ets1 and Rasgrp1 levels in Kras−/− and NrasQ61R/+ T cells were comparable to those in control T cells (Figure 4D; supplemental Figure 8B,E-F) and their levels were only lower in Kras−/−; NrasQ61R/+ thymocytes, we believe that their downregulation is caused by genetic interaction between Kras−/− and NrasQ61R/+.
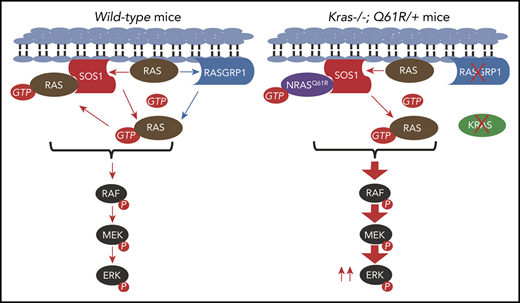
Previous studies identified the oncogenic function of Rasgrp1 overexpression in promoting general T-ALL21-23 and mediating Nf1-deficient AML cell resistance to MEK inhibitors.59 By contrast, we and others observed tumor suppressor function of Rasgrp1 in other contexts. We found that Rasgrp1 expression is significantly downregulated in mouse and human ETP-ALL cells (Figure 4F-H), and that Nras-GTP and pERK levels were higher in Kras−/−; NrasQ61R/+ thymocytes than in NrasQ61R/+ thymocytes (Figure 2A-B). Consistent with these results, knocking down RASGRP1 in human Jurkat cells led to similar phenotypes, including increased pERK level and increased cell proliferation (Figure 5F-G). We postulate that in normal T cells that only have WT Ras alleles, both Sos1 and Rasgrp1 catalyze GTP loading to empty Ras, providing Ras-GTP to Sos1 allosteric site to boost Ras/MEK/ERK signaling (supplemental Figure 11A). In Kras−/−; NrasQ61R/+ thymocytes, the presence of GTP-bound oncogenic Nras could sufficiently feed Sos1 allosteric site for WT Ras activation. Indeed, RasV12C40 that is predominantly GTP-loaded but has the C40 mutation preventing it from signaling to RAF can substitute for Rasgrp1 function in cell lines via Sos1 allosteric site.18 Therefore, the GEF function of Rasgrp1 in Kras−/−; NrasQ61R/+ thymocytes may be negligible. Despite a low level of Rasgrp1, an NrasQ61R-Sos1 complex with allosterically activated Sos1 would be proficient to load Ras molecules with GTP (supplemental Figure 11B). In agreement with this model, a recent study reported that Rasgrp1−/− exacerbates the proliferative EGFR-Sos1-Ras signals via Sos1 in intestinal epithelial cells.14 Taken together, we believe that the role of Rasgrp1 in tumorigenesis is context dependent; its overexpression drives general T-ALL, while cooperating with other genetic events, its downregulation promotes ETP-ALL.
The RNA-Seq and proteomics data reported in this paper were deposited to a publicly accessible database as described in “Materials and methods.” For the other data, please contact Jing Zhang.
The online version of this article contains a data supplement.
The publication costs of this article were defrayed in part by page charge payment. Therefore, and solely to indicate this fact, this article is hereby marked “advertisement” in accordance with 18 USC section 1734.
Acknowledgments
The authors thank the University of Wisconsin Carbone Comprehensive Cancer Center (UWCCC) for use of its shared services (Flow Cytometry Laboratory, Transgenic Animal Facility, and Experimental Pathology Laboratory) to complete this research.
This work was supported by Alex’s Lemonade Stand Foundation Innovator Award and the National Institutes of Health (NIH), National Institute of General Medical Sciences grant P41 GM108538 (A.H. and J.J.C.), National Cancer Institute grant R01 CA187318 (J.P.R.), National Heart, Lung, and Blood Institute grants R01 HL120724 (J.P.R.) and R01 HL148120 (R.W.), National Institute of Allergy and Infectious Diseases grant R01AI079087 (D.W.), National Heart, Lung, and Blood Institute grant R01HL130724 (D.W.), and National Cancer Institute grant R01 CA152108 (J.Z.). This work was also supported in part by NIH/National Cancer Institute P30 CA014520–UW Comprehensive Cancer Center Support.
Authorship
Contribution: Z.W., D.W., and J.Z. conceived and designed the study; Z.W., G.Y., and S.L. acquired cell line and mouse data; Z.W., E.A.R., J.P.R., R.W., D.W., and J.Z. analyzed and interpretated cell line and mouse data; A.H., A.R., and J.J.C. acquired and analyzed proteomic data; Z.W., A.H., E.A.R., J.P.R., J.J.C., R.W., D.W., and J.Z. wrote, reviewed, and/or revised the manuscript; G.Y., G.K., R.F., Y.Z., M.Y., A.D., and J.P.R. provided technical or material support; and J.Z. supervised the study.
Conflict-of-interest disclosure: J.J.C. is a consultant for Thermo Fisher Scientific. The remaining authors declare no competing financial interests.
Correspondence: Demin Wang, Blood Research Institute, Versiti, 8727 Watertown Plank Rd, Milwaukee, WI 53226; e-mail: dwang@versiti.org; and Jing Zhang, Wisconsin Institute for Medical Research II, McArdle Laboratory for Cancer Research, University of Wisconsin–Madison, 1111 Highland Ave, Madison, WI 53705; e-mail: zhang@oncology.wisc.edu.

![RNA-seq analysis identifies ETP-related gene signatures enriched in Kras−/−; NrasQ61R/+ thymocytes. RNA-seq analysis of thymocytes from moribund Kras−/−; NrasQ61R/+ (K−/−; Q/+) mice (n = 3) and age-matched controls (con) (n = 3). (A) Volcano plot of gene expression in K−/−; Q/+ cells vs control T cells. Dots located in the upper-left and upper-right sections represent 969 down- and 506 up-regulated genes respectively (fold-change [FC] >2 and P < .05). (B) Overview of GSEA. FDR, false discovery rate; NES, normalized enrichment score. (C-G) GSEA identified numerous gene signatures enriched in K−/−; Q/+ cells. (C-G) Representative examples include NRAS targets and ERK1/2 cascade (C), stem cell and myeloid cell development (D), IL6/JAK/STAT3 (E), TP53 targets (F), and human ETP-ALL gene signatures (G).](https://ash.silverchair-cdn.com/ash/content_public/journal/blood/137/23/10.1182_blood.2020009082/5/m_bloodbld2020009082f3.png?Expires=1769705827&Signature=AQUPz-~up8rcqEbDrHODhvH0k5V6MPYwG-0AKhCzz12j7Ju7feSWILMc~vxYfzVUnAiDGJfA1jMJqN0wMnb0GTGNEqKAOkX8GvDz-0TXXVcQijX3YAW08OOh6EPQAB2yZk~0TSpdoOOr47B3gbw4lDAkTkNG3O0V8ynSR4qcvj04NrmSo9k5NZ9fx7wyCk6iGyzIzx91npNeRI5wmcR5Tl~KXto3bRWEYUvVnDkd1km4AYbeA8QuVGITzzjxRL~W~Ppf992DmYxEXBLJBQcPaBYQt-uurycqJVo7s~T5js8xDVAyEvii8d9dbZ1GJYG6lfTTMOxcrgtR8xPw0Q9gEA__&Key-Pair-Id=APKAIE5G5CRDK6RD3PGA)