Key Points
An interactive data set of single-cell RNA and CITE sequencing of human HSPCs derived from pluripotent stem cells has been generated.
An artificial neural network identifies HSC-like cells derived in vitro from hPSCs.

Abstract
Hematopoietic stem and progenitor cells (HSPCs) develop in distinct waves at various anatomical sites during embryonic development. The in vitro differentiation of human pluripotent stem cells (hPSCs) recapitulates some of these processes; however, it has proven difficult to generate functional hematopoietic stem cells (HSCs). To define the dynamics and heterogeneity of HSPCs that can be generated in vitro from hPSCs, we explored single-cell RNA sequencing (scRNAseq) in combination with single-cell protein expression analysis. Bioinformatics analyses and functional validation defined the transcriptomes of naïve progenitors and erythroid-, megakaryocyte-, and leukocyte-committed progenitors, and we identified CD44, CD326, ICAM2/CD9, and CD18, respectively, as markers of these progenitors. Using an artificial neural network that we trained on scRNAseq derived from human fetal liver, we identified a wide range of hPSC-derived HSPCs phenotypes, including a small group classified as HSCs. This transient HSC-like population decreased as differentiation proceeded, and was completely missing in the data set that had been generated using cells selected on the basis of CD43 expression. By comparing the single-cell transcriptome of in vitro–generated HSC-like cells with those generated within the fetal liver, we identified transcription factors and molecular pathways that can be explored in the future to improve the in vitro production of HSCs.
Introduction
Human pluripotent stem cells (hPSCs) can be differentiated in vitro into various hematopoietic cell types, providing both a model for basic research studies and a source of clinically relevant cells.1 During embryonic development, 2 waves of restricted hematopoietic progenitors arise in the extraembryonic tissues of the yolk sac, before emergence of hematopoietic stem cells (HSCs) in the embryo proper.2 In the mouse embryo, at embryonic day (E) 7.25, the first “primitive” wave gives rise to erythrocytes, megakaryocytes, and macrophages,3,4 after E8.25, the second wave, also known as the first “definitive” progenitors, consists of erythromyeloid progenitors that can be distinguished from the primitive progenitors by their potential to generate granulocytes.5 Furthermore, the monocytes that emerge from erythromyeloid progenitors provide the embryo with tissue-resident macrophages; the first life-long–lasting population of immune cells.6-8 Intraembryonic hematopoiesis is established from E10.5 to E11.5 in the aorta-gonad-mesonephros (AGM) region, with the emergence of HSCs that will sustain the life span production of all blood lineages, also upon transplantation.9 Some studies have indicated that human hematopoietic development follows a comparable process,10-13 but for ethical reasons, it has proven difficult to gain a clear insight into the lineage potential and hierarchical relationships between early human hematopoietic progenitors. The dynamic nature and the heterogeneity of hematopoietic progenitor populations that arise during development poses additional confounders to the identification of molecular mechanisms associated with their formation and function.
To gain insight into the transcriptome of developing human hematopoietic progenitors, we performed in-depth characterization of hematopoietic progenitors derived from hPSCs. Single-cell expression profiles of hPSC-derived hematopoietic cells have been reported, but those studies used either a limited number of cells or biased approaches in their isolation and so failed to depict their trajectory of differentiation.14-16 This significantly affected the ability to resolve the complex heterogeneity of the progenitor pool, to identify the hierarchal relationship between subpopulations, and to compare the transcriptome of hPSC-derived progenitors to that of their in vivo counterparts.
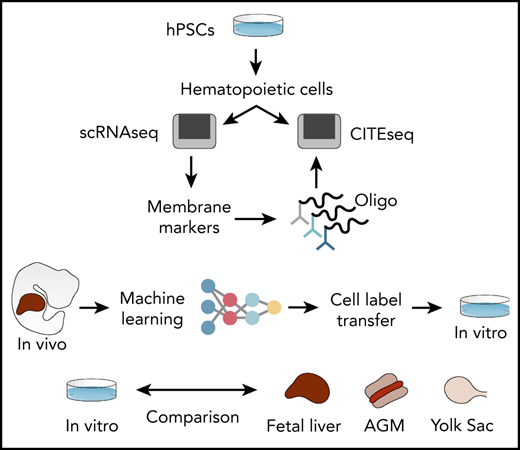
To address these limitations, we generated interactive single-cell RNA sequencing (scRNAseq) data sets of human hPSC-derived hematopoietic progenitors (lab.antonellafidanza.com). Lineage trajectories predicted in silico were validated by functional assays of sorted cells, and the specificity of our marker repertoire was confirmed by using the cellular indexing of transcriptomes and epitopes by sequencing (CITE-seq)17 strategy. To annotate the hPSC-derived progeny in an unbiased manner, we employed machine learning and trained an artificial neural network (ANN) to recognize the single-cell gene expression profiles of human fetal liver cells. This trained ANN was subsequently used to predict the identities of hPSC-derived cells. The ANN thereby provided mapping between in vivo and in vitro hematopoiesis and revealed a subset of hPSC-derived cells that most closely resemble HSCs in the fetal liver. Finally, by comparing that transcriptome of in vitro– and in vivo–generated HSCs we identified genetic pathways that can be explored to improve HSCs production in vitro from hPSCs.
Methods
The procedures used are described in the supplemental Methods, available on the Blood Web site.
Results
Single-cell RNA sequencing of induced iPSC-derived hematopoietic progenitor cells reveals the transcriptome of naïve and lineage-committed progenitors
To resolve the heterogeneity of in vitro–generated hPSC-derived hematopoietic progenitors we designed a minimal membrane marker strategy that allows for broad isolation of hPSC-derived hematopoietic progenitors. This marker strategy was validated using colony-forming unit cell (CFU-C) assays of sorted cell populations and gene expression profiling of different hPSC lines, including SFCi55, an hiPSC line that we had derived,18 and 2 reporter cell lines, SFCi55-KLF1-mCherry (a targeted clone of the SFCi55 induced-PSC [iPSC] line) and the human embryonic stem cell (hESC) line, HES3-RUNX1C-GFP19 (supplemental Figure 1). These data, together with previous reports,19-23 support our rationale that the isolation of CD235a−CD43+ cells would enrich for HSPCs and exclude cells derived from the primitive wave (supplemental Figure 1). We anticipated that the CD235a−CD43+ compartment would also comprise the early stages of lineage commitment, capturing the downstream hierarchy of early human progenitors.
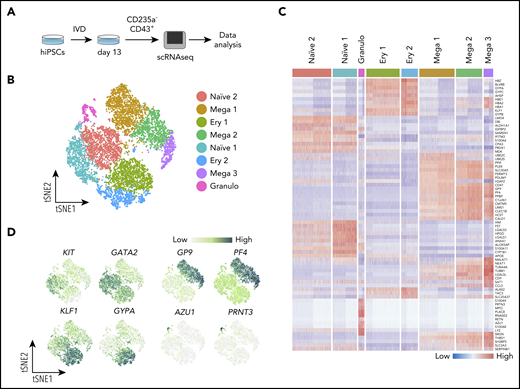
CD235a−CD43+ suspension cells from 2 independent replicate cultures of SFCi55 hiPSCs18 at day 13 of differentiation were sorted by fluorescence-activated cell sorting (FACS) and subjected to scRNAseq and data analyses (Figure 1A). After quality control and clustering24 we obtained the transcriptome of 11 420 cells (supplemental Figure 2A-C), belonging to 8 clusters of cells (Figure 1B). Although the 2 replicates did not show obvious differences (supplemental Figure 2C), any potential batch effect was regressed out before integration. We assigned cell identities based on the expression of known markers and identified additional markers from the data set that were cluster specific (Figure 1C-D). Clusters containing more immature, uncommitted progenitors were identified by their expression of progenitor-associated genes, such as KIT and GATA2, and their lack of expression of genes associated with specific cell lineages and were thus annotated as naïve populations (Figure 1D; supplemental Figure 2D). Clusters that displayed expression of lineage markers were annotated as lineage-committed progenitors (Figure 1B-D; supplemental Figure 2D), including clusters of cells committed toward the megakaryocyte (GP9 and PF4), erythroid (GYPA and KLF1), and granulocyte (AZU1 and PRNT3) lineages (Figure 1D). Markers for each of the cell clusters were identified by differential gene expression analysis, further supporting the identities assigned to each cluster (Figure 1C; supplemental Table 1).

Single-cell transcriptome analysis reveals clusters of naïve and lineage-committed hematopoietic progenitors. (A) Schematic of the scRNAseq experiment where iPSCs (SFCi55) were differentiated in vitro (IVD) for 13 days (supplemental Figure 1A); CD235a−CD43+ suspension cells were isolated by flow cytometry and subjected to a 10x Genomics sequencing platform. (B) tSNE visualization of 11 420 cells divided into 8 clusters, including those defined by gene expression as naïve (naïve 1 and 2), and others that expressed genes associated with erythroid (Ery 1 and 2), megakaryocyte (Mega 1, 2, and 3), and granulocyte (Granulo) lineages. (C) Heatmap showing expression of the top 10 marker genes for each cluster (colors of each cluster are as in panel B). (D) Gene expression levels of marker genes associated with different progenitor cell types that were identified by clustering, visualized on tSNE. tSNE, t-distributed stochastic neighbor embedding.
Single-cell transcriptome analysis reveals clusters of naïve and lineage-committed hematopoietic progenitors. (A) Schematic of the scRNAseq experiment where iPSCs (SFCi55) were differentiated in vitro (IVD) for 13 days (supplemental Figure 1A); CD235a−CD43+ suspension cells were isolated by flow cytometry and subjected to a 10x Genomics sequencing platform. (B) tSNE visualization of 11 420 cells divided into 8 clusters, including those defined by gene expression as naïve (naïve 1 and 2), and others that expressed genes associated with erythroid (Ery 1 and 2), megakaryocyte (Mega 1, 2, and 3), and granulocyte (Granulo) lineages. (C) Heatmap showing expression of the top 10 marker genes for each cluster (colors of each cluster are as in panel B). (D) Gene expression levels of marker genes associated with different progenitor cell types that were identified by clustering, visualized on tSNE. tSNE, t-distributed stochastic neighbor embedding.
Trajectory analyses reveal the hierarchy of in vitro–derived hematopoietic progenitors
To study the hierarchical relationship between cell populations, we performed trajectory analysis using different methods, including diffusion analysis25 with the Seurat R package,24 pseudotemporal ordering with the Monocle R package,26 and partition-based graph abstraction (PAGA).27 Diffusion analysis identified a central core from which 3 distinct trajectories emerged (Figure 2A). The central core corresponded to cells that we had annotated as naïve progenitors (Figure 2A-B). Branches comprised cells expressing genes associated with specific lineages, annotated as erythroid-, megakaryocyte-, and granulocyte-committed lineages (Ery, Mega, and Granulo, respectively, in the figures). Comparable trajectories were observed using pseudotemporal ordering with PAGA and Monocle (Figure 2C-D). The PAGA analysis showed that the naïve cells were highly connected to erythroid-, megakaryocyte-, and granulocyte-committed cells (Figure 2C). Pseudotime reconstruction of the hierarchy showed that cells annotated as naïve 1 were located at the top of the hierarchy and appeared to progress to naïve 2 cells before entering branches containing lineage-committed cells (Figure 2D-E). Lineage commitment was also inferred from the expression of lineage-associated transcription factors that were filtered from the cluster-specific marker genes according to their Gene Ontology (GO) annotation (Figure 2F, supplemental Figure 2E). For example, erythroid-committed clusters demonstrated expression of both KLF1 and MYC, with the latter decreasing in Ery 2 compared with Ery 1, in keeping with their position within the hierarchy (Figure 2E, F). Within megakaryocyte-committed clusters 1 and 2, we observed the expression of GATA1, TAL1, and FLI1, a cocktail of genes recently used for hPSC forward programming to megakaryocytes (Figure 2F).28 Granulocyte-committed cells were represented by a separate branch and demonstrated the expression of CEBP-D, CEBP-B, CEBP-A, and CEBP-E (Figure 2F). We then focused our attention on the transcription factors expressed by the naïve progenitor clusters and noted a high level of expression of LMO4 and ID2, as well as GATA2, which is known to be expressed in HSPCs (Figure 2F). We then inferred their role in the gene network using a network inference algorithm (Partial Information Decomposition and Context).29,30 Single-cell transcriptomic data offer the potential to observe dependencies between the expression profiles of pairs of genes, that if coregulated, are expected to change in a coordinated fashion. Genes with the highest statistical dependencies are connected by edges that, altogether, define the network.29,30 Many of the transcription factors previously detected to be highly expressed within the naïve cell populations, such as ID2, ID4, and LMO4, occupy nodes within this large network (supplemental Figure 3A-B). This strategy corroborates the importance of the identified transcription factors as functional elements within the single-cell gene network.
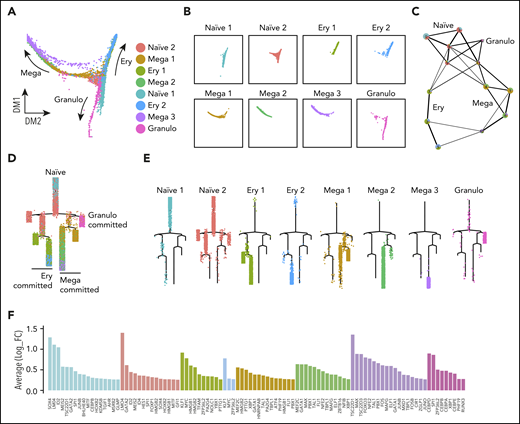
Trajectory analyses support naïve progenitor identity and their progression to lineage-committed progenitors. (A) Diffusion plot displays the naïve progenitors in the core region of the plot from which the 3 directions of commitment originate; the arrows indicate the commitment directions. (B) Representation of each cluster on the diffusion plot. (C) PAGA analysis showed that naïve clusters were connected to the lineage-committed cells. Each node contains a pie chart showing the proportion of cells for each cluster. Colors indicate cluster identities. (D) Monocle trajectory analyses demonstrates a pattern similar to that obtained from the diffusion plot shown in panel A, with naïve progenitors at the top of the hierarchy, with progression toward committment. (E) Monocle trajectory visualizing each cluster individually. (F) Expression levels of the marker genes coding for transcription factors associated with each cluster; bar color indicates the cluster.
Trajectory analyses support naïve progenitor identity and their progression to lineage-committed progenitors. (A) Diffusion plot displays the naïve progenitors in the core region of the plot from which the 3 directions of commitment originate; the arrows indicate the commitment directions. (B) Representation of each cluster on the diffusion plot. (C) PAGA analysis showed that naïve clusters were connected to the lineage-committed cells. Each node contains a pie chart showing the proportion of cells for each cluster. Colors indicate cluster identities. (D) Monocle trajectory analyses demonstrates a pattern similar to that obtained from the diffusion plot shown in panel A, with naïve progenitors at the top of the hierarchy, with progression toward committment. (E) Monocle trajectory visualizing each cluster individually. (F) Expression levels of the marker genes coding for transcription factors associated with each cluster; bar color indicates the cluster.
CD44 membrane expression marks human clonogenic hematopoietic progenitors
To validate the results of our trajectory analyses experimentally, we set out to assess the hematopoietic potential of the naïve progenitor populations. We defined a prospective sorting strategy using genes encoding the cell surface markers CD33, CD44, and ITGB2 (also known as CD18) that were enriched within the naïve progenitors’ clusters (Figure 3A). CD33 was expressed by both naïve 1 and 2 progenitors, whereas CD44 and CD18 expression appeared higher in the naïve 1 population (Figure 3A). We fractionated CD235a−CD43+CD33+ cells and identified subpopulations as naïve 1A (CD44+CD18−), naïve 1B (CD44+CD18+), and naïve 2 (CD44−CD18−; Figure 3B). Trajectory analysis predicted that naïve 1 cells were at the top of the hierarchy and would give rise to the naïve 2 cells before lineage commitment (Figure 2D-E). To test this in silico prediction, we used a chimeric coculture system involving the Zeiss Green (ZsG) reporter hiPSC SFCi55-ZsG line31 (Figure 3C). This approach allowed us to sort, for example, ZsG-labeled naïve 1 cells, then track their ZsG progeny after they were returned to the complex differentiation environment. We synchronously differentiated the SFCi55-ZsG-iPSC line, which constitutively expresses the fluorescent reporter,31 and the parental SFCi55 iPSC line. To verify the progressions of naïve 1 to naïve 2 and naïve 2 to lineage-committed cells, we sorted naïve 1 (CD33+CD44−CD18−) or naïve 2 (CD33+CD44+CD18−/+) cells from ZsG-iPSCs at day 10 and cocultured them with the synchronized differentiating parental cells for a further 3 days. As predicted from the trajectory analysis, the naïve 1 cell population generated ZsG-expressing naïve 2 cells. We also noted that the naïve 1 cells retained their immunophenotype, indicating some self-renewal capacity (Figure 3D). Interestingly, naïve 2 cells demonstrated some potential to acquire CD44 and CD18, which are markers of naïve 1 cells (Figure 3D), suggesting fluidity between these states. As predicted by our trajectory analyses (Figure 2D-E), naïve 2 cells acquired the ability to generate more mature cells, including erythroids (CD235a+), megakaryocytes (CD41+), and macrophages (25F9+; supplemental Figure 3C). We compared the colony-forming capacity of the naïve 1 and 2 progenitors present at days 10 and 13. When plated in clonogenic CFU-C assays, CD44+ naïve 1 cells formed CFU-C colonies but virtually no colonies were generated by naïve 2 cells at either time point (Figure 3E-F). These data support the proposed hierarchy and show that all colony forming cells express CD44. Our chimeric coculture system, therefore, enabled us to assess the lineage output that could not be assessed solely by CFU-C assays. We observed that naïve progenitors expressed high levels of ID genes (Figure 2F) and that they were identified as nodes within the gene network (supplemental Figure 3A). Because ID genes are targets of bone morphogenetic protein (BMP) signaling, we predicted that these naïve cells would be responsive to BMP stimulation. We added BMP4 to the differentiation culture from day 10, when both naïve 1 and 2 cells were present, and then assessed the proportion of these cells 3 days later. In the presence of BMP4, we observed a 25% and 59% expansion of naïve 1 and 2 cells, respectively (supplemental Figure 3E). In this experiment, we used the hESCs H9 and HES3-RUNX1C-GFP, as well as the SFCi55 hiPSC line, and showed that naïve progenitors were present at comparable frequencies in both hESCs and hiPSCs (supplemental Figure 3D), and that naïve progenitors derived from both lines responded to BMP stimulation in a comparable manner (supplemental Figure 3D-E). Thus, this experiment not only identified an important functional signaling pathway but also confirmed that the markers we used to define naïve progenitors and their response to BMP signaling are not PSC line specific.
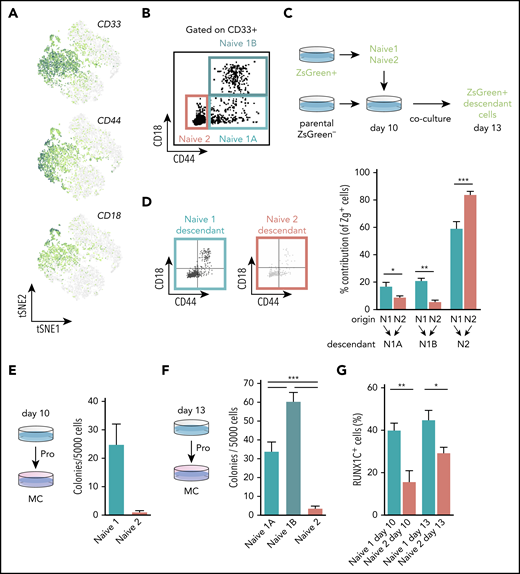
CD44 identifies clonogenic hematopoietic progenitors. (A) Expression levels of genes encoding cell surface markers, CD33, CD44, and CD18 that were associated with the naïve progenitor clusters. (B) Scatterplot of the flow cytometry profile of naïve 1A, 1B, and 2 cells at day 13 of differentiation (hiPSCs-SFCi55). Cells were gated on CD235a−CD43+CD33+. (C) Schematic of the chimeric culture system, using the ZsG reporter to trace cells during the differentiation process. SFCi55-ZsG and parental SFCi55 line were differentiated in a synchronous manner. At day 10, naïve 1 and 2 cells were sorted and cocultured with the parental line differentiation. Coculture was then analyzed at day 13. (D) Representative flow cytometry profile of the day 13 naïve descendants’ cells after sorting at day 10 and chimeric coculturing of naïve 1 and 2 cells. Contribution of naïve 1 and 2 to the naïve 1A, 1B, and 2 compartments (n = 6; multinomial logistic regression. *P < .05; **P < .01; ***P < .005). (E) CFU-C analysis of FAC-sorted naïve 1 and 2 hiPSCs-SFCi55 cells from day 10 (n = 3; paired Student t test. P = .0753). (F) CFU-C analysis of FAC-sorted naïve 1A, 1B, and 2 cells from day 13 (n = 9; Holm-Sidak test. ***P ≤ .001; hiPSCs-SFCi55). (G) HES3-RUNX1-GFP expression in naïve 1 and 2 cells at days 10 and 13 (n = 12; paired Student t test. *P < .05; **P < .01).
CD44 identifies clonogenic hematopoietic progenitors. (A) Expression levels of genes encoding cell surface markers, CD33, CD44, and CD18 that were associated with the naïve progenitor clusters. (B) Scatterplot of the flow cytometry profile of naïve 1A, 1B, and 2 cells at day 13 of differentiation (hiPSCs-SFCi55). Cells were gated on CD235a−CD43+CD33+. (C) Schematic of the chimeric culture system, using the ZsG reporter to trace cells during the differentiation process. SFCi55-ZsG and parental SFCi55 line were differentiated in a synchronous manner. At day 10, naïve 1 and 2 cells were sorted and cocultured with the parental line differentiation. Coculture was then analyzed at day 13. (D) Representative flow cytometry profile of the day 13 naïve descendants’ cells after sorting at day 10 and chimeric coculturing of naïve 1 and 2 cells. Contribution of naïve 1 and 2 to the naïve 1A, 1B, and 2 compartments (n = 6; multinomial logistic regression. *P < .05; **P < .01; ***P < .005). (E) CFU-C analysis of FAC-sorted naïve 1 and 2 hiPSCs-SFCi55 cells from day 10 (n = 3; paired Student t test. P = .0753). (F) CFU-C analysis of FAC-sorted naïve 1A, 1B, and 2 cells from day 13 (n = 9; Holm-Sidak test. ***P ≤ .001; hiPSCs-SFCi55). (G) HES3-RUNX1-GFP expression in naïve 1 and 2 cells at days 10 and 13 (n = 12; paired Student t test. *P < .05; **P < .01).
To assess whether the naïve cell populations identified using our unique sorting strategy showed features of definitive hematopoietic progenitors, we assessed the expression of the HES3-RUNX1C-GFP reporter. We observed RUNX1C-GFP expression in both cell types, with a higher proportion of RUNX1C+ cells in the naïve 1 compared with the naïve 2 populations (Figure 3G). Definitive HSPCs are generated via endothelial-to-hematopoietic transition during embryonic development,32,33 so we would expect comparable hPSC-derived progenitors to have hallmarks of their endothelial origin. In our study, naïve CD44+ cells generated in vitro from hPSCs coexpressed CD34 and the endothelial marker CD144 (also known as VeCad) with expression being higher at day 10, when most of the naïve progenitors were present (supplemental Figure 3L). This endothelial signature of naïve progenitors, together with their lineage potential reflects their definitive features. To confirm that CD44 expression is associated with HSPCs in vivo we demonstrated its colocalization with CD45 and CD144 in the mouse yolk sac and AGM region (supplemental Figure 3F-J). At E10.5 in the yolk sac, CD44 was expressed on endothelial cells in a bimodal fashion, with vessels expressing low and high levels, the latter being associated with bright clusters of hematopoietic cells (supplemental Figure 3G). By flow cytometry, we observed that by E11, all CD45+ cells and a proportion of CD144+ cells were within the CD44high population (supplemental Figure 3F). Within the embryo proper, CD44 was expressed on the membrane of endothelial cells within the dorsal aorta, whereas venous endothelial layers were CD44− (supplemental Figure 3H-I). CD44 was also coexpressed with CD45+ in the AGM region (supplemental Figure 3H-J). Furthermore, expression of LMO4 in CD44+ cells within the AGM region is in keeping with its high level of expression in naïve hPSC-derived HSPCs (Figure 2F) and supports its identification as a novel hematopoietic transcription factor. These data suggest that CD44 is expressed on hemogenic endothelial cells and that it is retained on emerging hematopoietic cells in vivo, similar to what we have observed during the in vitro differentiation of human progenitors (supplemental Figure 3I).
Identification of membrane markers of lineage-committed progenitors
We next selected membrane markers that we predicted could be used for the isolation of lineage-committed progenitors. Erythroid-primed clusters 1 and 2 both showed expression of MYC (Figure 2F) and EPCAM (also known as CD326; supplemental Figure 4A), indicative of early-committed erythroid cells.34,35 We confirmed that CD326 was expressed in most of the CD235a+ cells at day 13 of iPSC differentiation, but interestingly, we noted a small number of CD326+CD235a− cells (supplemental Figure 4B), suggesting that CD326 may be marking commitment to the erythroid lineage before CD235a acquisition. To test this possibility, we assessed the expression dynamics of these markers during the erythroid differentiation of umbilical cord blood CD34+ (UCB34+) cells. At day 10 of differentiation, CD326 was expressed in CD235a−/low cells but not in CD235ahigh cells, the latter corresponding to more mature erythroid cells (supplemental Figure 4B). CD326 was not expressed in cells at day 18 of the differentiation protocol (when most of the cells were mature CD235a+ cells), nor in the mature erythrocytes found in adult peripheral blood (supplemental Figure 4B). Taken together, these data suggest that CD326 marks early erythroid progenitors in hiPSCs, fetal-, and adult-derived cells. We also noted the expression of HBG1, HBG2, HBA1, and HBA2, subunits of fetal hemoglobin, indicative of erythroid cells derived from definitive hematopoiesis (supplemental Figure 4C).
Three clusters with megakaryocyte and platelet signatures (Mega-primed 1, 2, and 3) were predicted by expression of ITGA2B (CD41), GP9, PF4 (Figure 1C-D; supplemental Table 1). ICAM2 was expressed at higher level in cluster Mega-primed 3 (supplemental Figure 4D), as for CD9, known to increase along megakaryocyte differentiation.36 ICAM2 and CD9 coexpression was confirmed by flow cytometry (supplemental Figure 4D). We observed a population of CD41+CD9+ICAM2+ cells, with ∼85% of the CD41+CD42a+ (supplemental Figure 4E) cells that did not show polyploidy, supporting their immature status (supplemental Figure 4F-G).
Granulocyte-committed clusters were predicted by expression of markers, such as MPO, AZU1, RNASE2, and ITGB2 which encodes the membrane marker CD18, subunit of different leukocytes marker, such as CD11a-d, Mac-1, and LFA-1 (Figure 1C; supplemental Table 1). We sorted CD235a−CD43+CD33+CD44−CD18+ cells and confirmed the phenotype of granulocytes and monocytes based on their nuclear morphology (supplemental Figure 4H). Further clustering revealed 3 subclusters corresponding to the eosinophil, neutrophil, and monocyte lineages (supplemental Figure 4I-L). It is noteworthy that RUNX3 expression was specifically associated with the monocyte subcluster (supplemental Figure 4J), previously reported to be important for zebrafish stem cells and macrophages37 and to be expressed by mouse tissue-resident macrophages of the skin.38
In summary, naïve progenitors also gave rise to committed progenitors characterized by features of granulocytes and monocyte, cell types that emerge exclusively in the definitive waves.5
CITE-seq analysis of human iPSC-derived hematopoietic progenitors
To further study the temporal emergence of the progenitor populations and their associated markers, we performed CITE-seq analysis whereby single-cell membrane marker expression can be correlated directly with the relative transcriptome.17 To ensure that we sampled even the rarest progenitor cell population, we extended the CITE-seq analysis to adherent cells and included an earlier time point (day 10) in addition to day 13. Again, to exclude primitive erythroid cells, we selected CD235a− suspension cells but, in this experiment, we included and enriched for CD43− cells that had been excluded in our initial study (supplemental Figure 5B). We expected early progenitors to express CD31 and to potentially remain part of hematopoietic clusters within the adherent fraction of the culture, and so we used FACS to sort the adherent cells into CD31− and CD31+ fractions. The cells were labeled with an oligonucleotide-tagged antibody specific for the membrane markers that we identified in our initial experiment (antibody-derived tag [ADT]_CD18, ADT_CD33, ADT_CD41, ADT_CD44, ADT_CD102, and ADT_CD326) as well as other markers of endothelial and early-committed hematopoietic cells (ADT_CD144) and of macrophages (ADT_CD163). To test the specificity of the membrane marker repertoire previously identified on the suspension cells, we subset the 2 libraries corresponding to suspension cells collected at days 10 and 13 (Figure 4; supplemental Figure 5B-C). After multidimension reduction and clustering analysis, we identified a naïve progenitor population (Figure 4A), comparable to our first sequencing experiment (Figure 2A). These naïve progenitors exhibited erythroid-, megakaryocyte-, granulocyte- and monocyte-lineage potential, with increased lineage commitment at day 13 compared with that on day 10 (Figure 4B), in line with the expression pattern of genes associated with naïve and committed stages on those days (supplemental Figure 5D). Analysis of the ADTs showed that each marker was expressed in the expected cluster (Figure 4C), thus supporting them as markers for defined progenitors. To further explore the power of the ADT approach, we performed multidimension reduction, using ADTs as the only input dimensions, and proved that ADT data alone identified remarkably similar clusters (Figure 4D-E), strongly correlated with the clusters derived from the entire transcriptome (Figure 4F). The CITE-seq approach confirms that the markers identified from our first scRNAseq analysis define the hierarchy of human developmental hematopoiesis in vitro with high specificity.
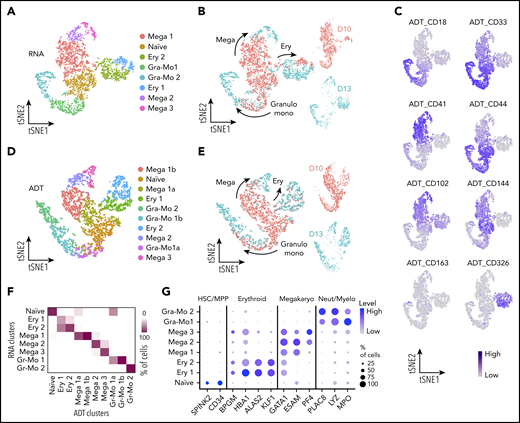
CITE-seq analyses confirm markers for naïve and lineage-committed progenitor cells. (A) tSNE visualization of the CITE-seq analysis of days 10 and 13 CD235a− suspension cells. Dimension reduction and clustering analyses were performed using only transcriptomic data (hiPSC-SFCi55). (B) tSNE visualization of the libraries obtained from CD235a− suspension cells collected at days 10 and 13 showing the direction of lineage commitment. (C) Single-cell protein expression level of the membrane markers associated with the different cell types. Data are visualized on tSNE. (D) tSNE plot and annotation of clustering obtained from analysis derived from ADT data alone. (E) Visualization of the libraries obtained from CD235a− suspension cells projected on the tSNE obtained from ADT data in panel D. Cell progression shows lineage commitment trajectory, with cells colored according to the day of collection. (F) Confusion matrix of clustering obtained from complete transcriptomic data (RNA) and that were obtained from ADT data alone. The color of each box indicates the percentage of cells classified in each RNA vs ADT cluster. (G) Gene expression levels of human fetal marker genes in the naïve and lineage-committed progenitors. tSNE, t-distributed stochastic neighbor embedding.
CITE-seq analyses confirm markers for naïve and lineage-committed progenitor cells. (A) tSNE visualization of the CITE-seq analysis of days 10 and 13 CD235a− suspension cells. Dimension reduction and clustering analyses were performed using only transcriptomic data (hiPSC-SFCi55). (B) tSNE visualization of the libraries obtained from CD235a− suspension cells collected at days 10 and 13 showing the direction of lineage commitment. (C) Single-cell protein expression level of the membrane markers associated with the different cell types. Data are visualized on tSNE. (D) tSNE plot and annotation of clustering obtained from analysis derived from ADT data alone. (E) Visualization of the libraries obtained from CD235a− suspension cells projected on the tSNE obtained from ADT data in panel D. Cell progression shows lineage commitment trajectory, with cells colored according to the day of collection. (F) Confusion matrix of clustering obtained from complete transcriptomic data (RNA) and that were obtained from ADT data alone. The color of each box indicates the percentage of cells classified in each RNA vs ADT cluster. (G) Gene expression levels of human fetal marker genes in the naïve and lineage-committed progenitors. tSNE, t-distributed stochastic neighbor embedding.
Comparison of in vitro–generated progenitors with in vivo–produced cells
The use of human PSCs as a renewable source of hematopoietic cell types faces major challenges relating to, for example, the inefficient repopulation capacity of progenitor cells and the incomplete maturation of differentiated cell types. To identify the underlying molecular basis associated with these deficiencies in hPSC-derived cells, we compared our data set to a human fetal liver data set that contains the complete hematopoietic hierarchy from long-term reconstituting HSCs to differentiated cell types.
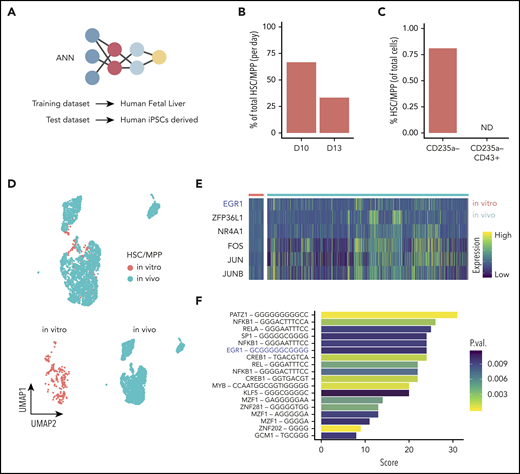
To assess how hPSC-derived naïve and lineage-committed progenitors compared with their equivalent counterpart generated in vivo, we assessed the expression of selected genes identified to distinguish the various cell types detected in the human fetal liver39 (Figure 4G). An initial analysis of marker genes of lineage commitment in the developing embryo revealed that these markers are remarkably powerful for discriminating the equivalent in vitro cell types identified in our in vitro study (Figure 4G; supplemental Table 1). Interestingly, SPINK2, a newly reported marker of fetal HSC/multipotent progenitors (MPPs),39 was also expressed specifically by our naïve progenitor cells (Figure 4G), together with CD34 (supplemental Figure 3L). These specific similarities observed between in vitro and in vivo developing hematopoietic progenitor cells led us to investigate the phenotype of cell types that are produced in vitro in a more comprehensive manner and how well these in vitro–derived cells reflect the corresponding cell types during in vivo development. To do this, we used the same published human fetal liver scRNAseq data as a reference: first, to identify in vitro–derived cells with gene expression signatures of human fetal liver hematopoietic cells and, second, to quantify the similarity to their corresponding transcriptomes. To address the first question, we used machine learning to transfer labels from the fetal liver reference data to our in vitro–derived blood cells (Figure 5A). This approach enabled a much broader and unbiased identification of cell types compared with inference based purely on marker genes. We followed our recently developed strategy40 and trained an ANN40 to recognize single-cell gene expression profiles of human fetal liver cells that were sampled at a time in development when the liver is the main site of blood cell formation.39 In brief, this ANN is trained using the expression data of 3479 genes and 145 725 cells from fetal liver as an input.39 From these labeled data, the ANN learns to predict from which of the 28 different fetal liver cell types a particular gene expression pattern originates. Once trained, the ANN is given previously unseen test data from in vitro–derived cells as an input, to annotate these data with human fetal liver cell labels. Since this approach considers 3479 genes, it enables a more comprehensive identification of cell types based on similarities in global gene expression patterns rather than specific marker genes.

ANN identifies HSC-like cells in iPSC-derived hematopoietic cells. (A) Schematic of the ANN architecture for label transfer composed of an input layer (3479 units), 2 fully connected hidden layers (64 and 32 units), and a 28-unit softmax layer corresponding to cell types in the source domain (human fetal liver scRNAseq data) used for training. Classification of cell types in the target domain of human iPSC-derived single-cell transcriptomes (test data). (B) Proportion of cells labeled HSC/MPP at day 10 or day 13 of hiPSC differentiation in vitro. (C) Proportion of in vitro–derived CD235a− progenitors and CD235a−CD43+ cells labeled HSC/MPP by the ANN (ND, not detected). (D) UMAP visualization of the integrated data set containing in vivo–derived and in vitro–annotated HSCs/MPPs. (E) Heatmap of differentially expressed genes coding for transcription factors obtained from the comparison of in vivo– and in vitro–derived HSCs/MPPs. (F) Transcription factor binding motifs enriched upstream of the 54 genes identified as differentially expressed between HSC/MPP generated in vitro and in vivo. UMAP, uniform manifold approximation and projection.
ANN identifies HSC-like cells in iPSC-derived hematopoietic cells. (A) Schematic of the ANN architecture for label transfer composed of an input layer (3479 units), 2 fully connected hidden layers (64 and 32 units), and a 28-unit softmax layer corresponding to cell types in the source domain (human fetal liver scRNAseq data) used for training. Classification of cell types in the target domain of human iPSC-derived single-cell transcriptomes (test data). (B) Proportion of cells labeled HSC/MPP at day 10 or day 13 of hiPSC differentiation in vitro. (C) Proportion of in vitro–derived CD235a− progenitors and CD235a−CD43+ cells labeled HSC/MPP by the ANN (ND, not detected). (D) UMAP visualization of the integrated data set containing in vivo–derived and in vitro–annotated HSCs/MPPs. (E) Heatmap of differentially expressed genes coding for transcription factors obtained from the comparison of in vivo– and in vitro–derived HSCs/MPPs. (F) Transcription factor binding motifs enriched upstream of the 54 genes identified as differentially expressed between HSC/MPP generated in vitro and in vivo. UMAP, uniform manifold approximation and projection.
The ANN identified cell types within the source domain (the fetal liver data) with high accuracy, as shown by the performance metrics obtained from 5-fold cross-validation (supplemental Figure 6A-B). The trained ANN was subsequently applied to the target domain (the in vitro–derived data set) to test whether the hPSC-derived cells were similar to those present in the fetal liver, in which case the label of that specific in vivo cell would be transferred. The ANN assigned labels to 92% of in vitro–produced cells into various cell types present in vivo (supplemental Figure 6 C-D), most notably, a small population was labeled as HSCs/MPPs. This result indicates that the global gene expression pattern of a subset of the in vitro–derived cells was very similar to HSCs/MPPs from the in vivo reference data in fetal liver. To quantify precisely how similar these in vitro–derived HSCs/MPPs are to their in vivo counterparts, we calculated the average pairwise Euclidean distance between HSCs/MPPs, using the human fetal liver as a reference. The results indicated that the fetal liver HSCs/MPPs were, on average, only marginally more similar to one another than they were to iPSC-derived HSC/MPPs (supplemental Figure 8A). In summary, this analysis indicates that the in vitro–derived HSCs/MPPs closely, yet not perfectly, reflect the gene expression patterns of their in vivo counterparts in the fetal liver. Using the ANN, we also observed that the relative abundance of the predicted HSC/MPP population decreased with time by day 13 (Figure 5B), whereas, the relative abundance of committed cells increased during this time, as expected (supplemental Figure 6E). When we applied the same ANN strategy to our first data set, which was generated from day 13 progenitors that were selected on the basis of CD43 expression, no HSCs/MPPs were detected (Figure 5C). This finding is consistent with our observation that this transient HSC/MPP population was present in a higher number earlier, at day 10, when they were almost equally distributed in the adherent CD31+ and suspension CD235a− compartment (supplemental Figure 6F). We looked for marker genes that define this predicted HSC/MPP cell population in vitro, looking specifically for membrane markers according to their GO annotation (supplemental Table 1). Together with expected markers such as CD34, CD44, and CD33, we also detected CD132, CD52, CD180, and IL3RA and many others that will allow for designing a prospective sorting strategy to isolate this specific population. We then created subsets for the in vivo and in vitro HSCs/MPPs and integrated the 2 data sets (Figure 5D). The integrated data allowed for direct comparison of their transcriptome and identified 54 differentially expressed genes (supplemental Table 1), all of which were lower in HSCs/MPPs produced in vitro than in those generated in vivo. GO analysis of these genes identified enrichment for KEGG (Kyoto Encyclopedia of Genes and Genomes) signaling pathways, such as NOD-like receptor, IL-17, NF-κB, and HIF-1 (supplemental Table 1). We also identified 6 genes encoding the transcription factors EGR1, ZFP36L1, NR4A1, FOS, JUN, and JUNB (Figure 5E). Interestingly, the EGR1-binding site was enriched, among others, in the upstream region of the differentially expressed genes (Figure 5F), suggesting an important regulatory role of EGR1.
We next compared the transcriptome of hPSC-derived HSCs/MPPs that were predicted by the machine-learning approach to the transcriptome of hematopoietic progenitors isolated from the different sites of hematopoiesis in the developing embryo. We used published data sets derived from fetal liver HSCs/MPPs,39 yolk sac MPPs39 that were collected at Carnegie stages 5 to 14, and AGM-sorted41 progenitors (CD34+CD45+CD235a−) collected at Carnegie stage 15, around the time of early HSCs emergence (supplemental Figure 7A-B). Whole transcriptome comparison, followed by KEGG pathway analysis, showed that in vitro HSC/MPP cells were marked by the expression of genes associated with oxidative phosphorylation (supplemental Table 1), indicating metabolic differences between in vitro– and in vivo–produced progenitors. Hypoxic conditions characterize mammalian embryo develepoment42 and, more specifically, the development of the hematopoietic system, where hypoxia has been detected in hematopoietic clusters in the AGM region and in the fetal liver.43 The hematopoietic progenitors derived from hPSCs were generated in vitro under normoxic conditions, and this could explain their different metabolic profile.
Another notable finding was that fetal liver progenitors were marked by HLA genes, and consequently, the KEGG pathways associated with antigen presentation and T-cell development (supplemental Table 1). The AGM data set displayed high expression levels of genes associated with the Notch pathway, such as HES1, NOTCH1, NOTCH2, JAG1, and JAG2. Their expression level is in line with the developmental stage at which they were collected when the Notch pathway orchestrates HSC emergence.44 Within the markers of yolk sac progenitors, we detected genes related to early hematopoietic development. FRZB, a mesodermal cell marker, and HBE1, a marker of primitive hematopoiesis, were listed in the top 10 differentially expressed genes, which supports the early developmental features of these yolk sac progenitors. From this analysis, gene expression differences were detected between all the samples, both in vivo and in vitro, suggesting that the hPSC-derived HSCs/MPPs do not precisely recapitulate any progenitor population derived from either of the tissues analyzed. However, the limited availability of data sets, the different sorting strategies, and, in some cases, the different scRNAseq chemistries may act as confounders for this analysis; additional coherent data sets are needed to address this question.
Finally, we noted also that SPINK1 was identified as the marker for yolk sac progenitors. Although SPINK2, identified here and by others as a marker of progenitor cells,39,41 was expressed by progenitors from all the tissues, SPINK1 was detected exclusively in the yolk sac (supplemental Figure 7D), suggesting that this gene could discriminate extraembryonic from intraembryonic hematopoiesis.
The ANN strategy also identified lineage-committed cells in our in vitro data set, which we then compared with their in vivo counterpart from fetal liver, to identify genes that can be used as targets to improve the production in vitro of differentiated blood cell types. We listed the differentially expressed genes between in vitro and fetal liver cells and identified the transcription factors within the list (supplemental Figure 8; supplemental Table 1).
Particularly interesting was that late erythroid cells in vitro showed a high level of PCLG2 (phospholipase Cγ2) able to control intracellular calcium via production of inositol triphosphate. Intracellular calcium peaks in orthochromatic erythroblasts just before enucleation.45 Erythroid cells derived from hPSCs are characterized by generally inefficient enucleation,18,46 independently of their primitive or definitive origin (supplemental Figure 1J), and this deficiency could be related to their intracellular calcium control.
In summary, we used a machine-learning approach to identify a rare population of HSC/MPP-like cells in vitro that emerge early during differentiation of hPSCs and that display a gene expression pattern that is broadly similar to that of HSCs in development. The difficulties in generating fully functional HSCs from hPSCs is well recognized, but the identification of the transcriptome of a rare progenitor population that most closely resembles HSCs represents a significant advance. However, subtle differences were also apparent and could explain the functional deficiencies of hPSC-derived cells and could ultimately be explored to improve their therapeutic potential.
Discussion
We describe the single-cell transcriptome and membrane markers of naïve hematopoietic progenitors and their lineage-committed descendants derived in vitro from human pluripotent stem cells. The repertoire of membrane markers proved to be remarkably accurate in capturing the different states before and after lineage commitment.
We identified a population of naïve progenitors situated at the top of the differentiation hierarchy, marked by CD44, a protein involved in the hematopoietic transition of the hemogenic endothelium in the mouse AGM region.47 We validated their lineage potential by using a chimeric culture system, where isolated naïve progenitors, marked by Zeiss-Green expression, demonstrated a lineage output that overlapped that predicted in silico.
We also observed that progenitors are capable of moving between the naïve states and of progressing into committed states. This finding is in keeping with the many other scRNAseq and proteomic studies that have reported a continuum of cell states, as opposed to sequential discrete cell type hierarchies.48-51 In line with a recent murine study,47 we showed that CD44 is expressed in naïve hPSC-derived progenitors and demonstrated that both human and mouse progenitors also express LMO4, a LIM-domain protein.52 Recent scRNAseq detected LMO4 in both human granulocyte progenitors in the bone marrow48 and adult mouse HSCs,53 but its associated proteins have not been identified. We also reported high levels of ID genes within the progenitors, target genes of BMP signaling known to be involved in HSCs emergence.54-56 IDs, like LMOs proteins, do not present a DNA binding domain, but rather act through binding of other proteins in complexes involved in HSPC development57 and erythropoiesis.58 Overexpression of ID2 in human HSCs from cord blood has been reported to enhance their functional stemness in vivo,59 supporting the idea that this class of proteins may maintain the progenitor status and thus may be useful in alternative programming strategies of hPSCs.
We showed that hPSC-derived cells had a remarkably specific expression pattern of marker genes identified in the human embryo. For example, SPINK2, a novel marker of human fetal liver HSCs and MPPs, also marked our naïve progenitors. The use of scRNAseq on a vast number of cells allows for detection of even the rarest cell population, and we considered that it might enable the detection of rare HSC-like cells in differentiating hPSC cultures. By using machine learning, we identified specific cell types sampled in vivo and detected a small and transient population of HSC-like cells that, when compared with their in vivo counterparts from fetal liver, showed relatively small transcriptional differences. Previous reports described the hematopoietic progenitors obtained with the differentiation protocol used in this study as intraembryonic-like, using the T-cell lineage as a hallmark of definitive hematopoiesis.20 However, the yolk sac showed T-cell potential before HSCs emergence,60,61 thus limiting the use of a T-cell assay alone as discriminative of the corresponding developmental wave. Our machine-learning approach and the detection of HSC-like cells support the intraembryonic identity of the hematopoietic cells differentiated in vitro. The unbiased and comprehensive machine-learning approach enabled us to identify a list of genes that were expressed at a lower level in in vitro HSC-like cells compared with those in the fetal liver and that thus could be explored to improve production of functional HSC in vitro. For example, we propose a regulatory role for the transcription factor EGR1, expressed at low levels in vitro, whose binding site was also enriched in the upstream region of the differentially expressed genes. We therefore hypothesize that transgenic expression or activation of EGR1 would improve the direct programming approaches and produce HSCs in vitro.
Our machine-learning analysis also indicated that in vitro HSC-like cells did not express CD43, a phenotype that is comparable to mouse pro-HSCs before their maturation into functional, definitive HSCs.62 This finding could suggest that the widely acknowledged inability of hPSC-derived progenitors to reconstitute the hematopoietic system is related to their immature phenotype and the failure of the culture conditions to promote HSC maturation and maintenance. In addition, the identification of the HSC-like population by our machine-learning approach, which is based on high similarity of the gene expression profiles, could suggest that the molecular basis of the functional deficiency of this in vitro–derived population could reside at a posttranscriptional level. Future experiments are necessary to assess whether a further ad hoc maturation step of sorted HSC-like cells would achieve reconstitution.
When we compared the hematopoietic progenitors developed in the human embryo throughout gestation with those derived in vitro, we found that, whereas SPINK2 was expressed by all progenitors, SPINK1 was exclusively detected in cells from the yolk sac. SPINK1 binds to EGFR and induces the epithelial-to-mesenchymal transition in cancer cells,63,64 a process similar to the endothelial-to-hematopoietic transition, where the role of SPINK1 remains largely unexplored. We propose that SPINK1 could distinguish between primitive and definitive hematopoiesis and could be used in a lineage-tracing strategy to track the cells that colonize the embryo from the yolk sac.
The defined, serum-free differentiation protocol used in this study is one of the protocols most commonly used by many laboratories, and we have shown that the hematopoietic progenitor cell markers we defined can identify functionally similar progenitors in several different hPSC lines. Thus, our browsable data sets and the findings of our study should be of interest to many in the field of hematopoiesis and enable them to test how the frequency of progenitor populations vary in response to different cytokine conditions. In addition, the increasing availability of a large scRNAseq data set of human tissue makes our ANN pipeline applicable to the analyses of other systems where hPSCs differentiation aims to produce adult-like cells for clinical application. In this way, cell types differentiated in vitro can now be annotated in an unbiased manner that does not rely on a few known markers and enables the identification of transcriptional discrepancies between cell types produced in vitro and their in vivo counterparts.
In summary, our browsable data set provides a comprehensive transcriptional characterization of in vitro derived hematopoietic progenitors. This work defines the heterogeneity and hierarchy of HSC-like cells and progenitor populations that give rise to immune cells, such as macrophages and granulocytes, which holds great promise for their therapeutic application.
Single-cell and CITE-seq profiles of human HSPCs derived in vitro from pluripotent stem cells are browsable at lab.antonellafidanza.com. Data from the study can be obtained, plots can be generated and exported, and full data sets can be downloaded.
The online version of this article contains a data supplement.
The publication costs of this article were defrayed in part by page charge payment. Therefore, and solely to indicate this fact, this article is hereby marked “advertisement” in accordance with 18 USC section 1734.
Acknowledgment
The authors thank Ben MacArthur for suggesting the application of machine learning to our study; Andrew Elefanty for sharing the RUNX1C-GFP cell line; James Palis for providing feedback on the manuscript; Elisa Laurenti, Muzlifah Haniffa, and Issac Emmanuel Goh Kai'En for their support with the human in vivo single cell data; Fiona Rossi, Claire Cryer, Bindi Heer, and Andrea Corsinotti from the Flow Facility; Bertand Verney and Matthieu Vermeren from the imaging facility; and the Edinburgh Compute and Data Facility (ECDF; http://www.ecdf.ed.ac.uk/) for making their resources available to us.
The work was funded by the Wellcome Trust (Grant 102610), Medical Research Council (MRC) Innovate UK Grant (102853), and the Biotechnology and Biological Sciences Research Center (BBSRC; Grant S002219/1). A.F. received a Carnegie Incentive Grant (RIG008218). A.B. received a BBSRC Future Leaders Fellowship (BB/N011597/1). Sequencing was carried out by Edinburgh Genomics, The University of Edinburgh, which is partly supported by core grants from the National Environment Research Council (NERC; R8/H10/56), the MRC (MR/K001744/1), and the BBSRC (BB/J004243/1).
Authorship
Contribution: A.F. designed and performed the research, analyzed the data, and wrote the manuscript; A.F., P.S.S., A.B., and N.R. performed the bioinformatics analysis; P.R., S.T., M.L.-Y., A.H.T., J.E., B.E.P.H., and R.A. performed the research; L.M.F. designed the experiment, analyzed the data, and wrote the manuscript; and N.C.H., A.M., K.O., and N.R. provided intellectual input and final approval of the manuscript.
Conflict-of-interest disclosure: The authors declare no competing financial interests.
Correspondence: Antonella Fidanza, Center for Regenerative Medicine, University of Edinburgh, 5 Little France Crescent, Edinburgh EH16 4UU, United Kingdom; e-mail: afidanza@ed.ac.uk; and Lesley M. Forrester, Center for Regenerative Medicine, University of Edinburgh, 5 Little France Crescent, Edinburgh EH16 4UU, United Kingdom; e-mail: l.forrester@ed.ac.uk.