Key Points
A snoRNA-focused CRISPR-Cas9 screen identified SNORD42A to critically regulate proliferation of leukemic cells.
SNORD42A regulated ribosomal biogenesis and overall protein synthesis via 18S-U116 2′-O-methylation.

Abstract
Noncoding RNAs, including small nucleolar RNAs (snoRNAs), play important roles in leukemogenesis, but the relevant mechanisms remain incompletely understood. We performed snoRNA-focused CRISPR-Cas9 knockout library screenings that targeted the entire snoRNAnome and corresponding host genes. The C/D box containing SNORD42A was identified as an essential modulator for acute myeloid leukemia (AML) cell survival and proliferation in multiple human leukemia cell lines. In line, SNORD42A was consistently expressed at higher levels in primary AML patient samples than in CD34+ progenitors, monocytes, and granulocytes. Functionally, knockout of SNORD42A reduced colony formation capability and inhibited proliferation. The SNORD42A acts as a C/D box snoRNA and directs 2′-O-methylation at uridine 116 of 18S ribosomal RNA (rRNA). Deletion of SNORD42A decreased 18S-U116 2′-O-methylation, which was associated with a specific decrease in the translation of ribosomal proteins. In line, the cell size of SNORD42A deletion carrying leukemia cells was decreased. Taken together, these findings establish that high-level expression of SNORD42A with concomitant U116 18S rRNA 2′-O-methylation is essential for leukemia cell growth and survival.
Introduction
Acute myeloid leukemia (AML) is a malignant neoplasia of myeloid bone marrow cells with significant molecular heterogeneity. It is characterized by expansion of clonal cells leading to bone marrow failure accompanied by severe clinical symptoms such as anemia, immunosuppression, and thrombocytopenia. AML can be cured in less than half of younger patients, while patients >60 years are only cured in 5% to 15% of all cases.1 New therapeutic targets could facilitate improvement of AML prognosis.
Small nucleolar RNAs (snoRNAs) belong to the large group of small noncoding RNAs and are involved in ribosomal RNA (rRNA) posttranscriptional modifications. SnoRNAs are divided into 2 major groups: C/D box snoRNAs and H/ACA box snoRNAs. C/D box snoRNAs form the snRNA-protein complexes (snoRNPs) with fibrillarin (FBL) and guide 2′-O-methylation of rRNAs, whereas H/ACA box snoRNAs form complexes with dyskerin and are responsible for pseudouridynlation of rRNAs.2 In addition, snoRNAs might affect splicing; for example, SNORD27 can regulate the alternative splicing of transcription factor E2F7.3
Dysregulation of snoRNAs occurs in different types of cancer, but how snoRNAs contribute to oncogenesis remains obscure.4-7 It was shown that snoRNAs may act as either protooncogenes or tumor suppression genes. For example, the H/ACA box SNORA42 was upregulated in nonsmall cell lung cancer, shown to act as a protooncogene.8 In multiple myeloma, overexpression of 4 snoRNAs (SNORD25, SNORD27, SNORD30, and SNORD31) correlated with disease progression from smoldering multiple myeloma to symptomatic multiple myeloma.9 In contrast, SNORD47 and SNORD76 act as tumor suppressors in glioblastoma.10,11 In line, deletion of SNORD50A and SNORD50B occurs in multiple cancers. Loss of these 2 snoRNAs activates K-RAS in cancer cells and associates with poor prognosis.12
Recently, we showed that induction of snoRNAs was essential for t(8;21)-associated AML. The leukemogenic fusion oncogene AML1-ETO induced snoRNAs via amino-enhancer of split (AES) protein. This process was required for AML1-ETO induced self-renewal and leukemia. Global loss of snoRNA expression by AES depletion decreased stemness.13 However, the functions of individual snoRNAs in leukemogenesis and the relevance of 2′-O-methylation in leukemogenesis remained unknown. Given that SNORDs and RNA modifications might be potential targets for therapeutic interventions, we investigated the role of the snoRNAnome in leukemia.
Methods
Primers and guide RNA (gRNA) sequences are listed in supplemental Table 1 (available on the Blood Web site).
Cell culture
Cell lines were purchased from ATCC or DSMZ and cultured at 37°C with 5% CO2. 293T cells (CRL-3216) were cultured in Iscove modified Dulbecco medium containing 10% fetal bovine serum (FBS), whereas Kasumi-1 cells were cultured in RPMI-1640 supplemented with 20% FBS. MV4-11 (CRL-9591), U937 (CRL-1593.2), HL60 (CCL-240), OCI AML-2 (DSMZ no. ACC99), and OCI AML-3 (DSMZ no. ACC 582) cells were cultured in RPMI-1640 with 10% FBS. Cells were grown in log phase (1 × 10⁵ to 1 × 10⁶cells/mL).
CRISPR-Cas9 gRNA library screen
A CRISPR-Cas9 snoRNA-library with 1559 single-guide RNAS (sgRNAs) targeting known snoRNA genes, snoRNA host genes, as well as positive (MYC, RUNX1, and EIF4A1) and nontargeting controls was designed. The library sgRNAs were cloned into the lentiCRISPRv2 vector (Addgene 52961).14 Screening was performed with slight modifications to the protocol of Shalem et al.15 In brief, 293T cells were transfected with the lentiCRISPRv2 snoRNA library, pVSVG, and psPAX2 using TurboFect transfection reagent (Thermo Fisher Scientific). At 48 hours after transfection, supernatant containing lentivirus particles was harvested and concentrated by ultracentrifugation. All human leukemic cell lines were infected with the multiplicity of infection of 0.3. Samples were taken at day 1 (48 hours after infection), day 5, and day 9 with 2 biological replicates. For each sample, the genomic DNA of 5 million cells was isolated. The sgRNA encoding sequences were amplified by nested polymerase chain reaction (PCR) (first step 15 cycles, second step 19 cycles). PCR products were purified with Agencourt AMPure XP beads (Beckmann Coulter) and sequenced for the integrated sgRNAs on Illumina MiSeq. MAGeCK software was used to analyze the results.16
Generation of single snoRNA knockouts
Individual snoRNA knockouts were generated using CRISPR-Cas9. Specific sgRNAs were cloned either into the lentiCRISPRv2 with puromycin resistance or the pL-CRISPR.EFS.GFP (Addgene 57818)17 with GFP as selection marker. Lentivirus-infected cells were selected for GFP expression or puromycin resistance for a period of 72 hours.
Sanger sequencing
For verification of individual CRISPR-Cas9–mediated snoRNA knockouts, we used Sanger sequencing. First, the genomic region of SNORD42A was PCR amplified. Second, after gel electrophoresis, PCR products were purified using the Zymoresearch Gel DNA recovery Kit and sequenced. We used the inference of CRISPR edits (ICE) software (Synthego) to analyze single clone knockouts.
RNA isolation, reverse transcription (RT), and quantitative RT-PCR
RNA was isolated using the miRNeasy Mini Kit (Qiagen) or the mirVana miRNA Isolation Kit (Thermo Fisher Scientific). Reverse transcription for snoRNAs of interest was performed using the Mir- miRNA First-Strand Synthesis Kit (Clontech). A snoRNA-specific forward and a common reverse primer were used for quantitative PCR. SnoRNA expression levels were analyzed using the ΔΔCt method with 5S rRNA or U6 as internal control.
Proliferation assay
Proliferation of leukemia cells was quantified by serial cell counting. Cells were seeded 4 days after infection with a density of 1 × 10⁵ per mL. Cells were counted at days 6, 8, and 10 after infection.
Colony-forming unit assay
In brief, 300 cells per well were seeded in 600 μL methylcellulose supplemented with 10% FCS. MV4-11 and Kasumi-1 colonies were quantified after 8 and 10 days, respectively. Only colonies with >50 cells were counted.
RiboMethSeq
RiboMethSeq was performed as previously described with minor modifications.18,19 Briefly, 100 ng total RNA was fragmented by alkaline hydrolysis at 95°C for 12 minutes to achieve a fragment length of ∼30 nt. Libraries were prepared using the NEBNext Small RNA library prep kit, followed by single-end sequencing on Illumina NextSeq500 instrument. Sequencing reads were trimmed with trimGalore to remove adapter sequence content. Reads <15 nt in length after trimming were discarded. Afterward, reads were mapped with bowtie2 to ribosomal DNA sequences. Methylation was calculated by ScoreC as described before based on the reads on 5′-end of fragment. Annotation of modification sites as well as rRNA sequence was downloaded from https://www-snorna.biotoul.fr.
Quantitation of 2′-O-methylation on 18S-U116 by quantitative PCR
2′-O-methylation of 18S-U116 was analyzed accordingly to a previously published protocol with adaptation.20 Reverse transcription was performed using RNase H minus Moloney murine leukemia virus reverse transcriptase, RNasin ribonuclease inhibitor, and 1 μM of reverse primer targeting the sequence downstream to 18S-U116, with either 10 μM or 1 mM 2′-deoxynucleoside 5′-triphosphates (dNTPs) in the reaction. The reaction was incubated for 5 min at 37°C and stopped at 70°C for 15 minutes. Amplification of the cDNA was measured by real-time PCR and the methylation ratio was calculated with the function 2(CTlow/CThigh).
Quantification of cell size
Cells were plated in 96-well plates and pictures were taken from different view fields (Zeiss AxioVert.A1, Zeiss AxioCamMRm, objective 40×). Absolute cell size was measured using ImageJ. Relative cell size was analyzed with flow cytometry using the forward scatter FSC-H.
O-propargyl-puromycin (OP-Puro) incorporation assay
Synthesis of nascent polypeptide chains was measured using an OP-Puro incorporation assay described previously by Liu et al.21 Cells were incubated for 1 hour in culture medium containing 50 μM OP-Puro. Afterward, cells were washed and fixed in 1% paraformaldehyde for 15 minutes. Cells were permeabilized with 0.1% Saponin (MilliporeSigma) in phosphate-buffered saline containing 3% FBS. Click-iT Cell Reaction Buffer Kit (Thermo Fisher Scientific) and azide conjugated to Alexa Fluor 647 or Cy5.5 (Jena Bioscience) were used to perform the azide alkyne cycloaddition. After incubation, cells were washed and the OP-Puro fluorescence was measured using flow cytometry.
Western blot analysis
Cells were lysed in Pierce IP lysis buffer for 30 minutes on ice. Protein extracts were used for gel electrophoresis and then blotted to a nitrocellulose membrane. The membrane was stained with Ponceau S solution and RPL23A antibody (Abcam 157710).
Nascent proteomics
Nascent proteomics was performed as previously described.22 For detailed information, see supplemental Methods.
GO and GSEA
The normalized data from nascent proteomics were subject to Gene Ontology (GO) enrichment23 and gene set enrichment analysis (GSEA).24 For GSEA analysis, log2 ratio data were submitted as a ranked table to the GSEA Preranked algorithm using database v6.2. We tested hallmark gene sets, curated gene sets, and GO gene sets. Results were filtered by false discovery rate value q < 0.01. For GO analysis, 2 unranked lists against either upregulated or downregulated genes (adjusted P < .05) were uploaded to GOrilla.
Results
Design of a CRISPR library to target the human snoRNAnome
To identify snoRNAs crucial for survival of AML cells, we designed a snoRNA-focused CRISPR-Cas9 library with 1559 different sgRNAs targeting all human snoRNAs and snoRNA host genes (supplemental Table 2 and supplemental Figure 1A). The gRNAs were designed to have high on-target and low off-target effect using the Off-spotter gRNA Design Tool.25 Depending on the snoRNA length, we designed 1 to 4 sgRNAs for each snoRNA as well as 4 to 5 sgRNAs that targeted the corresponding host genes. Of note, we included 16 sgRNAs targeting essential genes and 10 nontargeting control sgRNAs.
Four different leukemia cell lines (Kasumi-1, MV4-11, HL60, and U937) were transduced with the snoRNA lentiviral library. The cells were harvested on day 1, day 5, and day 9 for genomic DNA isolation. The relative frequency of each sgRNA in the population was determined by deep sequencing of the gRNA coding sequences (Figure 1A).
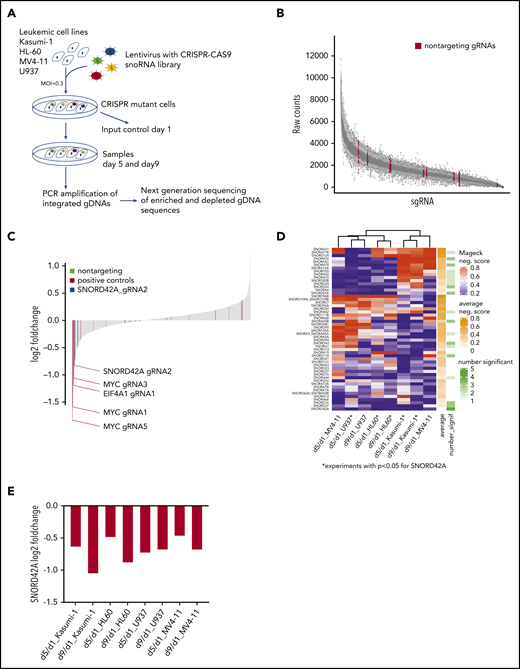
Focused CRISPR-Cas9 screen identifies SNORD42A as a growth regulator for leukemia cells. (A) Experimental design of the CRISPR-Cas9 snoRNA screen. Leukemic cells were infected with the designed CRISPR-Cas9 snoRNA library. Samples were taken at day 1, 5, and 9. The relative frequency of each gRNA was determined by deep sequencing. (B) Number of raw counts for each sgRNA included in the screen. More than 99% of all sgRNAs were detected at day 1 in the analyzed cells. (C) Fold changes of all sgRNAs from day 9 to day 1 as mean from all experiments. The blue bar shows the ratio of SNORD42A gRNA2 (log2 fold change = −0.83). Positive controls are sgRNAs targeting essential genes (c-MYC, EIF4A1, and RUNX1). (D) Clustering of snoRNAs (n = 52) that had a significant (P < .05) negative MAGeCK score in at least on condition (day 5 to day 1 or day 9 to day 1) in 1 cell line. For these snoRNAs, the heatmap shows the negative MAGeCK score from day 5 to day 1 and from day 9 to day 1 for each cell line. *P < .05 for SNORD42A. (E) Changes of SNORD42A gRNA2 as mean of 2 replicates from day 5 to day 1 and from day 9 to day 1 in all cell lines.
Focused CRISPR-Cas9 screen identifies SNORD42A as a growth regulator for leukemia cells. (A) Experimental design of the CRISPR-Cas9 snoRNA screen. Leukemic cells were infected with the designed CRISPR-Cas9 snoRNA library. Samples were taken at day 1, 5, and 9. The relative frequency of each gRNA was determined by deep sequencing. (B) Number of raw counts for each sgRNA included in the screen. More than 99% of all sgRNAs were detected at day 1 in the analyzed cells. (C) Fold changes of all sgRNAs from day 9 to day 1 as mean from all experiments. The blue bar shows the ratio of SNORD42A gRNA2 (log2 fold change = −0.83). Positive controls are sgRNAs targeting essential genes (c-MYC, EIF4A1, and RUNX1). (D) Clustering of snoRNAs (n = 52) that had a significant (P < .05) negative MAGeCK score in at least on condition (day 5 to day 1 or day 9 to day 1) in 1 cell line. For these snoRNAs, the heatmap shows the negative MAGeCK score from day 5 to day 1 and from day 9 to day 1 for each cell line. *P < .05 for SNORD42A. (E) Changes of SNORD42A gRNA2 as mean of 2 replicates from day 5 to day 1 and from day 9 to day 1 in all cell lines.
A focused snoRNA screen identifies SNORD42A as important for growth of leukemic cells
More than 99% of all designed sgRNAs sequences were captured at the initial time point (Figure 1B). High spearman rank correlation was observed between biological replicates indicating the quality and reliability of our screen (supplemental Figure 1B). Global fold-change distribution as mean of all sgRNAs from day 1 to day 9 of all experiments showed that non-targeting sgRNAs did not impact on growth of leukemic cells (log2 fold-change = −0.19 to 0.36). Overall, 8 out of 16 sgRNAs targeting essential genes were negatively selected (log2 fold-change <−0.35). The vast majority of sgRNAs designed for this screen neither enhanced nor reduced growth of leukemia cells. Thus, 83% of all sequenced sgRNAs showed a log2 fold-change of −0.19 to 0.36 from day 1 to day 9 (Figure 1C). This might be due to the fact that the cells were grown in log phase in liquid culture. Accordingly, only sgRNAs with dominant effects on cell proliferation were negatively selected.
We used MAGeCK,16 a previous described tool for analyzing genome wide CRISPR-Cas9 screens, to identify the most relevant snoRNAs. In a first step, we compared day 1 from all samples against day 5 (supplemental Table 3) and day 9 (supplemental Table 4) from all samples. Across all experiments, c-MYC was ranked first as a positive control from day 1 to day 5 and from day 1 to day 9. At the top of the list were 2 genes (FBL and NOP58) that constitute essential components of C/D box snoRNPs. FBL is the catalyzing enzyme for 2′-O-methylation of rRNA. This finding is in line with an important role of C/D box snoRNAs in leukemia. Careful examination of the snoRNAnome data with the MAGeCK algorithm was used to identify relevant snoRNAs. SNORD42A was identified as the highest ranked candidate for affecting proliferation of leukemia cells.
Next, we conducted cell line–specific analyses comparing day 1 against day 5 or day 9. This approach identified 52 snoRNAs with a significantly negative MAGeCK score in ≥1 cell line in 1 condition. SNORD42A was the sole snoRNA that was significantly depleted in 5 out of 8 conditions, and SNORD42A showed the lowest average MAGeCK score of all snoRNAs (Figure 1D). SNORD42A showed a negative MAGeCK score in HL60, U937, and Kasumi-1 cell lines comparing day 5 with day 1 (supplemental Figure 1C) and in addition in HL60 and Kasumi-1 comparing day 9 with day 1. Among the different experiments, SNORD42A emerged as the snoRNA to be most consistently depleted in the knockout screens, suggesting an important function in leukemia cells. However, individual CRISPR-Cas9 knockout of SNORD42A with both sgRNAs from the screen revealed that only SNORD42A_gRNA2 induced genomic mutations in the SNORD42A gene. Individual consideration of SNORD42A_gRNA2 indicated consistent depletion both from day 1 to day 5 and from day 1 to day 9 with a log -fold change of approximately −0.5 to −1 (Figure 1E; supplemental Figure 2).
Primary AML blasts express high levels of SNORD42A
We analyzed snoRNA expression patterns in 63 AML patients at the time of diagnosis treated within a recently conducted clinical trial (AML AZA trial26 ). SNORD42A was one of the most highly expressed snoRNAs in the entire patient cohort (Figure 2A). Next, patients were divided into a high and a low expressing SNORD42A group by using the median of SNORD42A expression. Patients with a higher expression of SNORD42A also showed a higher percentage of AML blasts in bone marrow (Figure 2B) and a trend to higher blast counts in peripheral blood (Figure 2C). The number of blasts in bone marrow correlated (r = +0.28) with SNORD42A expression (Figure 2D). Further, patients with an intermediate molecular risk showed significantly higher expression of SNORD42A than patients with a good molecular risk (Figure 2E). We also compared SNORD42A expression in AML to healthy hematopoietic cell types by quantitative real-time RT-PCR. SNORD42A was expressed at higher levels in AML compared with the other cell types (Figure 2F). In line with the result of our CRISPR-Cas9 snoRNA screen, these data hinted at a functional role of SNORD42A in AML cells.
![Expression of SNORD42A in AML patient samples. (A) SnoRNA expression in 63 AML samples at the time of diagnosis in reads per million (RPM). SnoRNAs were ranked by median expression. SNORD42A ranked among the highest expressed snoRNA in this patient cohort. (B) Patient samples were split into high- and low-expressing SNORD42A groups using the median. Percentage of bone marrow blasts in each group is shown (mean ± standard deviation [SD], P = .012, Student t test). (C) Percentage of blasts in peripheral blood in SNORD42A high- and low-expressing AML patients. Data are shown as mean ± SD; P = .08, Student t test. (D) Correlation between percentage blasts in the bone marrow and expression of SNORD42A in the AML samples (Spearman correlation r = +0.28, P = .029). (E) Expression in reads per million of SNORD42A in patients with good and intermediate molecular risk. Data are shown as mean ± SD; P = .0112, Student t test. (F) SNORD42A expression in AML and healthy hematopoietic cell populations. In total, we measured 9 AML, 5 CD34+, 5 monocyte, and 5 granulocyte samples. Data were normalized to the mean of cord blood CD34+ cells using 5S rRNA as an internal control, and the median levels are indicated.](https://ash.silverchair-cdn.com/ash/content_public/journal/blood/135/23/10.1182_blood.2019004121/2/m_bloodbld2019004121f2.png?Expires=1769717092&Signature=wnvbFh60qGp1EFn5G0I~vGj7gLj-Grng2CaraOWcxrAPeaq~mLq9Q3wwQdWSmArdeJNr4BLq8ewW0OHe5964R~fMs2djFbo1eSwimS8LYE4s3bDEcQSbtAVT-mVSupQyWmFrbf4tUlV4I08BSuvkGgeVtG-P6-DzEFh~-StDY8iWYEfRiKtoIHFMVFQoOB4W5gVHliR97QBQRE5H-40xXsw5cTLb2IfbFH1-MseReUzCTk1~vxTKCW~OE7eOeUBfmKuhVoyavHKI~cY1XeOWM3Cisko7TfWrBNaOARKC5-o7QqLGakb-lWhTVGwQxIW9N83bRXq0yVXoImWwXSIqYw__&Key-Pair-Id=APKAIE5G5CRDK6RD3PGA)
Expression of SNORD42A in AML patient samples. (A) SnoRNA expression in 63 AML samples at the time of diagnosis in reads per million (RPM). SnoRNAs were ranked by median expression. SNORD42A ranked among the highest expressed snoRNA in this patient cohort. (B) Patient samples were split into high- and low-expressing SNORD42A groups using the median. Percentage of bone marrow blasts in each group is shown (mean ± standard deviation [SD], P = .012, Student t test). (C) Percentage of blasts in peripheral blood in SNORD42A high- and low-expressing AML patients. Data are shown as mean ± SD; P = .08, Student t test. (D) Correlation between percentage blasts in the bone marrow and expression of SNORD42A in the AML samples (Spearman correlation r = +0.28, P = .029). (E) Expression in reads per million of SNORD42A in patients with good and intermediate molecular risk. Data are shown as mean ± SD; P = .0112, Student t test. (F) SNORD42A expression in AML and healthy hematopoietic cell populations. In total, we measured 9 AML, 5 CD34+, 5 monocyte, and 5 granulocyte samples. Data were normalized to the mean of cord blood CD34+ cells using 5S rRNA as an internal control, and the median levels are indicated.
Expression of SNORD42A in AML patient samples. (A) SnoRNA expression in 63 AML samples at the time of diagnosis in reads per million (RPM). SnoRNAs were ranked by median expression. SNORD42A ranked among the highest expressed snoRNA in this patient cohort. (B) Patient samples were split into high- and low-expressing SNORD42A groups using the median. Percentage of bone marrow blasts in each group is shown (mean ± standard deviation [SD], P = .012, Student t test). (C) Percentage of blasts in peripheral blood in SNORD42A high- and low-expressing AML patients. Data are shown as mean ± SD; P = .08, Student t test. (D) Correlation between percentage blasts in the bone marrow and expression of SNORD42A in the AML samples (Spearman correlation r = +0.28, P = .029). (E) Expression in reads per million of SNORD42A in patients with good and intermediate molecular risk. Data are shown as mean ± SD; P = .0112, Student t test. (F) SNORD42A expression in AML and healthy hematopoietic cell populations. In total, we measured 9 AML, 5 CD34+, 5 monocyte, and 5 granulocyte samples. Data were normalized to the mean of cord blood CD34+ cells using 5S rRNA as an internal control, and the median levels are indicated.
SNORD42A deficiency inhibits cell proliferation and colony-forming ability
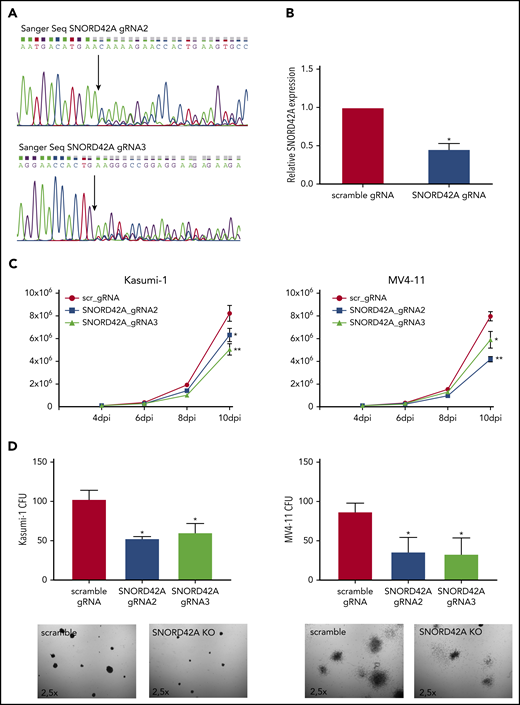
We generated independent SNORD42A locus sgRNAs for validation. SNORD42A and SNORD42B target the same rRNA site. The CRISPR-Cas9 knockout of SNORD42A did not affect the genomic locus of SNOR42B due to different genomic sequences (supplemental Figure 3A). Two out of 3 sgRNAs successfully targeted the SNORD42A genomic locus (Figure 3A). Quantification of snoRNA expression via quantitative RT-PCR showed reduced expression of SNORD42A in bulk knockout cells (Figure 3B). The effect of SNORD42A knockout on leukemia cells was examined in proliferation assays in liquid culture as well as in clonogenic growth assays. Proliferation of MV4-11 and Kasumi-1 cells decreased after SNORD42A knockdown (Figure 3C). Of note, SNORD42A knockout was not immediately lethal, but the functional effects became apparent over time. In addition, SNORD42A knockout inhibited colony-formation capacity in all tested AML cells (Figure 3D; supplemental Figure 3B-C).

Knockout of SNORD42A inhibits cell proliferation and colony-forming ability. (A) Three gRNAs were used for a single knockout of SNORD42A. Sanger sequencing confirmed genomic mutations for 2 out of the 3 gRNAs tested. (B) Relative expression of SNORD42A in Kasumi-1 cells. RT-PCR was performed with a mixed pool of cells with either CRISPR-Cas9 SNORD42A knockout or scrambled control. Data are shown as mean ± SD from 3 biological replicates. *P < .05, Student t test. (C) Proliferation assay from control and SNORD42A knockout cells in Kasumi-1 and MV4-11 cells. Data are shown as mean ± SD from 3 experiments. *P < .05, **P < .01, Student t test. dpi, days postinfection. (D) Colony-formation assay from control and SNORD42A knockout cells in Kasumi-1 and MV4-11 cells. 300 cells were seeded in methylcellulose. Only colonies with ≥50 cells were counted as colony (microscope: Zeiss AxioVert.A1, objective 2.5×; camera: Zeiss AxiocamMRm). Data are shown as mean ± SD from 3 biological replicates. *P < .05, **P < .01, Student t test.
Knockout of SNORD42A inhibits cell proliferation and colony-forming ability. (A) Three gRNAs were used for a single knockout of SNORD42A. Sanger sequencing confirmed genomic mutations for 2 out of the 3 gRNAs tested. (B) Relative expression of SNORD42A in Kasumi-1 cells. RT-PCR was performed with a mixed pool of cells with either CRISPR-Cas9 SNORD42A knockout or scrambled control. Data are shown as mean ± SD from 3 biological replicates. *P < .05, Student t test. (C) Proliferation assay from control and SNORD42A knockout cells in Kasumi-1 and MV4-11 cells. Data are shown as mean ± SD from 3 experiments. *P < .05, **P < .01, Student t test. dpi, days postinfection. (D) Colony-formation assay from control and SNORD42A knockout cells in Kasumi-1 and MV4-11 cells. 300 cells were seeded in methylcellulose. Only colonies with ≥50 cells were counted as colony (microscope: Zeiss AxioVert.A1, objective 2.5×; camera: Zeiss AxiocamMRm). Data are shown as mean ± SD from 3 biological replicates. *P < .05, **P < .01, Student t test.
Knockout of SNORD42A reduces the 2′-O-methylation level of U116
We generated SNORD42A knockout and control single clones (supplemental Figure 4). Each clone showed compound heterozygous mutations with different indel sizes (supplemental Figure 5). SNORD42A is predicted to mediate 2′-O-methylation of 18S rRNA at U116.27 We thus analyzed rRNA 2′-O-methylation in 3 SNORD42A-deficient and 3 control Kasumi-1 single clones by performing RiboMethSeq.18,19 The 18S-U116 was recently identified as a highly methylated rRNA site in human HeLa and HCT116 cancer cell lines.28,29 High levels of 2′-O-methylation at U116 were found in Kasumi-1 cells, but U116 2′-O-methylation was reduced in SNORD42A-deficient cells by >10%. Of note, SNORD42A knockout did not affect other rRNA 2′-O-methylation sites, indicating specificity (Figure 4A). We validated the 2′-O-methylation of 18S-U116 rRNA using an approach based on RT with limiting dNTP concentration (Figure 4B).20 We detected similar amplification between SNORD42A knockout and control cells in the presence of high levels of dNTPs. In contrast, low dNTP concentrations led to differences in amplification as an indication for the presence or absence of 2′-O-methylation (Figure 4C). Kasumi-1 clones bearing a SNORD42A knockout exhibited reduced 2′-O-methylation at 18S-U116 (Figure 4D). The clones were impaired in colony formation (Figure 4E). Further, a second set of single clones also showed reduced cell proliferation (supplemental Figure 3D) and clonogenic capacity (supplemental Figure 3E). Of note, colony-forming potential closely correlated with methylation levels (r = +0.80, P = .003) (Figure 4F).
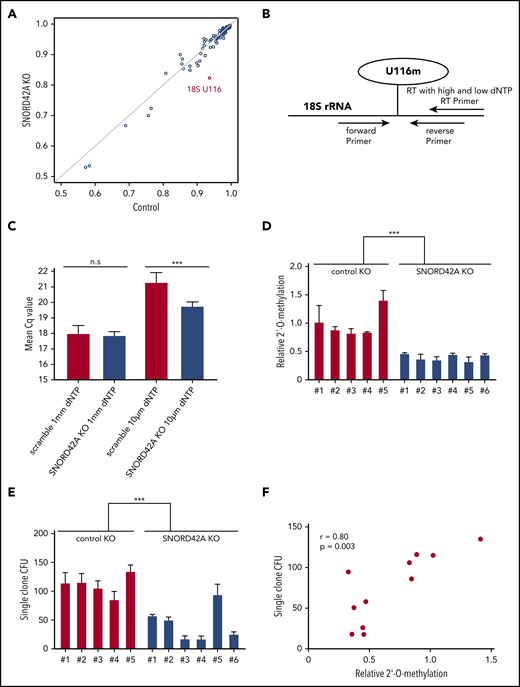
Knockout of SNORD42A reduces the 2′-O-methylation level of U116. (A) The 2′-O-methylation at different rRNA sites in 2 Kasumi-1 SNORD42A knockout (KO; vertical axis) and 3 control (horizontal axis) single clones is indicated. (B) Diagram for analysis of 2′-O-methylation with RT-PCR and different dNTP concentrations. (C) Mean Cq values for high and low dNTP concentrations in the 5 Kasumi-1 SNORD42A knockout and 6 control single clones. Data are shown as mean ± SD; n.s, not significant, ***P < .001, Student t test. (D) Relative 2′-O-methylation at 18S-U116 in 5 control and 6 SNORD42A knockout Kasumi-1 single clones. The data were normalized to the mean of the control. ***P < .001, Student t test. (E) Colony number formed by the same single clones that were used for 2′-O-methylation analysis in Figure 3D. Three hundred cells were seeded in methylcellulose. Data are shown as mean ± SD from 3 replicates, ***P < .001, Student t test. (F) Correlation between the number of colonies forming units and relative 2′-O-methylation in the single clones. Pearson correlation r = +0.80, P = .003. CFU, colony-forming unit.
Knockout of SNORD42A reduces the 2′-O-methylation level of U116. (A) The 2′-O-methylation at different rRNA sites in 2 Kasumi-1 SNORD42A knockout (KO; vertical axis) and 3 control (horizontal axis) single clones is indicated. (B) Diagram for analysis of 2′-O-methylation with RT-PCR and different dNTP concentrations. (C) Mean Cq values for high and low dNTP concentrations in the 5 Kasumi-1 SNORD42A knockout and 6 control single clones. Data are shown as mean ± SD; n.s, not significant, ***P < .001, Student t test. (D) Relative 2′-O-methylation at 18S-U116 in 5 control and 6 SNORD42A knockout Kasumi-1 single clones. The data were normalized to the mean of the control. ***P < .001, Student t test. (E) Colony number formed by the same single clones that were used for 2′-O-methylation analysis in Figure 3D. Three hundred cells were seeded in methylcellulose. Data are shown as mean ± SD from 3 replicates, ***P < .001, Student t test. (F) Correlation between the number of colonies forming units and relative 2′-O-methylation in the single clones. Pearson correlation r = +0.80, P = .003. CFU, colony-forming unit.
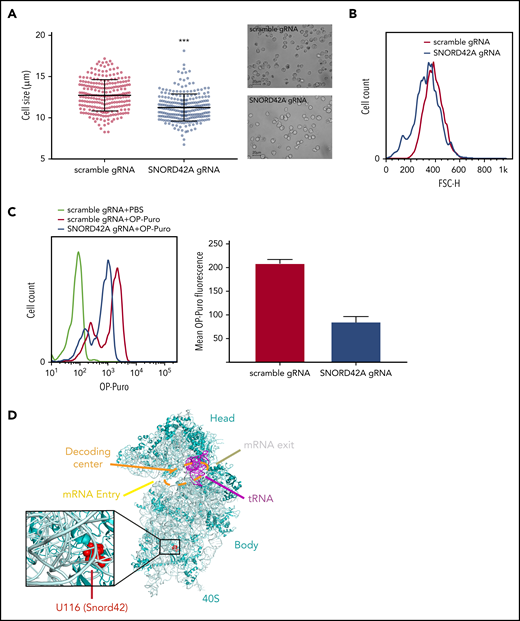
Ribosome activity depends on U116 2′-O-methylation of 18S rRNA
We observed reduced cell size upon SNORD42A deficiency (Figure 5A). This finding was confirmed by flow cytometry (Figure 5B). Cell cycle analysis showed no difference between SNORD42A knockout and control cells (data not shown). As we and others reported before, posttranscriptional modification of rRNA can affect translation.13,30,31 We thus analyzed overall protein synthesis using an OP-Puro incorporation assay.21 Protein translation was decreased in SNORD42A knockout cells (Figure 5C). This indicates that ribosomal 2′-O-methylation at the 18S-U116 impacts on maintenance of protein synthesis. We also analyzed the location of 18S-U116 in the ribosome. Interestingly, 18S-U116 is located in a highly structured region of 40S, but not in the decoding center or messenger RNA (mRNA) entry/exit channel. This location suggests that methylation of 18S-U116 impacts global 3D structure of the ribosome rather than mRNA access or tRNA interaction (Figure 5D).32

Knockout of SNORD42A reduces cell size and synthesis of nascent polypeptide chains. (A) Mean diameter of SNORD42A knockout (n = 245) and control Kasumi-1 cells (n = 235) (microscope: Zeiss AxioVert.A1, objective 40×; camera: Zeiss AxiocamMRm). Data are shown as mean ± SD; ***P < .001, Student t test. (B) Forward scatter size fluorescence-activated cell sorting histogram of SNORD42A knockout and control Kasumi-1 cells. (C) Fluorescence-activated cell sorting histogram of OP incorporation in SNORD42A knockout and control Kasumi-1 cells and mean intensity of OP-Puro fluorescence in SNORD42A knockout and control Kasumi-1 cells (n = 2 measurements from independent infections). (D) Structure of the 40S ribosome indicating the SNORD42A methylation site U116 in the 40S ribosomal unit (Protein Data Bank accession number 4UG0).
Knockout of SNORD42A reduces cell size and synthesis of nascent polypeptide chains. (A) Mean diameter of SNORD42A knockout (n = 245) and control Kasumi-1 cells (n = 235) (microscope: Zeiss AxioVert.A1, objective 40×; camera: Zeiss AxiocamMRm). Data are shown as mean ± SD; ***P < .001, Student t test. (B) Forward scatter size fluorescence-activated cell sorting histogram of SNORD42A knockout and control Kasumi-1 cells. (C) Fluorescence-activated cell sorting histogram of OP incorporation in SNORD42A knockout and control Kasumi-1 cells and mean intensity of OP-Puro fluorescence in SNORD42A knockout and control Kasumi-1 cells (n = 2 measurements from independent infections). (D) Structure of the 40S ribosome indicating the SNORD42A methylation site U116 in the 40S ribosomal unit (Protein Data Bank accession number 4UG0).
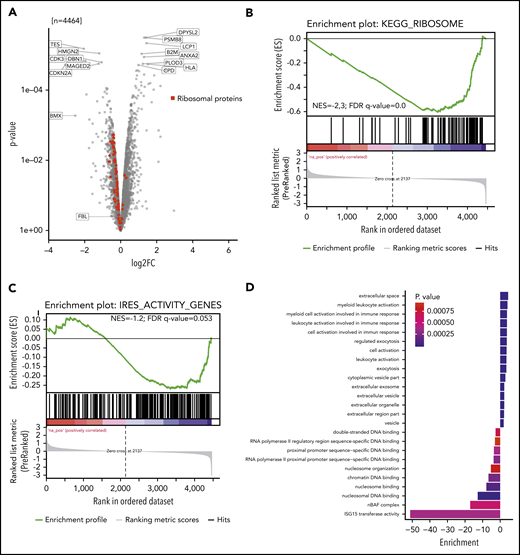
Nascent proteomics reveals 18S-U116 2′-O-methylation dependent protein translation
We investigated whether reduced 2′-O-methylation at 18S-U116 altered translation of specific proteins. Two single knockout clones vs 2 control clones were analyzed for newly synthesized proteins using nascent proteomics. Interestingly, we noticed decreased production of several individual proteins but also increased translation for other proteins (Figure 6A). GSEA (supplemental Figure 6A) revealed that ribosomal proteins were less translated (Figure 6B; supplemental Figure 6B). Other proteins, such as proteins of the endoplasmatic reticulum or lysosome, were more actively translated (supplemental Figure 6A). These findings indicate that loss of 2′-O-methylation at 18S-U116 specifically inhibits synthesis of the translational machinery. Thus, U116 constitutes a determinant and regulator of ribosome translation and biogenesis. The decreased synthesis of highly abundant ribosomal protein translation might also explain the overall decreased protein translation, as indicated by the OP-Puro incorporation.

Nascent proteome analysis reveals SNORD42A-dependent protein translation. (A) The volcano plot indicates the log-fold change (log2FC; horizontal axis) and P value (vertical axis) from nascent proteomics in SNORD42A knockout and control single clones. (B) GSEA demonstrated that most ribosomal proteins are depleted following a SNORD42A knockout. FDR, false discovery rate; NES, normalized enrichment score. (C) GSEA of genes with known IRES activity. (D) The graph shows the GO enrichment analysis.
Nascent proteome analysis reveals SNORD42A-dependent protein translation. (A) The volcano plot indicates the log-fold change (log2FC; horizontal axis) and P value (vertical axis) from nascent proteomics in SNORD42A knockout and control single clones. (B) GSEA demonstrated that most ribosomal proteins are depleted following a SNORD42A knockout. FDR, false discovery rate; NES, normalized enrichment score. (C) GSEA of genes with known IRES activity. (D) The graph shows the GO enrichment analysis.
Of note, we did not see a change in protein levels of FBL, which fits well with our observation that 2′-O-methylation was only reduced at 18S-U116 (Figure 6A). Further, the SNORD42A host gene RPL23A was altered in translation rate to a similar extent as all other ribosomal proteins by the knockout of SNORD42A (supplemental Figure 6B), suggesting that knockout did not damage the host gene mRNA processing. In line, we could not detect a significant reduction of RPL23a protein in SNORD42A knockout cells with western blot analysis (supplemental Figure 6C).
Proteins translated from an internal ribosome entry site (IRES) were less translated (normalized enrichment score = −1.2; false discovery rate q = 0.053) (Figure 6C). Overall, 8 ribosomal proteins are known to have an IRES activity.33 Interestingly, 5 out of these were among the 11 most downregulated ribosomal proteins (supplemental Figure 6B). The reported active 18S rRNA region that facilitates IRES-dependent expression ranges from nucleotides 812 to 1233.33 Even though U116 is not directly located in this region, our data link 2′-O-methylation of 18S-U116 to IRES activity.
GO_ENDOPLASMIC_RETICULUM and KEGG_LYSOSOME gene set proteins showed increased translation. Moreover, ISG15 transferase activity and nBAF complex GO terms were found to be downregulated, while myeloid leukocyte activation and exocytosis were upregulated, pointing at differentiation of cells (Figure 6D). In addition, cell cycle effector proteins such as CDK3 and CDKN2A were downregulated.
Discussion
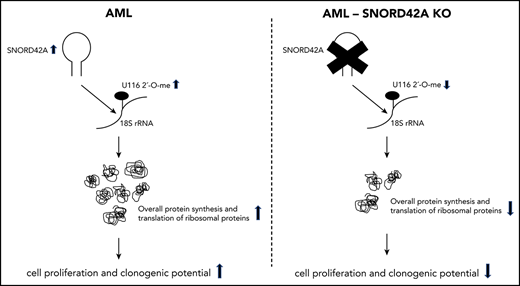
Noncoding RNAs are emerging as crucial determinants in cancer. In the current study, we identified SNORD42A as an essential enabler for leukemia cell proliferation. SNORD42A functions depended on altered 2′-O-methylation of a single rRNA site. Loss of SNORD42A with decreased 2′-O-methylation of 18S-U116 decreased and increased translation of distinct sets of genes. Importantly, 2′-O-methylation of 18S-U116 was relevant for translation of multiple ribosomal proteins.
Several hundred snoRNAs are encoded in the human genome, but the functional relevance and snoRNA functions remain mostly unknown. Recently, we discovered that self-renewal in t(8;21) leukemia depends on expression of AES.13,34 Mechanistically, AES associated with DDX21 and the C/D box snoRNP complex to stabilize and increase expression of multiple C/D box snoRNAs. Intriguingly, loss of AES (and of multiple snoRNAs) did not lead to cell death since oncogene transduced cells were found in transplanted mice for ≤4 months without causing leukemia. These findings suggested that snoRNAs and the downstream mechanisms might impact on critical steps in leukemogenesis. This hypothesis is supported by a recent publication that showed nucleophosmin 1 to bind snoRNA and directly regulate 2′-O-methylation at several positions of the rRNA.35 Accordingly, 2′-O-methylation and other epitranscriptomics modifications of ribosomal rRNA are implicated in leukemogenesis. The RNA-binding protein FMRP has also been shown to bind snoRNAs and regulate 2′-O-methylation at specific positions.36 Although SNORD42A is bound by nucleophosmin 1 and FMRP, both proteins did not affect methylation at 18S-U116. Together with our data, these findings suggest complex levels of translation plasticity in normal and cancer cells.
Along these lines, there are a few leads in the literature that link ribosomal function with leukemogenesis. Activation of polymerase I occurs in hematological neoplasias and solid tumors. Polymerase I increases transcription of ribosomal DNA and accordingly increases ribosomes.37 Patients with rare ribosomopathies, such as Diamond-Blackfan syndrome, harbor mutations in different ribosomal protein genes and experience an increased cancer incidence.38 Mutations in RPL5 and RPL10 were found in almost 10% of patients with pediatric T-cell acute lymphoblastic leukemia.39 Hemizygous deletions of ribosomal protein genes are common in different types of cancer. It was shown that these deletions activate p53 and are underrepresented in p53 inactive tumors.40 p53 itself can influence ribosomal modifications by direct binding to the methyltransferase FBLn.20 In line with this observation, Sharma et al could show rRNA 2′-O-methylation sites that are high methylated in the absence of p53.41
IRES-dependent translation has been reported to modulate translation efficiency in concert with 2′-O-methylation.28 Interestingly, the effects on ribosomal proteins might also be explained by this role for 2′-O-methylation of U116. It was shown that knockdown of single ribosomal proteins could reduce protein levels of a whole set of other ribosomal proteins.42 Of note, the reported active region for IRES-dependent translation does not overlap with the SNORD42A target site 18S-U116.33
As shown in Figure 5A, 18S-U116 is located in the highly structured region of 40S body rather than in the decoding center.32 Therefore, we hypothesize that the 2′-O-methylation 18S-U116 can induce a conformational switch of the ribosome, which changes the preference for translation. These findings emphasize that 2′-O-methylation impacts global protein translation by fine-tuning the synthesis of the translational machinery.
Taken together, we identified SNORD42A as an important snoRNA for proliferation of leukemic cells. Reduction of SNORD42A expression or reduction of 2′-O-methylation at its known 18S-U116 rRNA target site might constitute a potential therapeutic target in AML.
The RiboMethSeq data reported in this article have been deposited in the Gene Expression Omnibus database (accession number GSE140355).
The online version of this article contains a data supplement.
The publication costs of this article were defrayed in part by page charge payment. Therefore, and solely to indicate this fact, this article is hereby marked “advertisement” in accordance with 18 USC section 1734.
Acknowledgments
C.M.-T. is supported by the German Research Foundation (grants MU1328/15-1 and MU1328/18-1), Deutsche Krebshilfe (grant 70112974), Deutsche José-Carreras-Leukämie-Stiftung (grant DJCLS 22 R/2017), and the Wilhelm Sander-Stiftung (grant 2017.004.1). C. Pauli was supported by a Mildred-Scheel grant of the Deutsche Krebshilfe (70112068). F.Z. is supported by the German Research Foundation (grant ZH831/1-1). C. Pabst was further supported by German Cancer Aid (grant 70111531). The authors gratefully acknowledge the data storage service SDS@hd supported by the Ministry of Science, Research and the Arts Baden-Württemberg, and the German Research Foundation through grant INST 35/1314-1 FUGG.
Authorship
Contribution: C. Pauli and Y.L. performed the experiments, analyzed the data, and wrote the manuscript; C.R. analyzed the CRISPR-Cas9 screen; C.R., C.W., and M.D. analyzed the RiboMethSeq. F.Z., C.R., D.F., and J.K. performed the nascent proteomics and analyzed the data; F.Z., C.R., C.C., D.G., C. Pabst, L.P.M., and B.E. analyzed results; C.M.-T. designed and conceptualized the overall research, analyzed the data, and wrote the manuscript; and all authors read and approved the final manuscript.
Conflict-of-interest disclosure: The authors declare no competing financial interests.
Correspondence: Carsten Müller-Tidow, Department of Medicine V, Hematology, Oncology and Rheumatology, University of Heidelberg, Im Neuenheimer Feld 410, 69120 Heidelberg, Germany; e-mail: carsten.mueller-tidow@med.uni-heidelberg.de


![Expression of SNORD42A in AML patient samples. (A) SnoRNA expression in 63 AML samples at the time of diagnosis in reads per million (RPM). SnoRNAs were ranked by median expression. SNORD42A ranked among the highest expressed snoRNA in this patient cohort. (B) Patient samples were split into high- and low-expressing SNORD42A groups using the median. Percentage of bone marrow blasts in each group is shown (mean ± standard deviation [SD], P = .012, Student t test). (C) Percentage of blasts in peripheral blood in SNORD42A high- and low-expressing AML patients. Data are shown as mean ± SD; P = .08, Student t test. (D) Correlation between percentage blasts in the bone marrow and expression of SNORD42A in the AML samples (Spearman correlation r = +0.28, P = .029). (E) Expression in reads per million of SNORD42A in patients with good and intermediate molecular risk. Data are shown as mean ± SD; P = .0112, Student t test. (F) SNORD42A expression in AML and healthy hematopoietic cell populations. In total, we measured 9 AML, 5 CD34+, 5 monocyte, and 5 granulocyte samples. Data were normalized to the mean of cord blood CD34+ cells using 5S rRNA as an internal control, and the median levels are indicated.](https://ash.silverchair-cdn.com/ash/content_public/journal/blood/135/23/10.1182_blood.2019004121/2/m_bloodbld2019004121f2.png?Expires=1769717093&Signature=bNfIhkvM3IPPfUve7zIyNENuWdpXrQaRqLBtF7PDUHCTRGuDoyqHDP3noNxMVPk4LzHWM8YZkkk0M0WbC-EzmcvW-BsazCZ8xFYe9jtbgKkehZILLFapsIdgKj6~etaU10JSpDGl4dpcZPcSd-Vsv6PdmzCOphuqBAEdRzmq7QVTascsFw8oxCXn2A0PsX1OfTxi2m97BTao7yrZBQxkxKqps7tjbY9UAWjAuz0aIFrW9XrWPE09RHoygSVoxF5GjtdBX4zFTx69W0~Y-LCo55e1~EyHWrNNpzw5yRlkLMaMXgKSd7p--5zoP-bND6yxIBqlr5-RtRM8eepAQcOcow__&Key-Pair-Id=APKAIE5G5CRDK6RD3PGA)