

Key Points
Slow RBC flow speed and vaso-occlusions trigger an HIF-1α–induced proangiogenic milieu conducive to aberrant vessel growth.
In SCD mice, blood transfusion reverses neoangiogenesis, highlighting the plasticity of the BM vasculature.

Abstract
Sickle cell disease (SCD) is a monogenic red blood cell (RBC) disorder with high morbidity and mortality. Here, we report, for the first time, the impact of SCD on the bone marrow (BM) vascular niche, which is critical for hematopoiesis. In SCD mice, we find a disorganized and structurally abnormal BM vascular network of increased numbers of highly tortuous arterioles occupying the majority of the BM cavity, as well as fragmented sinusoidal vessels filled with aggregates of erythroid and myeloid cells. By in vivo imaging, sickle and control RBCs have significantly slow intravascular flow speeds in sickle cell BM but not in control BM. In sickle cell BM, we find increased reactive oxygen species production in expanded erythroblast populations and elevated levels of HIF-1α. The SCD BM exudate exhibits increased levels of proangiogenic growth factors and soluble vascular cell adhesion molecule-1. Transplantation of SCD mouse BM cells into wild-type mice recapitulates the SCD vascular phenotype. Our data provide a model of SCD BM, in which slow RBC flow and vaso-occlusions further diminish local oxygen availability in the physiologic hypoxic BM cavity. These events trigger a milieu that is conducive to aberrant vessel growth. The distorted neovascular network is completely reversed by a 6-week blood transfusion regimen targeting hemoglobin S to <30%, highlighting the plasticity of the vascular niche. A better insight into the BM microenvironments in SCD might provide opportunities to optimize approaches toward efficient and long-term hematopoietic engraftment in the context of curative therapies.
Introduction
Sickle cell disease (SCD) is characterized by the presence of the pathologic hemoglobin S (HbS), which is caused by a point mutation affecting the β-globin amino acid residue at position 6 encoding a valine instead of a glutamic acid. Epidemiological studies suggest an increasing global burden of SCD between 2010 and 2050.1-3 The main clinical manifestations of SCD are chronic hemolytic anemia and acute vaso-occlusive crises.4 HbS polymerization and the generation of dense red blood cells (RBCs) are key events in the entrapment of RBCs in the microcirculation, followed by the generation of heterothrombi of RBCs and neutrophils and subsequent adhesion to activated vascular endothelial cells.5-7 These events lead to obstruction in the microcirculation and hypoxia-mediated cellular damage,8 which represents a strong proangiogenic stimulus.9-11 Indeed, abnormal angiogenesis in SCD patients has been suggested by moyamoya disease and proliferative vessel formation in the retina.12-20 Moreover, an increase in proangiogenic factors has been reported in peripheral blood (PB) of patients with SCD.16-20
The only curative option for SCD has been allogeneic hematopoietic stem cell (HSC) transplantation; however, major limitations and challenges exist for HSC transplantation in SCD patients.21-24 Similarly, the recent clinical trials using autologous gene-edited HSC transplantation also have uncovered significant challenges in some SCD patients. In this regard, recurrent vaso-occlusive crises suppress osteoblastic lineage cells and activate osteoclasts, promoting sickle cell bone disease.25 Thus, impairment of the bone and osteoblast compartment may compromise the integrity of bone marrow (BM) microenvironments that sustain hematopoiesis.26,27 In previous studies, we have shown that hematopoietic stem and progenitor cells (HSPCs) reside adjacent to different vascular structures, including sinusoids, arteries, and arterioles,28 suggesting the importance of the spatial relationship between endogenous HSPCs and vascular structures. Moreover, multiple laboratories have established the essential role for the vasculature in regulating HSPC homeostasis and lodgement in the BM.29-32
Thus, we queried whether SCD might also affect the vascular microenvironments. To this end, we used two-dimensional (2D) laser-scanning cytometry (LaSC), three-dimensional (3D) whole-mount confocal imaging, and intravital imaging28,33,34 to analyze sinusoidal and arteriolar microenvironments throughout the BM cavity of Townes humanized SCD mice.35 Our studies further examined pathophysiologic features of cellular and molecular components in the BM of SCD. The proposed mechanistic relationship between the findings is discussed.
Methods
Mouse models and study design
Experiments were performed on 2- to 6-month-old sex-matched healthy control (Hbatm1(HBA)TowHbbtm3(HBG1,HBB)Tow [homozygous AA]) mice and humanized Townes SCD (Hbatm1(HBA)TowHbbtm2(HBG1,HBB*)Tow [homozygous SS]) mice (The Jackson Laboratory; stock #013071) bred in the laboratories at the University of Verona and Boston Children’s Hospital.35 Details about the mouse models and study design are reported in supplemental Methods (available on the Blood Web site).
Mouse polymerase chain reaction genotyping
Details can be found in supplemental Methods.
Flow cytometry analysis of BM vascular niche
Single-cell BM suspensions were prepared by crushing and gently grinding the femurs and tibias using a mortar and a pestle in washing buffer (Dulbecco’s phosphate-buffered saline, Ca2+ free, Mg2+ free, 2% fetal bovine serum), followed by hemolysis with ammonium chloride-potassium buffer (Life Technologies). Single-cell spleen suspensions and PB cells harvested by heart bleeding were subjected to flow cytometry staining with specific antibodies, as reported in supplemental Methods.
Colony-forming cell assay
Details can be found in supplemental Methods.
Immunoblot analyses of BM cells and BM exudate
BM cells were isolated from tibia and iliac bones of 8-week-old AA or SS mice. Ten million cells were collected and lysed by ultrasonication for 30 seconds (6 × 5 seconds).36,37 BM exudate was collected and used for immunoblot analyses. Details are reported in supplemental Methods.
Immunofluorescence staining of cryopreserved sections of femurs
Details can be found in supplemental Methods.
In situ solid-phase LaSC analysis
An iCys Research Imaging Cytometer (CompuCyte), with 4 excitation lasers (405, 488, 561, and 633 nm), 4 emission filters (425-455, 500-550, 575-625, 650-nm long pass), and 4 photomultiplier tubes, was used for all LaSC analyses, as previously reported.28,33 Details are described in supplemental Methods (see also supplemental Figures 1 and 5).
Blood cell velocity quantification in BM vasculature
Details are described in supplemental Methods and supplemental Figure 2A.
Results
SCD mice show distinctly abnormal and disorganized BM vasculature
In healthy control (AA) mice, the BM cavity displays organized vascular structures in which (1) nutrient medullary arteries (Sca-1hi large vessels) run along the longitudinal axis in the central part of the BM cavity and subsequently branch into arterioles (Sca-1hi small vessels) at the endosteal region, and (2) endoglin+ sinusoids connected from near the endosteal surface to the draining central sinus in a well-organized fashion (Figure 1A, upper panels). By contrast, in SCD (SS) mice, the arteries and arterioles are highly tortuous and branched, spreading throughout the BM cavity with increased frequencies (Figure 1A, lower panels). In addition, SS BM lacked the draining sinusoidal network, which connects the endosteal region to the central sinus. Additionally, the sinusoids appeared fragmented, diminished, and collapsed with virtual lumens likely due to sickle cell aggregates (Figure 1A, lower panels). The 3D confocal analysis of whole-mount femurs illustrated the defects of vascular structures, involving sinusoids and arterioles in SCD mouse BM compared with healthy controls (Figure 1A; for videos of confocal images in SCD mice see supplemental Videos 1 and 2). The quantification of segmented Sca-1+ volume from 3D reconstructed images by Volocity software shows a significant increase in arteries/arterioles in SCD mice (Figure 1B). In addition, Sca-1+ BM area measured by iCys software from 2D LaSC images confirms the increased arteries/arterioles in male and female SCD mice (Figure 1C; supplemental Figure 1A). A comparison between male and female SCD mice did not show a significant difference in Sca-1+ BM area (Figure 1C), suggesting that the BM arteriolar defect is not sex specific. The BM vascular defect is also associated with a fourfold increase in neovascularized arterioles, as determined by staining of α-smooth muscle actin, a marker for arterioles and arterial walls (Figure 1D). Using LaSC analysis, we quantitated the sinusoid abnormalities by evaluating their lumen size. As shown in Figure 1E, we observed a reduction in sinusoidal lumen size in SS mice, suggesting collapsed sinusoids.
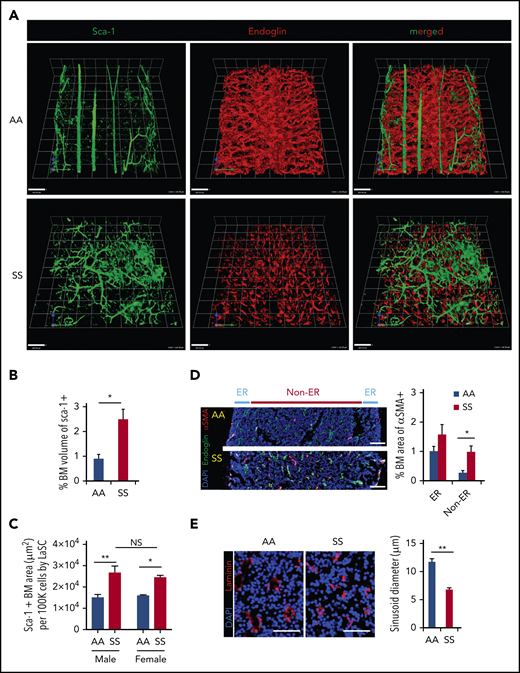
SCD mice show distinctly abnormal and disorganized BM vasculature. (A) Representative 3D reconstructed images of femoral diaphyses from healthy control (AA) and SCD (SS) mice. High-resolution whole-mount confocal images were acquired using a Leica SP8X confocal microscope after staining femurs with artery/arteriole marker Sca-1 and sinusoid marker endoglin. Arteries (Sca-1hi large vessels), arterioles (Sca-1hi small vessels), and sinusoids (endoglin+) are identified based on markers and vessel sizes. Scale bars, 100 μm. (B) Quantification of the percentage of BM volume of segmented Sca-1+ arterioles/arteries was performed using Volocity (PerkinElmer) from 3D reconstructed confocal images, as shown in (A). Percentage of BM volume of Sca-1+ = total volume of Sca-1+/total BM volume × 100; n = 4 mice per group (11-13 weeks old; 2 female mice and 2 male mice). *P < .05, 2-tailed unpaired Student t test. (C) Quantification of Sca-1+ BM area from 2D LaSC images was performed using iCys software (CompuCyte), as shown in supplemental Figure 1A. Sca-1+ BM area (μm2) per 100 000 BM cells = (Sca-1+ event number) × (mean area of Sca-1+ events)/(DAPI+ cell number) × 100 000; n = 4 mice per group (9-16 weeks old). A comparison between male and female SS mice does not show a significant difference. *P < .05, **P < .01, 2-way analysis of variance with Tukey’s multiple-comparisons test. (D) Frozen thin sections (5 μm thickness) of SCD mouse femurs were stained with antibodies against α smooth muscle actin (αSMA) and endoglin, followed by nuclear dye DAPI staining. Neovascularized arterioles were identified by αSMA+ arteriolar pericytes and quantitated by LaSC in the diaphysis of SCD mouse bones costained with endoglin. BM medullary area is divided by endosteal region (ER; BM zone within 100 μm from the endosteal surface) and non-ER. Percentage of BM area of αSMA+ = total area of αSMA+/total BM area × 100, n = 4 mice per group (11-15 weeks old; 2 female mice and 2 male mice). *P < .05, Two-tailed unpaired Student t test with Bonferroni correction for multiple comparisons. Scale bars, 100 μm. (E) The sizes of sinusoid lumens were quantitated by 2D LaSC (iCys by CompuCyte) analysis with laminin marker; n = 4 mice per group (13-15 weeks old; 2 female mice and 2 male mice). Scale bars, 50 μm. All bar graphs show mean + standard error of the mean. **P < .01, 2-tailed unpaired Student t test. NS, not significant.
SCD mice show distinctly abnormal and disorganized BM vasculature. (A) Representative 3D reconstructed images of femoral diaphyses from healthy control (AA) and SCD (SS) mice. High-resolution whole-mount confocal images were acquired using a Leica SP8X confocal microscope after staining femurs with artery/arteriole marker Sca-1 and sinusoid marker endoglin. Arteries (Sca-1hi large vessels), arterioles (Sca-1hi small vessels), and sinusoids (endoglin+) are identified based on markers and vessel sizes. Scale bars, 100 μm. (B) Quantification of the percentage of BM volume of segmented Sca-1+ arterioles/arteries was performed using Volocity (PerkinElmer) from 3D reconstructed confocal images, as shown in (A). Percentage of BM volume of Sca-1+ = total volume of Sca-1+/total BM volume × 100; n = 4 mice per group (11-13 weeks old; 2 female mice and 2 male mice). *P < .05, 2-tailed unpaired Student t test. (C) Quantification of Sca-1+ BM area from 2D LaSC images was performed using iCys software (CompuCyte), as shown in supplemental Figure 1A. Sca-1+ BM area (μm2) per 100 000 BM cells = (Sca-1+ event number) × (mean area of Sca-1+ events)/(DAPI+ cell number) × 100 000; n = 4 mice per group (9-16 weeks old). A comparison between male and female SS mice does not show a significant difference. *P < .05, **P < .01, 2-way analysis of variance with Tukey’s multiple-comparisons test. (D) Frozen thin sections (5 μm thickness) of SCD mouse femurs were stained with antibodies against α smooth muscle actin (αSMA) and endoglin, followed by nuclear dye DAPI staining. Neovascularized arterioles were identified by αSMA+ arteriolar pericytes and quantitated by LaSC in the diaphysis of SCD mouse bones costained with endoglin. BM medullary area is divided by endosteal region (ER; BM zone within 100 μm from the endosteal surface) and non-ER. Percentage of BM area of αSMA+ = total area of αSMA+/total BM area × 100, n = 4 mice per group (11-15 weeks old; 2 female mice and 2 male mice). *P < .05, Two-tailed unpaired Student t test with Bonferroni correction for multiple comparisons. Scale bars, 100 μm. (E) The sizes of sinusoid lumens were quantitated by 2D LaSC (iCys by CompuCyte) analysis with laminin marker; n = 4 mice per group (13-15 weeks old; 2 female mice and 2 male mice). Scale bars, 50 μm. All bar graphs show mean + standard error of the mean. **P < .01, 2-tailed unpaired Student t test. NS, not significant.
In situ generation of RBC aggregates, slow RBC flow speed, and increased cell apoptosis are pathologic features of SCD BM
In SCD BM, the majority of sinusoids were filled with large TER119+ cell clumps (Figure 2A) that were composed of mature erythrocytes (Ter119+ CD71− DAPI−) and nucleated erythroid precursors (Ter119+ CD71+ DAPI+) (Figure 2B). Histopathology by hematoxylin and eosin staining also shows congested RBCs (i.e., RBC aggregates) in the BM (supplemental Figure 1B). Of note, aggregates of erythroid cells and BM Gr-1+ myeloid cells were found intrasinusoidally (similar to those described in the microcirculation of other SCD target organs, such as lung and kidney9,11 ) and in perisinusoidal areas of SCD BM (Figure 2C-D). Using LaSC for quantitation in situ, we found an increase in TUNEL+ apoptotic cells in SCD BM, which likely occurs as a consequence of an unfavorable BM microenvironment (Figure 2E).
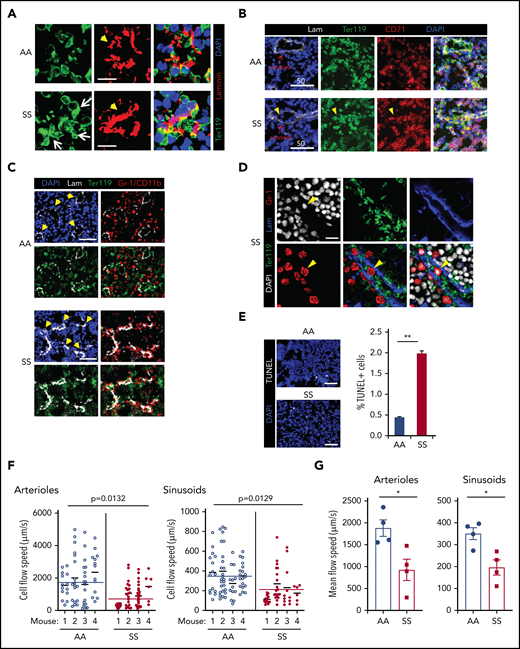
In situ generation of RBC aggregates, slow blood cell flow speed, and increased cell apoptosis are pathologic features of SCD BM. (A) Thirteen- to 15-week-old AA or SS mice were subjected to transcardial perfusion with phosphate-buffered saline, immediately after being euthanized with CO2, to flush nonadherent RBCs in the vasculatures, followed by fixation. Frozen thin sections (5 μm thickness) of SCD mouse femurs were stained with antibodies against Ter119 and laminin, followed by DAPI staining. Confocal microscopy (Leica SP8X) images were processed to show Ter119+ erythrocyte aggregates. Arrows indicate intra- and peri-sinusoidal sickle RBC aggregates. Arrowheads indicate sinusoids identified by vascular marker laminin. Scale bars, 10 μm. (B) Rabbit antibody against CD71 (transferrin receptor) was used to identify immature erythroid cells (Ter119+ CD71+ DAPI+) in confocal analysis (Leica SP8X) after immunofluorescence staining of frozen sections (5 μm thickness) of SCD mouse femurs. Arrowheads indicate aggregates of immature sickle RBC in sinusoids. Scale bars, 50 μm. (C) Gr-1/CD11b+ myeloid cells aggregated with sickle RBCs perisinusoidally in the femoral BM sections of SCD mice were analyzed by LaSC. Arrowheads denote sinusoids. Scale bars, 50 μm. (D) Gr-1+ cells, aggregated with sickle RBCs intrasinusoidally in frozen sections (5 μm thickness) of femoral BM of SCD mice, were analyzed by confocal microscopy (Leica SP8X). Arrowheads denote an intrasinusoidal Gr-1+ myeloid cell. Scale bar, 20 μm. (E) Frozen sections of femurs were stained with a Click-It Plus TUNEL Assay (Life Technologies). TUNEL+ apoptotic cells and DAPI+ BM cells were quantitated by LaSC. Bar graphs are plotted as mean + standard error of the mean (SEM); n = 4 mice per group (13-15 weeks old; 2 female and 2 male mice). Scale bars, 50 μm. **P < .01, Student t test. (F and G) For the flow speed measurement, Rhodamine B-dextran (70 kDa) was injected retro-orbitally, followed by calvarial vasculature recording using confocal intravital microscopy and calculation of endogenous blood cell flow speed (displacement over time) by negative contrast approach using ImageJ, as described previously (see also supplemental Figure 2A).80,81 (F) Flow speed value per cell was plotted as scatter dot plots for each individual mouse, with a mean of individual mouse and pooled total shown as thinner and wider horizontal lines, respectively, by Prism 8 software (GraphPad). Each circle represents an individual RBC. The numbers of cells plotted from each mouse (total 4 mice) were 14, 18, 19, 13 (AA)/ 21, 20, 29, 6 (SS) for arterioles and 15, 26, 13, 19 (AA)/ 14, 19, 11, 6 (SS) for sinusoids. The P values were analyzed by a generalized linear model with a random effect of mouse nested within genotype (n = 4 mice). (G) The average RBC flow speed of each mouse was calculated as 1 data point and represented as dots. Bar graphs depict the mean of mean flow speeds of individual mouse as mean + SEM, n = 4 mice (12-15 weeks old; 2 female mice and 2 male mice). *P < .05, Student t test with Bonferroni correction for multiple comparisons.
In situ generation of RBC aggregates, slow blood cell flow speed, and increased cell apoptosis are pathologic features of SCD BM. (A) Thirteen- to 15-week-old AA or SS mice were subjected to transcardial perfusion with phosphate-buffered saline, immediately after being euthanized with CO2, to flush nonadherent RBCs in the vasculatures, followed by fixation. Frozen thin sections (5 μm thickness) of SCD mouse femurs were stained with antibodies against Ter119 and laminin, followed by DAPI staining. Confocal microscopy (Leica SP8X) images were processed to show Ter119+ erythrocyte aggregates. Arrows indicate intra- and peri-sinusoidal sickle RBC aggregates. Arrowheads indicate sinusoids identified by vascular marker laminin. Scale bars, 10 μm. (B) Rabbit antibody against CD71 (transferrin receptor) was used to identify immature erythroid cells (Ter119+ CD71+ DAPI+) in confocal analysis (Leica SP8X) after immunofluorescence staining of frozen sections (5 μm thickness) of SCD mouse femurs. Arrowheads indicate aggregates of immature sickle RBC in sinusoids. Scale bars, 50 μm. (C) Gr-1/CD11b+ myeloid cells aggregated with sickle RBCs perisinusoidally in the femoral BM sections of SCD mice were analyzed by LaSC. Arrowheads denote sinusoids. Scale bars, 50 μm. (D) Gr-1+ cells, aggregated with sickle RBCs intrasinusoidally in frozen sections (5 μm thickness) of femoral BM of SCD mice, were analyzed by confocal microscopy (Leica SP8X). Arrowheads denote an intrasinusoidal Gr-1+ myeloid cell. Scale bar, 20 μm. (E) Frozen sections of femurs were stained with a Click-It Plus TUNEL Assay (Life Technologies). TUNEL+ apoptotic cells and DAPI+ BM cells were quantitated by LaSC. Bar graphs are plotted as mean + standard error of the mean (SEM); n = 4 mice per group (13-15 weeks old; 2 female and 2 male mice). Scale bars, 50 μm. **P < .01, Student t test. (F and G) For the flow speed measurement, Rhodamine B-dextran (70 kDa) was injected retro-orbitally, followed by calvarial vasculature recording using confocal intravital microscopy and calculation of endogenous blood cell flow speed (displacement over time) by negative contrast approach using ImageJ, as described previously (see also supplemental Figure 2A).80,81 (F) Flow speed value per cell was plotted as scatter dot plots for each individual mouse, with a mean of individual mouse and pooled total shown as thinner and wider horizontal lines, respectively, by Prism 8 software (GraphPad). Each circle represents an individual RBC. The numbers of cells plotted from each mouse (total 4 mice) were 14, 18, 19, 13 (AA)/ 21, 20, 29, 6 (SS) for arterioles and 15, 26, 13, 19 (AA)/ 14, 19, 11, 6 (SS) for sinusoids. The P values were analyzed by a generalized linear model with a random effect of mouse nested within genotype (n = 4 mice). (G) The average RBC flow speed of each mouse was calculated as 1 data point and represented as dots. Bar graphs depict the mean of mean flow speeds of individual mouse as mean + SEM, n = 4 mice (12-15 weeks old; 2 female mice and 2 male mice). *P < .05, Student t test with Bonferroni correction for multiple comparisons.
To understand the impact of the abnormal BM vasculature on blood cell flow speed, we examined the hemodynamics in mouse cranial BM vasculature using intravital microscopy.34 As shown in Figure 2F and G and supplemental Figure 2A, we measured the flow rate of endogenous blood cells identified by negative contrast after injecting Rhodamine B–dextran IV and documented that intravascular blood cells had slower flow speeds in SCD (SS) BM than in control (AA) mice. To test whether the slower blood cell flow rate is related, in part, to the defective vascular structure in SCD mice, we adoptively transferred carboxyfluorescein diacetate succinimidyl ester (CFSE)-labeled wild-type (WT) RBCs (supplemental Videos 3 and 4) and measured their flow rate in SCD mice. The flow speed of CFSE-labeled WT RBCs was significantly slower in SCD BM vasculature than in control mouse BM vasculature (supplemental Figure 2B-C). Next we transferred CFSE-labeled sickle RBCs into WT mice and found that their flow speed was similar to WT RBCs (data not shown).
Expression of HIF-1α and downstream signaling molecules regulating neovascularization is enhanced in SCD BM
Previous studies have shown that BM is a physiologic hypoxic organ.28,38 We hypothesized that the presence of intravascular heterotypic aggregates and slow RBC flow speed in SCD further reduce the availability of oxygen in the BM cavity, promoting expression of HIF-1α. Indeed, a prior study in a rat model of intermittent environmental hypoxia suggested that hypoxia-mediated signaling led to VE-cadherin+ vascular abnormalities.39 Moreover, a hypoxia-triggered proangiogenic environment has been described in the retina of patients with SCD.40 In the BM of SS and AA mice, we assessed the expression of HIF-1α and downstream signaling proangiogenic targets, such as vascular endothelial growth factor (VEGF), angiopoietins, vascular endothelial growth receptor-2 (VEGFR2), and Tie2. First, we uncovered that HIF-1α expression is dramatically increased in the BM of SS mice by LaSC imaging of longitudinal BM sections (Figure 3A-B) and by immunoblotting of BM cell lysates (Figure 3C). The analysis of total BM cell lysates also revealed increased expression of VEGFR2 and Tie2 and an increased phosphorylation status of their common downstream signaling molecule, MAPK/Erk, in SS mice compared with AA mice (Figure 3C). In BM exudates, increased levels of soluble proangiogenic growth factors VEGF-A, angiopoietin-1 (Ang 1), and Ang 2 were detected (Figure 3D). Of note, we also observed marked increases in Ang 1 and Ang 2, but not VEGF-A, in peripheral plasma (supplemental Figure 3).
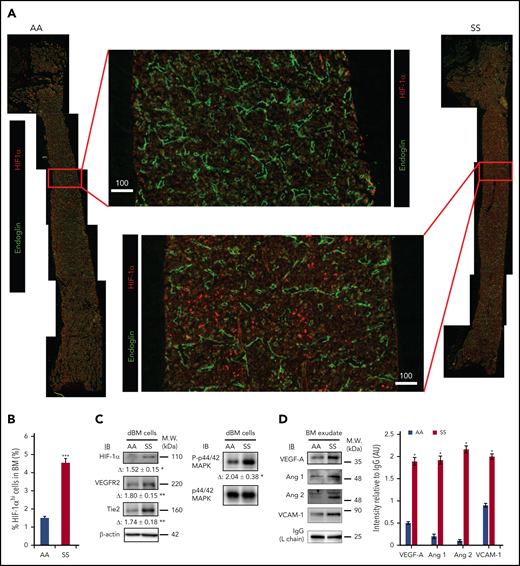
Hypoxia-induced signaling for neovasculogenesis is highly enhanced in SCD mouse BM. (A) Representative 2D images of femoral diaphyses from AA and SS mice created using LaSC. Whole-femoral sections of 12-week-old AA or SS mice were stained with endoglin and HIF-1α, followed by LaSC analysis. Scale bars, 100 μm. (B) DAPI+ HIF-1αhi cells were quantitated by LaSC. The bar graph shows the percentage of HIF-1αhi cells in the BM as mean + standard error of the mean (SEM), n = 4 mice per group (12-15 weeks old; 2 female mice and 2 male mice). (C) Hypoxia-induced signaling was analyzed by western blot, followed by densitometric analysis in the digested BM (dBM) cells from hindlimbs. The proteins in the BM exudates or cell lysates were resolved by 4% to 12% sodium dodecyl sulfate polyacrylamide gel electrophoresis gels, followed by immunoblotting with specific antibodies, as indicated, and β-actin antibody for loading controls. Representative blots are shown. Fold change (Δ) in band intensity of proteins and p44/42 MAPK phosphorylation were normalized to β-actin and p44/42 MAPK protein loading, respectively, and shown as mean ± SEM (n = 4 each; 12-15 weeks old; 2 female mice and 2 male mice). (D) Immunoblot (IB) analysis with specific antibodies against VEGF-A, Ang 1, Ang 2, and VCAM-1 of BM exudates from AA and SS mice (left panel). Immunoglobulin G (IgG) light chain (L chain) was used as a loading control. One representative gel of 6 with similar results is presented. Densitometric analysis of immunoblots is shown as a bar graph (right panel). Results are shown as protein intensity relative to IgG. Ang 2 represents immature and mature Ang 2 forms. Data are presented as mean + SEM (n = 6 from each strain; 12-15 weeks old; 3 female mice and 3 male mice). *P < .05, **P < .01, ***P < .001, Student t test. AU, arbitrary units; M.W., molecular weight.
Hypoxia-induced signaling for neovasculogenesis is highly enhanced in SCD mouse BM. (A) Representative 2D images of femoral diaphyses from AA and SS mice created using LaSC. Whole-femoral sections of 12-week-old AA or SS mice were stained with endoglin and HIF-1α, followed by LaSC analysis. Scale bars, 100 μm. (B) DAPI+ HIF-1αhi cells were quantitated by LaSC. The bar graph shows the percentage of HIF-1αhi cells in the BM as mean + standard error of the mean (SEM), n = 4 mice per group (12-15 weeks old; 2 female mice and 2 male mice). (C) Hypoxia-induced signaling was analyzed by western blot, followed by densitometric analysis in the digested BM (dBM) cells from hindlimbs. The proteins in the BM exudates or cell lysates were resolved by 4% to 12% sodium dodecyl sulfate polyacrylamide gel electrophoresis gels, followed by immunoblotting with specific antibodies, as indicated, and β-actin antibody for loading controls. Representative blots are shown. Fold change (Δ) in band intensity of proteins and p44/42 MAPK phosphorylation were normalized to β-actin and p44/42 MAPK protein loading, respectively, and shown as mean ± SEM (n = 4 each; 12-15 weeks old; 2 female mice and 2 male mice). (D) Immunoblot (IB) analysis with specific antibodies against VEGF-A, Ang 1, Ang 2, and VCAM-1 of BM exudates from AA and SS mice (left panel). Immunoglobulin G (IgG) light chain (L chain) was used as a loading control. One representative gel of 6 with similar results is presented. Densitometric analysis of immunoblots is shown as a bar graph (right panel). Results are shown as protein intensity relative to IgG. Ang 2 represents immature and mature Ang 2 forms. Data are presented as mean + SEM (n = 6 from each strain; 12-15 weeks old; 3 female mice and 3 male mice). *P < .05, **P < .01, ***P < .001, Student t test. AU, arbitrary units; M.W., molecular weight.
Further analyses focused on soluble vascular cell adhesion molecule-1 (VCAM-1) levels as a marker for inflammatory vessel activation.5,20,41,42 Higher VCAM-1 levels were found in BM exudate and plasma from SCD mice compared with AA animals (Figure 3D; supplemental Figure 3A by western blotting; supplemental Figure 3B soluble [s]VCAM-1 determined by ELISA). Taken together, these data show increased hypoxia-induced signaling in the BM, leading to local proangiogenic mediators of angiogenesis.
Expanded erythropoietic activity in the BM, extramedullary splenic erythropoiesis, and erythroid oxidative stress are characteristics of SCD mice
We then further characterized the erythroid cell populations in SS and AA mouse strains. In SCD mice, we confirmed the presence of increased BM erythropoietic activity associated with extramedullary erythropoiesis in the spleen (Figure 4A, CD44-TER119 gating strategy; supplemental Figure 4A, CD71-TER119 gating strategy). The erythroid maturation profile was similar in the BM from AA and SS mice when it was analyzed using the CD44-TER119 gating approach. However, when using the CD71-TER119 strategy, we observed accumulation of polychromatic erythroblasts (population III) and orthochromatic erythroblasts (population IV) in BM and spleen sites from SCD mice compared with healthy animals, suggesting the presence of ineffective erythropoiesis (supplemental Figure 4B). It is of interest that all erythroblast subpopulations showed increased reactive oxygen species (ROS) production compared with healthy cells in BM and spleen from SCD mice (Figure 4C). Using the CD44-TER119 gating strategy, we did not detect an increase in the number of Annexin V+ apoptotic cells in total erythroblasts in the BM of SS mice; however, upon further analysis using the CD71-TER119 strategy, we detected an increased number of apoptotic orthochromatic erythroblasts (population IV) in BM from SS mice (Figure 4E). There also was an increase in the number of apoptotic cells in the total erythroblast population in the spleen of SS mice (Figure 4D). Collectively, these findings show expansion of erythropoietic activity in the BM, extramedullary erythropoiesis, and increased erythroid oxidative stress.
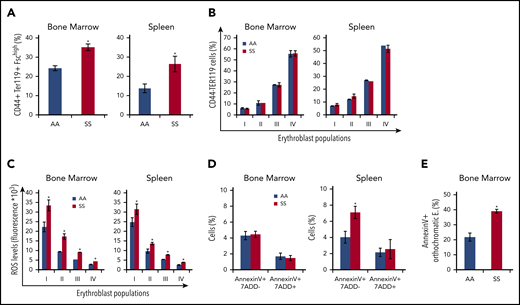
Expanded erythropoietic activity in the BM, extramedullary splenic erythropoiesis, and erythroid oxidative stress are characteristics of SCD mice. (A) Cytofluorimetric analysis of total erythroid precursors from the BM and the spleen of AA and SS mice using a CD44-Ter119 gating strategy in BM and spleen. (B) Erythroblast subpopulations determined by CD44-Ter119 gating strategy. Population I corresponds to proerythroblasts, population II corresponds to basophilic erythroblasts, population III corresponds to polychromatic erythroblasts, and population IV corresponds to orthochromatic erythroblasts. The percentage of subpopulations was analyzed. (C) ROS levels in erythroid precursors from the BM and the spleen were analyzed. (D) Amount of Annexin V+ 7AAD− or 7AAD+ total erythroblasts (CD45− TER119+ CD44+ FSChi cells) from the BM and the spleen were analyzed. (E) Amount of Annexin V+ orthochromatic erythroblasts (E; CD45− TER119+ CD71+ FSClow cells) from BM, using the CD71-TER119 cytofluorimetric strategy, as shown in supplemental Figure 4B, was analyzed. All bar graphs are mean ± standard error of the mean (n = 6 for each experiment; 14-16 weeks old; 4 female mice and 2 male mice). *P < .05, Student t test.
Expanded erythropoietic activity in the BM, extramedullary splenic erythropoiesis, and erythroid oxidative stress are characteristics of SCD mice. (A) Cytofluorimetric analysis of total erythroid precursors from the BM and the spleen of AA and SS mice using a CD44-Ter119 gating strategy in BM and spleen. (B) Erythroblast subpopulations determined by CD44-Ter119 gating strategy. Population I corresponds to proerythroblasts, population II corresponds to basophilic erythroblasts, population III corresponds to polychromatic erythroblasts, and population IV corresponds to orthochromatic erythroblasts. The percentage of subpopulations was analyzed. (C) ROS levels in erythroid precursors from the BM and the spleen were analyzed. (D) Amount of Annexin V+ 7AAD− or 7AAD+ total erythroblasts (CD45− TER119+ CD44+ FSChi cells) from the BM and the spleen were analyzed. (E) Amount of Annexin V+ orthochromatic erythroblasts (E; CD45− TER119+ CD71+ FSClow cells) from BM, using the CD71-TER119 cytofluorimetric strategy, as shown in supplemental Figure 4B, was analyzed. All bar graphs are mean ± standard error of the mean (n = 6 for each experiment; 14-16 weeks old; 4 female mice and 2 male mice). *P < .05, Student t test.
Transplantation of SCD mouse BM cells into WT mice leads to vascular defects and enhanced HIF-1α signaling in WT mice
To exclude the possibility that the vasculopathy (Figure 1) in adult SCD might have resulted from developmental defect(s), we transplanted SCD mouse BM cells into myeloablated WT adult mice. Within 4 weeks after transplantation, we found that BM vascular structures (arteries/arterioles and sinusoids) are dramatically disorganized (Figure 5A). High-performance liquid chromatography (HPLC) analysis of blood cell HbS and splenomegaly confirmed the SCD BM phenotype after transplantation (Figure 5B). Consistent with the vascular structural abnormalities, we also found that HIF-1α signaling (expression of HIF-1α, VEGFR, and Tie2, and phosphorylation of p44/42 MAPK/Erk1 and 2) is significantly increased in WT animals transplanted with SCD BM (Figure 5C). These data further corroborate the role of HbS in the generation of erythroid aggregates and the development of abnormal BM vascular niches.

Reconstituted SCD mouse BM cells lead to vascular defects and disrupt the CXCL12+ hematopoietic niche in the BM. Eight-week-old C57BL/6 WT (A-C) or CXCL12-GFP+ healthy (D-E) mice were reconstituted with BM cells (1 × 10⁶ cells per mouse) from AA or SS mice after lethal-dose whole-body irradiation. Four weeks after transplantation, reconstituted SCD mice were euthanized for BM niche analysis. (A) Representative 3D reconstructed confocal images of the femoral diaphysis, as described in Figure 1A. Scale bar = 200 μm. (B) HbS analysis of PB by HPLC (left panels). Spleen images from AA → WT or SS → WT chimera mice (right panel). (C) Hypoxia-induced signaling was analyzed in digested BM (dBM) cells, as described in Figure 3C. Representative blots of 4 independent experiments are shown. Fold change (Δ) in band intensity of proteins and p44/42 MAPK phosphorylation were normalized to β-actin and p44/42 MAPK protein loading, respectively, and shown as mean ± standard error of the mean (SEM) (n = 4; 12 weeks old, 2 female mice and 2 male mice). (D) Representative 2D images of the femoral diaphyses are shown from reconstituted AA → CXCL12-GFP+ or SS → CXCL12-GFP+ healthy mice using LaSC. Femoral sections of 12-week-old chimera mice were stained with endoglin, followed by nuclear DAPI staining. Endoglin+ sinusoidal events and CXCL12-GFPhi CAR events are contoured by iCys LaSC software, as shown in supplemental Figure 5. (E) Quantitative analysis of perisinusoidal CXCL12-GFPhi CAR numbers was performed using iCys LaSC software. Data are mean + SEM (n = 4; 12 weeks old; 2 female mice and 2 male mice). *P < .05, **P < .01, ***P < .001, 2-tailed unpaired Student t test. M.W., molecular weight.
Reconstituted SCD mouse BM cells lead to vascular defects and disrupt the CXCL12+ hematopoietic niche in the BM. Eight-week-old C57BL/6 WT (A-C) or CXCL12-GFP+ healthy (D-E) mice were reconstituted with BM cells (1 × 10⁶ cells per mouse) from AA or SS mice after lethal-dose whole-body irradiation. Four weeks after transplantation, reconstituted SCD mice were euthanized for BM niche analysis. (A) Representative 3D reconstructed confocal images of the femoral diaphysis, as described in Figure 1A. Scale bar = 200 μm. (B) HbS analysis of PB by HPLC (left panels). Spleen images from AA → WT or SS → WT chimera mice (right panel). (C) Hypoxia-induced signaling was analyzed in digested BM (dBM) cells, as described in Figure 3C. Representative blots of 4 independent experiments are shown. Fold change (Δ) in band intensity of proteins and p44/42 MAPK phosphorylation were normalized to β-actin and p44/42 MAPK protein loading, respectively, and shown as mean ± standard error of the mean (SEM) (n = 4; 12 weeks old, 2 female mice and 2 male mice). (D) Representative 2D images of the femoral diaphyses are shown from reconstituted AA → CXCL12-GFP+ or SS → CXCL12-GFP+ healthy mice using LaSC. Femoral sections of 12-week-old chimera mice were stained with endoglin, followed by nuclear DAPI staining. Endoglin+ sinusoidal events and CXCL12-GFPhi CAR events are contoured by iCys LaSC software, as shown in supplemental Figure 5. (E) Quantitative analysis of perisinusoidal CXCL12-GFPhi CAR numbers was performed using iCys LaSC software. Data are mean + SEM (n = 4; 12 weeks old; 2 female mice and 2 male mice). *P < .05, **P < .01, ***P < .001, 2-tailed unpaired Student t test. M.W., molecular weight.
Transplantation of SCD mouse BM cells into CXCL12-GFP+ reporter mice disrupts the CXCL12-producing niche
Previous studies have shown that CXCL12-GFPhi perivascular mesenchymal stromal cells, also called CAR (CXCL12 abundant reticulocytes),43 are tightly linked to sinusoids and play a key role in the homeostatic maintenance of HSCs and hematopoietic progenitor cells within the BM.29,44 To examine the effects of sickle RBCs on the CXCL12-producing BM niche, we transplanted SCD mouse BM cells into myeloablated CXCL12-GFP+ knock-in reporter mice that are used to monitor hematopoietic CXCL12+ BM niches. Four weeks after SCD BM transplantation, we analyzed the CXCL12+ BM niche by LaSC (supplemental Figure 5). We found that, in SS→CXCL12-GFP+ chimeras, the number of CXCL12+ perivascular mesenchymal stromal cells is markedly decreased as is their expression of CXCL12-GFP (Figure 5D). The absolute number of perisinusoidal CXCL12-GFPhi niche cells (also called CAR) decreases to one third in SS→CXCL12-GFP+ chimeras (Figure 5E). These data strongly imply that the pathologic HbS and related sickling events negatively impact the perivascular CXCL12+ BM niches, further supporting the importance of pathologic HbS in disruption of the BM vascular niche.
The abnormal BM vascular niche impacts steady-state hematopoiesis in SCD mice
The BM vascular niche is important for HSPC homeostasis.29,31,44,45 In particular, the vascular endothelium and perivascular mesenchymal cells express high levels of CXCL12, which plays a critical role in HSPC behavior, retention, and homing to the BM. In the BM and spleen of SS mice, the hematopoietic progenitor cell populations, as defined by phenotypic markers, were dramatically increased (supplemental Figure 6A-C). In contrast, the number of long-term HSCs was similar in SS and AA mice (supplemental Figure 6C). To examine HSPC populations in PB, we used colony-forming cell assays to establish that the number of colony-forming HSPCs also was significantly elevated (supplemental Figure 6D). Of note, the increase occurred in all progenitor subpopulations (ie, burst forming unit-erythroid, colony forming unit-granulocyte/monocyte), as well as in more primitive colony forming unit-granulocyte/erythrocyte/monocyte/megakaryocyte. Moreover, we also detected increased numbers of mature myeloid and lymphoid cells in the PB of SCD mice (supplemental Figure 6E).
BM vascular niche defects and splenomegaly are normalized by a 6-week blood cell transfusion regimen
Blood transfusion effecting a sustained reduction in HbS levels is an important therapeutic tool in the clinical management of SCD patients.46-48 To dissect the potential consequence of reduced HbS levels in reversing the abnormal BM vascular niche, we placed SS mice on a 6-week transfusion regimen to attain HbS < 30%, according to the gold standard for transfusion strategy in patients.49,50 The 1-week time interval between transfusions was chosen based on previously determined sickle RBC survival, which is markedly lower than that of healthy mice (SS, time to 50% survival [T50] = 3.5 ± 0.4 days vs AA, T50 = 18 ± 2.1 days, P < .02). Control AA mice were used as blood donors for SCD animals. As shown in Figure 6A, blood transfusion resulted in a reduction in extramedullary splenic erythropoiesis at 3 and 6 weeks of transfusion (Figure 6A, left panel: postmortem spleen determination; right panel: spleen ultrasonography follow-up in the same animals). This transfusion regimen also led to a progressive reduction in reticulocyte count and the resolution of anemia in SCD mice (Figure 6B). The analyses of RBC indices revealed the reduction in circulating dense RBCs, as indicated by the decrease in cell hemoglobin concentration mean and hemoglobin distribution width compared with vehicle-treated animals (Figure 6C). No major change in platelet counts was observed in SS mice treated with vehicle or 6 weeks of RBC transfusion (SS vehicle, 323 ± 18 × 103 cells per microliter vs SS 6-week transfusion, 447 ± 26 × 103 cells per microliter; n = 3; P = .682, not significant). The percentage of HbS gradually decreased to almost undetectable levels at 6 weeks of a weekly transfusion regimen (Figure 6D). Indeed, we observed a marked reduction in erythropoietic activity in spleen from weekly transfused SCD mice compared with vehicle-treated animals (Figure 6E). This was associated with a marked reduction in the generation of ROS from sickle erythroid precursors in transfused SCD mice compared with vehicle-treated SCD animals (supplemental Figure 7B). The ROS produced in erythroid progenitors might contribute to a pro-oxidant environment, leading to endothelial activation and vasculopathy.51-53 Thus, a reduction in ROS production may play a role in the correction of the BM vasculopathy following blood transfusion.54
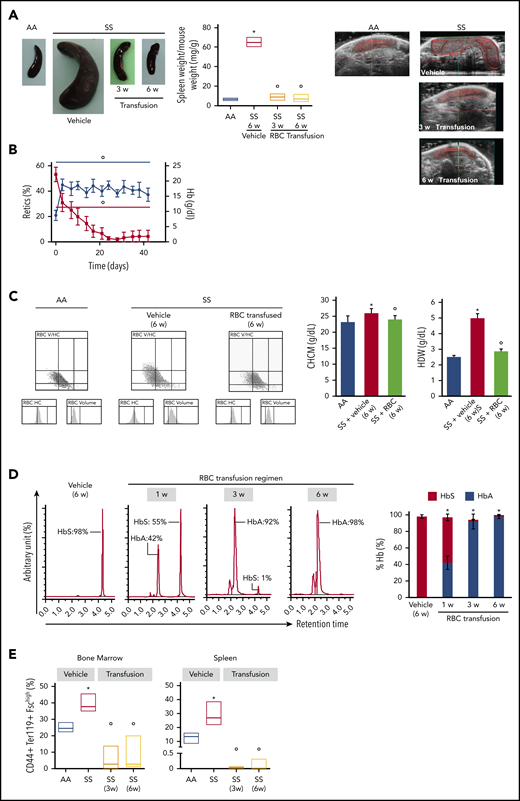
Transfusion of healthy mouse RBCs reverses SCD mouse phenotype. (A) Macroscopic appearance of spleen from AA mice and SS mice treated with vehicle or transfusion (left panel). One representative image from 6 mice per group is shown. Transfused SS mice were euthanized at 3 weeks (3 w) and 6 weeks (6 w) of treatment. Bar graph showing ratio of spleen weight/mouse weight for AA and SS mice treated with vehicle or transfusion (n = 6; 14-16 weeks old; 3 female mice and 3 male mice) (middle panel). Representative ultrasound images of intact AA and SS spleens followed up during treatment with vehicle or transfusion illustrating the dimension of the spleen (right panels). The solid red lines depict the 3D spleen reconstruction, showing the time-dependent reduction in the spleen in transfused SS mice. Spleen volumes were determined using Vevo software (supplemental Figure 7A). *P < .05 vs AA mice, °P < .05 vs vehicle-treated SS mice, 2-way analysis of variance (ANOVA) with Bonferroni correction for multiple comparisons. (B) Hemoglobin (Hb) and reticulocyte (Retics) counts in SS mice during the 6-week RBC transfusion regimen (n = 6; 10-16 weeks old; 3 female mice and 3 male mice). The red line refers to reticulocytes, and the blue line refers to hemoglobin. °P < .05 vs baseline values, 1-way ANOVA with the Dunnett test for longitudinal comparison. (C) Distribution graphs generated for RBC volume and hemoglobin concentration (RBC HC) of RBCs from AA mice and SS mice treated with vehicle or transfusion (left panels). The single experiment shown is representative of 6 additional experiments with similar results. Related values for cell hemoglobin concentration mean (CHCM) and hemoglobin distribution width (HDW) are shown in the bar graph (right panels). n = 6 (14-16 weeks old; 3 female mice and 3 male mice). *P < .05 vs AA mice, °P < .05 vs vehicle-treated SS mice, 2-way ANOVA with Bonferroni correction for multiple comparisons. (D) Representative reverse-phase HPLC of hemolysates from SS mice transfused with AA RBCs at 1 week (1 w), 3 weeks (3 w), and 6 weeks (6 w) of the transfusion regimen (left panel). Quantitation of HbS and HbA in SS mice treated with vehicle or transfusion at 1, 3, and 6 weeks of RBC transfusion, shown as the percentage of total Hb (right panel; n = 6; 10-16 weeks old; 3 female mice and 3 male mice). Data are mean ± standard error of the mean (SEM). *P < .02 vs baseline values, 1-way ANOVA with the Dunnett test for longitudinal comparison. (E) Frequency of CD44+ Ter119+ FSChi cells in the BM (left panel) and spleen (right panel) from AA mice and SS mice treated with vehicle or transfusion at 3 weeks (3w) and 6 weeks (6w) of RBC transfusion (n = 6; 10-16 weeks old; 3 female mice and 3 male mice). The boxes of the graphs represent the interquartile range (difference between the 25th and 75th percentile) with a middle line for the median. *P < .05 vs AA mice, °P < .02 vs SS mice, 2-way ANOVA with Bonferroni correction for multiple comparisons.
Transfusion of healthy mouse RBCs reverses SCD mouse phenotype. (A) Macroscopic appearance of spleen from AA mice and SS mice treated with vehicle or transfusion (left panel). One representative image from 6 mice per group is shown. Transfused SS mice were euthanized at 3 weeks (3 w) and 6 weeks (6 w) of treatment. Bar graph showing ratio of spleen weight/mouse weight for AA and SS mice treated with vehicle or transfusion (n = 6; 14-16 weeks old; 3 female mice and 3 male mice) (middle panel). Representative ultrasound images of intact AA and SS spleens followed up during treatment with vehicle or transfusion illustrating the dimension of the spleen (right panels). The solid red lines depict the 3D spleen reconstruction, showing the time-dependent reduction in the spleen in transfused SS mice. Spleen volumes were determined using Vevo software (supplemental Figure 7A). *P < .05 vs AA mice, °P < .05 vs vehicle-treated SS mice, 2-way analysis of variance (ANOVA) with Bonferroni correction for multiple comparisons. (B) Hemoglobin (Hb) and reticulocyte (Retics) counts in SS mice during the 6-week RBC transfusion regimen (n = 6; 10-16 weeks old; 3 female mice and 3 male mice). The red line refers to reticulocytes, and the blue line refers to hemoglobin. °P < .05 vs baseline values, 1-way ANOVA with the Dunnett test for longitudinal comparison. (C) Distribution graphs generated for RBC volume and hemoglobin concentration (RBC HC) of RBCs from AA mice and SS mice treated with vehicle or transfusion (left panels). The single experiment shown is representative of 6 additional experiments with similar results. Related values for cell hemoglobin concentration mean (CHCM) and hemoglobin distribution width (HDW) are shown in the bar graph (right panels). n = 6 (14-16 weeks old; 3 female mice and 3 male mice). *P < .05 vs AA mice, °P < .05 vs vehicle-treated SS mice, 2-way ANOVA with Bonferroni correction for multiple comparisons. (D) Representative reverse-phase HPLC of hemolysates from SS mice transfused with AA RBCs at 1 week (1 w), 3 weeks (3 w), and 6 weeks (6 w) of the transfusion regimen (left panel). Quantitation of HbS and HbA in SS mice treated with vehicle or transfusion at 1, 3, and 6 weeks of RBC transfusion, shown as the percentage of total Hb (right panel; n = 6; 10-16 weeks old; 3 female mice and 3 male mice). Data are mean ± standard error of the mean (SEM). *P < .02 vs baseline values, 1-way ANOVA with the Dunnett test for longitudinal comparison. (E) Frequency of CD44+ Ter119+ FSChi cells in the BM (left panel) and spleen (right panel) from AA mice and SS mice treated with vehicle or transfusion at 3 weeks (3w) and 6 weeks (6w) of RBC transfusion (n = 6; 10-16 weeks old; 3 female mice and 3 male mice). The boxes of the graphs represent the interquartile range (difference between the 25th and 75th percentile) with a middle line for the median. *P < .05 vs AA mice, °P < .02 vs SS mice, 2-way ANOVA with Bonferroni correction for multiple comparisons.
After 6 weeks of weekly transfusions, we found a complete reversal of the abnormal BM vasculature with the disappearance of highly tortuous and branched arterioles and collapsed sinusoids (3D confocal image in Figure 7A; 2D LaSC analysis in Figure 7B-C). This reversal was associated with a marked reduction in VEGF-A, Ang 1, and Ang 2 in the SCD BM milieu compared with vehicle-treated animals (Figure 7D). Of note, ephrins have recently been described to modulate the VEGF-VEGFR2 activation cascade and, consequently, VEGF-induced angiogenesis in normal and pathologic conditions.55-57 Thus, ephrin signaling may have contributed to the abnormal neoangiogenesis in SCD mice, as well as normalization of the BM vasculature following transfusion. We also observed a reduction in sVCAM-1 in BM exudate (Figure 7D), suggesting an amelioration of the BM vasculopathy.11,25 A similar reduction was also observed in peripheral plasma (supplemental Figure 7C-D, sVCAM-1 determined by ELISA). Previously, Wang et al suggested a possible detrimental effect of chronic transfusion and organ heme accumulation in SCD patients, linking the upregulation of endothelin-1 (ET-1) and the development of chronic lung damage.58 Here, we observed a reduction in the activation of Nrf2, a heme sensitive transcription factor, associated with reduced expression of HO-1 and ET-1 in the lung from transfused SS mice compared with vehicle treated animals (supplemental Figure 7E). Thus, these findings argue against organ accumulation of heme in transfused SS mice. Additionally, we found reduced expression of HO-1 in liver and heart from transfused SS mice compared with vehicle-treated animals (supplemental Figure 7F-G). Finally, we evaluated the liver nonheme iron content, which did not change after the 6-week RBC transfusion regimen in SS mice compared with vehicle-treated animals (supplemental Figure 7H). Collectively, these data indicate that 6 weeks of RBC transfusion did not worsen heme and nonheme iron content in SS-treated mice. Additionally, we performed hematoxylin and eosin staining and LaSC imaging of the BM sections, which also shows reversal of RBC aggregates in the BM (supplemental Figure 8). Collectively, our data indicate that the abnormal BM vascular niche in response to a 6-week transfusion regimen can undergo dynamic remodeling, accompanied by a reduction in proangiogenic mediators and markers of inflammatory vascular activation.
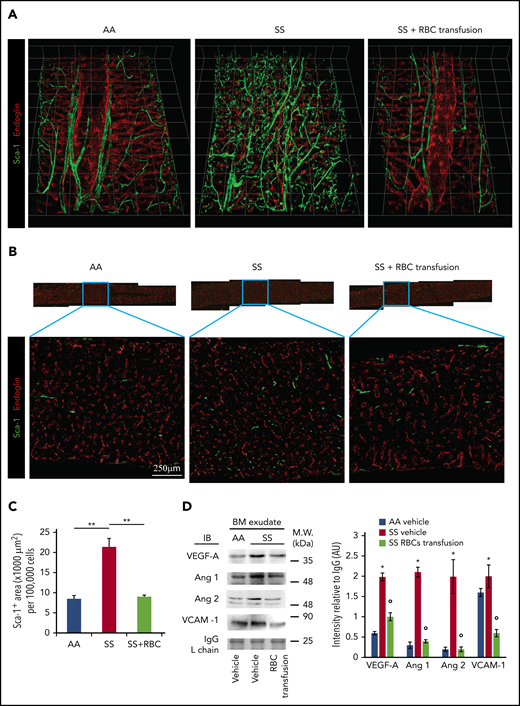
Transfusion of mouse RBCs rescues the vascular defects in SCD mice. (A) BM vasculature structures in transfused mice were analyzed by 3D confocal microscopy after staining femurs with specific antibodies against Sca-1 and endoglin, as described in Figure 1A. Representative images of the femoral diaphyses from 3 independent experiments. Grid scale: 1 unit = 155 μm. (B) Representative 2D images of femoral thin sections stained with specific antibodies against Sca-1 and endoglin by LaSC from 3 independent experiments. (C) LaSC analysis of Sca-1+ area in the BM, plotted as shown in Figure 1C (n = 3; 14-16 weeks old; 1 female mouse and 2 male mice). **P < .01. One-way analysis of variance (ANOVA) with Tukey test for multiple comparisons. (D) Immunoblot (IB) analysis with specific antibodies against VEGF-A, Ang 1, Ang 2, and VCAM-1 of BM exudates from AA mice and SS mice treated with vehicle or RBC transfusion for 6 weeks (left panel). Immunoglobulin G (IgG) light chain (L chain) was used as a loading control. One representative gel of 6 with similar results is shown. Data from densitometric analysis are shown in the bar graph as protein intensity relative to IgG (right panel). Ang 2 represents immature and mature Ang 2 forms. n = 6 from each strain (12-15 weeks old; 3 female mice and 3 male mice). Data are mean ± standard error of the mean. *P < .05 vs AA mice, °P < .05 vs vehicle-treated SS mice, 2-way ANOVA with Bonferroni correction for multiple comparisons. AU, arbitrary units, M.W., molecular weight.
Transfusion of mouse RBCs rescues the vascular defects in SCD mice. (A) BM vasculature structures in transfused mice were analyzed by 3D confocal microscopy after staining femurs with specific antibodies against Sca-1 and endoglin, as described in Figure 1A. Representative images of the femoral diaphyses from 3 independent experiments. Grid scale: 1 unit = 155 μm. (B) Representative 2D images of femoral thin sections stained with specific antibodies against Sca-1 and endoglin by LaSC from 3 independent experiments. (C) LaSC analysis of Sca-1+ area in the BM, plotted as shown in Figure 1C (n = 3; 14-16 weeks old; 1 female mouse and 2 male mice). **P < .01. One-way analysis of variance (ANOVA) with Tukey test for multiple comparisons. (D) Immunoblot (IB) analysis with specific antibodies against VEGF-A, Ang 1, Ang 2, and VCAM-1 of BM exudates from AA mice and SS mice treated with vehicle or RBC transfusion for 6 weeks (left panel). Immunoglobulin G (IgG) light chain (L chain) was used as a loading control. One representative gel of 6 with similar results is shown. Data from densitometric analysis are shown in the bar graph as protein intensity relative to IgG (right panel). Ang 2 represents immature and mature Ang 2 forms. n = 6 from each strain (12-15 weeks old; 3 female mice and 3 male mice). Data are mean ± standard error of the mean. *P < .05 vs AA mice, °P < .05 vs vehicle-treated SS mice, 2-way ANOVA with Bonferroni correction for multiple comparisons. AU, arbitrary units, M.W., molecular weight.
Discussion
Here, we describe for the first time the pathologic features of the BM vasculature in humanized sickle cell mice. Angiogenesis is a complex multistep process that requires the coordination of multiple angiogenic factors. Hypoxia inducible factors upregulate several angiogenic genes, but the local rapid induction of VEGF is most remarkable because of its importance in physiologic and pathologic angiogenesis in a dose-dependent manner.59,60 VEGF-A has been proposed to promote vessel proliferation, whereas, together with angiopoietins (Ang 1 and Ang 2), it coordinates vessel maturation and remodeling.61-63 We found increased levels of VEGF-A, Ang 1, and Ang 2 in BM exudate from humanized SCD mice compared with healthy mice (Figure 3D). Because the angiogenic actions of Ang 1 and Ang 2 are dependent on the presence of VEGF-A, the BM microenvironment in SCD mice exhibits an increase in all of the key local growth factors that are required to support angiogenesis.62,-66 Of note, Ang 2 also has been functionally linked to inflammatory vasculopathy in different diseases,62,66,67 further contributing to the local proinflammatory environment. In SCD mice, increased levels of VCAM-1, a marker of vascular dysfunction,68 was also observed in BM exudate and, to a greater extent, in the peripheral circulation (Figure 3D). Taken together, these results suggest that inflammatory vascular dysfunction, combined with the activated proangiogenic network, contribute to the pathologic angiogenic process in the BM microenvironment of SCD mice.
Transplantation of SCD BM cells into WT mice recapitulates the vascular niche defects of SCD mice, linking the presence of sickle erythroid cells to the pathogenesis of BM vasculopathy. This finding also illustrates the dynamic response of the BM vascular microenvironment to stress conditions related to pathologic HbS and HbS-polymerization events. Moreover, transplantation of SCD BM into WT CXCL12-GFP reporter mice also impacts CAR mesenchymal cells, most of which are tightly linked to the sinusoidal vessels and express high levels of CXCL12. The number of CAR cells is decreased significantly by >50%. The CXCL12/CXCR4 axis is critical for the maintenance of HSPCs and leukocytes within the BM cavity.29,43,44,69 In the BM, CXCL12 is expressed to a large extent on vascular endothelium and in perivascular mesenchymal stromal cells. Thus, we speculate that the decrease in CAR cells, along with a defective vascular microenvironment, contributes to the mobilization of HSPCs and leukocytes to the periphery.70 In addition to the CXL12/CXCR4 pathway, a multitude of mechanisms have been implicated in the regulation of HSPC trafficking. These include proteases, inflammatory cytokines, and, interestingly, vasculopathy-associated hyperangiotensinemia.71 The interplay of CXCL12 and CC chemokines also influences leukocyte trafficking from the BM.72,73 It is noteworthy that HSPC mobilization to the periphery was previously described in SCD patients and transgenic sickle SAD (Sickle, Antilles, and D Punjab mutation–containing β-globin gene) mice.74,75 Prior studies involving human subjects with SCD have shown sickle RBC aggregates in BM sinusoids,76,77 supporting the relevance of our studies to SCD patients. Thus, the aberrant vascular niche might also reduce HSPC homing and engraftment efficiency during HSC transplantation of SCD patients, in particular older SCD patients or those with chronic sickle cell–related end-organ damage.21,78
Given the pathogenic role of sickle RBCs in the BM vasculopathy of SCD, we reasoned that weekly transfusion of healthy RBCs for 6 weeks to reduce HbS levels to <30% might beneficially impact the BM vascular niche in SCD mice. Indeed, we found that this transfusion regimen reverses BM vascular niche structural defects (Figure 7) and splenomegaly (Figure 6A). This transfusion regimen also led to the normalization of proangiogenic factors (i.e., VEGF-A, Ang 1, and Ang 2) in BM exudate (Figure 7D). The correction of the BM vascular niche abnormalities in transfused SCD mice suggests that a similar intensive transfusion regimen may be advantageous in HSC transplantation protocols to ensure optimal stem cell transplantation efficiency. Targeting the Ang 2/VEGF axis might also be explored as a possible therapeutic strategy to mitigate disease progression of angiogenesis and vascular dysfunction79 ; however, pathologic angiogenesis is multifactorial and context dependent. Thus, we propose that further insight into the BM vasculopathy of SCD may identify new targets for patient monitoring and, potentially, therapeutic intervention.
Requests for original data and protocols should be sent to Leslie E. Silberstein (leslie.silberstein@childrens.harvard.edu).
The online version of this article contains a data supplement.
The publication costs of this article were defrayed in part by page charge payment. Therefore, and solely to indicate this fact, this article is hereby marked “advertisement” in accordance with 18 USC section 1734.
Acknowledgments
The authors thank John Manis, Carlo Brugnara, and Orah Platt (Boston Children’s Hospital) for helpful suggestions and discussion; the Neurobiology Imaging Facility at Harvard Medical School for expertise in 3-D imaging (funded by NINDS P30 Core Center grant NS072030); the IDDRC Cellular Imaging Core of Boston Children’s Hospital for expertise in image processing; the BCH HEME/ONC-HSCI flow cytometry research facility for expertise in cell sorting; the Harvard Catalyst Biostatistical Consulting Program, funded by the National Institutes of Health; and biostatistician Edie Weller (Boston Children’s Hospital) for biostatistical consultation.
This work was supported by FUR-UNIVR (L.D.F.), National Institutes of Health National Heart, Lung, and Blood Institute grant P01 HL095489 (L.E.S.), and Institute for Basic Science grant IBS-R023-Y1 (Y.J.).
Authorship
Contribution: L.E.S. conceived the study; S.-Y.P., L.D.F., and J.R. designed, performed, and analyzed experiments; E.-Y.H. and M.L. performed experiments; A.M. performed and analyzed transfusion experiments; W.B.A. performed transfusion experiments; C.C. and D.M. performed abdomen ultrasonography and analyzed data; Y.J. performed and analyzed intravital imaging experiments; T.N. provided Cxcl12-gfp mice; J.J.L. consulted on statistical issues and performed data analyses; C.P.L., L.E.S., and L.D.F. supervised experiments performed in their respective labs; and S.-Y.P., L.D.F., and L.E.S. wrote the manuscript with input from all coauthors. All authors discussed and approved the manuscript.
Conflict-of-interest disclosure: The authors declare no competing financial interests.
Correspondence: Leslie E. Silberstein, Department of Laboratory Medicine and Pathology, Boston Children’s Hospital and Harvard Medical School, 320 Longwood Ave, Boston, MA 02115; e-mail: leslie.silberstein@childrens.harvard.edu.
