

Key Points
A novel assay reveals delayed plasmin generation in plasma from mice fed a high-fat diet.
Proteomic and functional analyses suggest delayed plasmin generation results from a thrombomodulin- and TAFI-dependent mechanism.

Abstract
Obesity is a prevalent prothrombotic risk factor marked by enhanced fibrin formation and suppressed fibrinolysis. Fibrin both promotes thrombotic events and drives obesity pathophysiology, but a lack of essential analytical tools has left fibrinolytic mechanisms affected by obesity poorly defined. Using a plasmin-specific fluorogenic substrate, we developed a plasmin generation (PG) assay for mouse plasma that is sensitive to tissue plasminogen activator, α2-antiplasmin, active plasminogen activator inhibitor (PAI-1), and fibrin formation, but not fibrin crosslinking. Compared with plasmas from mice fed a control diet, plasmas from mice fed a high-fat diet (HFD) showed delayed PG and reduced PG velocity. Concurrent to impaired PG, HFD also enhanced thrombin generation (TG). The collective impact of abnormal TG and PG in HFD-fed mice produced normal fibrin formation kinetics but delayed fibrinolysis. Functional and proteomic analyses determined that delayed PG in HFD-fed mice was not due to altered levels of plasminogen, α2-antiplasmin, or fibrinogen. Changes in PG were also not explained by elevated PAI-1 because active PAI-1 concentrations required to inhibit the PG assay were 100-fold higher than circulating concentrations in mice. HFD-fed mice had increased circulating thrombomodulin, and inhibiting thrombomodulin or thrombin-activatable fibrinolysis inhibitor (TAFI) normalized PG, revealing a thrombomodulin- and TAFI-dependent antifibrinolytic mechanism. Integrating kinetic parameters to calculate the metric of TG/PG ratio revealed a quantifiable net shift toward a prothrombotic phenotype in HFD-fed mice. Integrating TG and PG measurements may define a prothrombotic risk factor in diet-induced obesity.
Introduction
Obesity and its affiliated sequelae such as cardiovascular disease, type 2 diabetes, nonalcoholic fatty liver disease, and cancer are leading causes of morbidity and mortality.1-5 Obesity is a risk factor for thrombotic disorders including stroke, myocardial infarction, and venous thromboembolism, and increases thrombotic risk associated with acquired risk factors.1-5 However, mechanisms controlling the prothrombotic ramifications of obesity remain poorly understood.
Obesity is an inflammatory condition associated with altered expression of coagulation factors by the diseased liver and inflamed endothelium. For example, plasma levels of procoagulant factors VII and VIII, von Willebrand factor, and fibrinogen are increased in obese humans and in mice with diet-induced obesity.6-11 These abnormalities enhance thrombin generation (TG), which is demonstrable using established methods that quantify recent activation of coagulation (eg, thrombin-antithrombin complexes [TAT]) in vivo, or procoagulant potential (eg, TG assay).12 Indeed, TG is increased in obese patients and associates with visceral adiposity.13,14 Overall, strong evidence suggests that a greater propensity to generate thrombin and produce fibrin contributes to the prothrombotic state in obesity.
Fibrin formation is counterbalanced by the fibrinolytic system. Fibrin formation stimulates activation of plasminogen to the enzyme plasmin that mediates fibrin degradation. Multiple studies have detected abnormal expression of proteins that regulate plasmin generation (PG) and plasmin activity in obese humans and mice, including tissue plasminogen activator (tPA), plasminogen activator inhibitor-1 (PAI-1), α2-antiplasmin, and thrombin-activatable fibrinolysis inhibitor (TAFI).8,10,11,15-19 Fibrinolysis end products (eg, α2-antiplasmin-plasmin complexes, D-dimer) are also elevated in obese humans and mice.17,20 However, compared with procoagulant function, fewer methods are available to assess fibrinolytic potential. Thromboelastography, turbidimetry, and the euglobulin clot lysis time detect fibrin formation and lysis, but do not provide direct information on the kinetics of PG. Previous methods to measure PG kinetics in plasma incorporated the use of fluorogenic substrates21-23 ; however, these methods did not correct for inner filter effects (adsorption of light by nonfluorescent proteins) and have not been applied to obesity. Thus, whereas considerable insight is available into mechanisms altering thrombin activity and initial fibrin formation in obesity, less is known about the quantitative dynamics of plasmin. This knowledge gap is a barrier to a complete understanding of the fibrinolytic derangement and prothrombotic state that is a highly prevalent characteristic of obesity.
In this study, we describe the development and characterization of a new kinetic assay that reveals PG potential in mouse plasma. Application of this assay to an experimental setting of high-fat diet (HFD)-induced obesity revealed a thrombomodulin- and TAFI-dependent mechanism that delays PG in plasma from HFD-fed mice. Our study reveals a complementary analytic strategy and identifies a new metric, the TG/PG ratio, to characterize the hemostatic imbalance associated with prothrombotic disease.
Materials and methods
Materials and methods can be found in the accompanying supplemental Materials on the Blood Web site.
Results
PG assay development
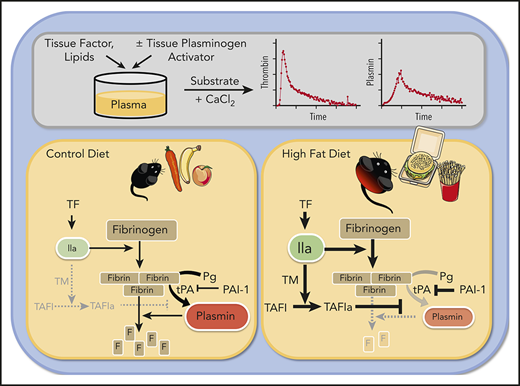
To study potential effects of obesity on plasmin generation, we first developed a new PG assay using a calibrated, automated method based on established principles used to measure TG (Figure 1A). Briefly, PG is triggered by addition of human tissue factor (TF) and recombinant human tPA (rtPA) to recalcified mouse plasma. Subsequent cleavage of a fluorogenic substrate by plasmin generates a fluorescent signal that is calibrated against human α2-macroglobulin-plasmin (α2M-Pm) complexes to correct for the inner filter effect, and then transformed into a PG curve. Similar to TG, PG is characterized by an initiation phase that precedes plasmin detection. The initiation phase is followed by a burst of PG and subsequent inhibition of active plasmin. Comparison of PG curves obtained in the presence of fluorogenic substrate with curves obtained from reactions in which wells were subsampled into fluorogenic substrate showed that the substrate, itself, does not alter PG kinetics (supplemental Figure 1A). Turbidity measurements confirmed this finding, showing that the plasmin fluorogenic substrate did not change fibrin formation kinetics or clot stability (supplemental Figure 1B). Substrate specificity was confirmed as PG was not detected in plasma from Plg−/− mice (Figure 1B) and was reduced by addition of mouse α2-antiplasmin in reactions triggered by either high or low rtPA (Figure 1C-D).
![Characterization of PG assay. (A) Platelet-poor plasma was mixed with TF, phospholipids, and rtPA. Calibrator wells contained plasma and calibrator (α2-macroglobulin/plasmin complex). Reactions were initiated by automatically dispensing fluorogenic substrate and CaCl2 to each well. These reactions produced 2 fluorescence curves (raw fluorescence from plasmin generation in plasma [solid line], calibrator curve [dashed line]) from which a PG curve was derived and associated parameters were calculated: time to measurable plasmin generation (lag time), TtPeak, velocity, maximum plasmin produced (peak), and time integral of PG (EPP). (B) PG was measured in Plg+/+ and Plg−/− plasmas diluted 1:6 (N = 3 mice/group); averaged curves are shown. (C-D) PG was measured in normal, pooled plasma (diluted 1:6) in the presence of (C) 1.25 μg/mL or (D) 0.31 μg/mL rtPA, with increasing concentrations of α2-antiplasmin (α2-AP, note longer time scale in panel D). (E) PG was measured in normal, pooled plasma diluted in HEPES-buffered saline. Dilutions are indicated as plasma-to-buffer ratio. Normal, pooled plasma was diluted (F) 1:3 or (G) 1:6 and PG was measured in the presence of the indicated concentrations of rtPA. (H-P) Thrombin generation, fibrin formation, and PG were measured in 1:6 diluted plasmas from littermate-matched wild-type mice and (H-J) fibrinogen-deficient mice (Fga+/−, Fga−/−), (K-M) mice expressing mutated fibrinogen that cannot polymerize (FgnAEK), and (N-P) factor XIII-deficient mice (F13a1+/−, F13a1−/−), or (Q-S) different TF concentrations (0.05-6 pM). All reactions included 1 pM TF and 1.25 µg/mL rtPA unless otherwise indicated. Panels C-S show representative curves.](https://ash.silverchair-cdn.com/ash/content_public/journal/blood/135/19/10.1182_blood.2019004267/1/m_bloodbld2019004267f1.png?Expires=1769458954&Signature=lslKgUETgiIGq-ccnvZnFZfAVosiR9Zq3qbIce12kRpnLzhlWTmklatwhm1TCkOiAi6USZVz8fLQtd-cscKm2eWUnKPwG-ja7gChthTzIB0zVjAB74tiGg2-H5CrB5-l0N7VbRkr0cW2DuU1CXjs1BdtO2DSuIUkMHF9lFe-ccYJsMfLlrwinojLiCTevZ6bw5Llf82Jmc8Ektc0tbTQXOfSVQOz2pvfbydM-unqbGdFFRkfmxwEqA-iRPnvcShbCQY8zOKwK9VqECvIj0s5Ugphh7wZ6if2quieUtQdWE2V3CJe5jYQyIXJACc7VKPXPiRM158asuaq5Pnu-IufCw__&Key-Pair-Id=APKAIE5G5CRDK6RD3PGA)
Characterization of PG assay. (A) Platelet-poor plasma was mixed with TF, phospholipids, and rtPA. Calibrator wells contained plasma and calibrator (α2-macroglobulin/plasmin complex). Reactions were initiated by automatically dispensing fluorogenic substrate and CaCl2 to each well. These reactions produced 2 fluorescence curves (raw fluorescence from plasmin generation in plasma [solid line], calibrator curve [dashed line]) from which a PG curve was derived and associated parameters were calculated: time to measurable plasmin generation (lag time), TtPeak, velocity, maximum plasmin produced (peak), and time integral of PG (EPP). (B) PG was measured in Plg+/+ and Plg−/− plasmas diluted 1:6 (N = 3 mice/group); averaged curves are shown. (C-D) PG was measured in normal, pooled plasma (diluted 1:6) in the presence of (C) 1.25 μg/mL or (D) 0.31 μg/mL rtPA, with increasing concentrations of α2-antiplasmin (α2-AP, note longer time scale in panel D). (E) PG was measured in normal, pooled plasma diluted in HEPES-buffered saline. Dilutions are indicated as plasma-to-buffer ratio. Normal, pooled plasma was diluted (F) 1:3 or (G) 1:6 and PG was measured in the presence of the indicated concentrations of rtPA. (H-P) Thrombin generation, fibrin formation, and PG were measured in 1:6 diluted plasmas from littermate-matched wild-type mice and (H-J) fibrinogen-deficient mice (Fga+/−, Fga−/−), (K-M) mice expressing mutated fibrinogen that cannot polymerize (FgnAEK), and (N-P) factor XIII-deficient mice (F13a1+/−, F13a1−/−), or (Q-S) different TF concentrations (0.05-6 pM). All reactions included 1 pM TF and 1.25 µg/mL rtPA unless otherwise indicated. Panels C-S show representative curves.
Characterization of PG assay. (A) Platelet-poor plasma was mixed with TF, phospholipids, and rtPA. Calibrator wells contained plasma and calibrator (α2-macroglobulin/plasmin complex). Reactions were initiated by automatically dispensing fluorogenic substrate and CaCl2 to each well. These reactions produced 2 fluorescence curves (raw fluorescence from plasmin generation in plasma [solid line], calibrator curve [dashed line]) from which a PG curve was derived and associated parameters were calculated: time to measurable plasmin generation (lag time), TtPeak, velocity, maximum plasmin produced (peak), and time integral of PG (EPP). (B) PG was measured in Plg+/+ and Plg−/− plasmas diluted 1:6 (N = 3 mice/group); averaged curves are shown. (C-D) PG was measured in normal, pooled plasma (diluted 1:6) in the presence of (C) 1.25 μg/mL or (D) 0.31 μg/mL rtPA, with increasing concentrations of α2-antiplasmin (α2-AP, note longer time scale in panel D). (E) PG was measured in normal, pooled plasma diluted in HEPES-buffered saline. Dilutions are indicated as plasma-to-buffer ratio. Normal, pooled plasma was diluted (F) 1:3 or (G) 1:6 and PG was measured in the presence of the indicated concentrations of rtPA. (H-P) Thrombin generation, fibrin formation, and PG were measured in 1:6 diluted plasmas from littermate-matched wild-type mice and (H-J) fibrinogen-deficient mice (Fga+/−, Fga−/−), (K-M) mice expressing mutated fibrinogen that cannot polymerize (FgnAEK), and (N-P) factor XIII-deficient mice (F13a1+/−, F13a1−/−), or (Q-S) different TF concentrations (0.05-6 pM). All reactions included 1 pM TF and 1.25 µg/mL rtPA unless otherwise indicated. Panels C-S show representative curves.
Because mouse plasma must be diluted for TG assays,24 we tested the impact of plasma dilution on PG (Figure 1E). Dilution did not affect the lag time but significantly shortened the time to peak (TtPeak), although the overall change was small (supplemental Figure 2A-B). Dilution slightly but nonsignificantly increased velocity and decreased the peak (supplemental Figure 2C-D). Total plasmin detected (EPP) decreased with plasma dilution (supplemental Figure 2E). Table 1 shows intra-assay, interassay, and inter-mouse variation for 1:3 and 1:6 dilutions of plasma. Intra-assay variation for each parameter was below 10%. Except for lag time and velocity, inter-assay variation was below 15%. Inter-mouse variation was comparable to that of TG parameters in human plasma.25
Exogenous rtPA increases PG
PG was not observed in the absence of rtPA, indicating basal levels of circulating tPA or urokinase (u)PA (∼1-5 ng/mL)26,27 were not sufficient to trigger measurable PG (data not shown). Addition of exogenous rtPA (0.31-10 μg/mL) shortened the lag time and TtPeak and increased the velocity, peak, and EPP in a concentration-dependent manner (Figure 1F-G; supplemental Figure 2F-J). Although velocity, peak, and EPP were higher in 1:3 than 1:6 diluted plasma, qualitative effects were similar. We used 0.31 and 1.25 μg/mL rtPA for subsequent experiments.
PG requires fibrin formation, but not fibrin crosslinking
During coagulation, thrombin cleaves fibrinopeptides from fibrinogen, producing fibrin monomers. Monomers then assemble into fibrin fibers, which function as a cofactor for plasminogen activation.28,29 To characterize relationships between TG, fibrin formation, and PG, we tested plasmas from wild-type mice and mice with deficiencies or abnormalities in fibrinogen concentration or fibrin assembly. As expected, compared with Fga+/+ mice, partial deficiency in fibrinogen (Fga+/−) did not alter TG (Figure 1H), but significantly decreased fibrin formation (Figure 1I) and reduced the PG velocity, peak, and EPP (Figure 1J; supplemental Figure 3A-E). Plasma from Fga−/− mice showed normal TG but did not form fibrin or generate plasmin (Figure 1H-J; supplemental Figure 3A-E). To determine whether effects of fibrinogen deficiency on PG were from loss of fibrinogen or decreased fibrin formation, we tested plasmas from mice expressing normal levels of a mutant fibrinogen that cannot polymerize (FgnAEK).30 TG did not differ in plasma from FgnWT/WT and FgnAEK/AEK mice (Figure 1K); however, turbidity experiments showed decreased and no fibrin formation in plasma from FgnWT/AEK and FgnAEK/AEK mice, respectively (Figure 1L). Compared with FgnWT/WT mice, plasma from FgnWT/AEK mice had a reduced peak and EPP, and plasma from FgnAEK/AEK mice did not support PG (Figure 1M; supplemental Figure 3F-J). There was no difference in TG, fibrin formation, or PG in plasmas from F13a1+/+, F13a1+/−, and F13a1−/− mice (Figure 1N-P; supplemental Figure 3K-O) or in wild-type plasma treated with the factor XIIIa inhibitor, T101 (supplemental Figure 3U). These findings indicate the PG assay is strongly dependent on fibrin polymerization, but not fibrin crosslinking.
We also varied TF (0.05-6 pM) to characterize the role of TG in fibrin formation and PG. Increasing TF shortened the lag time for TG, fibrin formation, and PG, demonstrating a positive correlation between the onset of these events (Figure 1Q-S; supplemental Figure 3P). As anticipated, increasing TF also shortened the TG TtPeak and increased the velocity, peak, and ETP (Figure 1Q; supplemental Figure 3Q-T). In clot formation assays, increasing TF decreased the maximum clot turbidity (Figure 1R), consistent with prior observations that higher thrombin produces clots with thinner fibrin fibers.31 Increasing TF did not alter the PG TtPeak, velocity, peak, or EPP (Figure 1S; supplemental Figure 3Q-T), likely because of the relatively high rtPA concentration.32 Findings were similar in 1:6 and 1:3 diluted plasma (Figure 1Q-S; data not shown). Collectively, these data suggest fibrin formed from even low thrombin is sufficient to enable PG.
HFD-fed mice demonstrate hypercoagulable and hypofibrinolytic states
To assess the effect of obesity on PG we studied mice fed a control diet (CD) or HFD for 12 weeks. As anticipated,9 mice fed an HFD for 12 weeks gained more weight than did mice fed a CD (Figure 2A). HFD-fed mice developed liver injury indicated by significantly elevated serum alanine aminotransferase (ALT) activity (Figure 2B), which correlated with body weight (R = 0.855, P < .003). Histopathological evidence of steatohepatitis was also evident in HFD-fed mice, including macro- and microvesicular steatosis, marked hepatic inflammatory cell infiltration, and fibrosis in a majority of mice (supplemental Figure 4). HFD-fed mice had increased fibrin degradation products (Figure 2C), indicating endogenous fibrin formation and lysis.
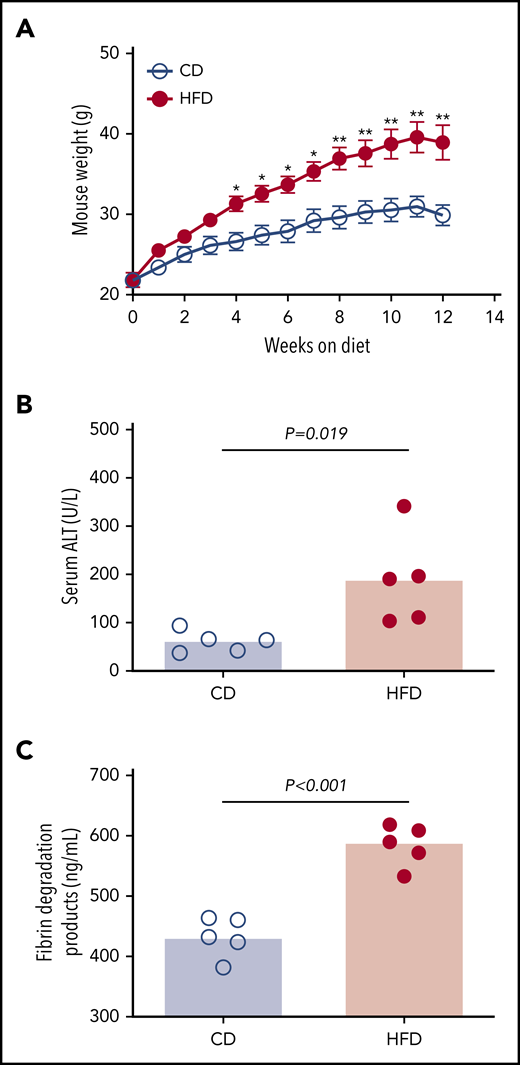
HFD leads to obesity and increased circulating fibrin degradation products. Mice were fed for 12 weeks with a CD or a HFD (N = 5/group). (A) Mean body weight, *P < .05 and **P < .01. (B) Serum alanine ALT and (C) plasma fibrin degradation products. Bars indicate medians; each dot represents a separate mouse.
HFD leads to obesity and increased circulating fibrin degradation products. Mice were fed for 12 weeks with a CD or a HFD (N = 5/group). (A) Mean body weight, *P < .05 and **P < .01. (B) Serum alanine ALT and (C) plasma fibrin degradation products. Bars indicate medians; each dot represents a separate mouse.
We then used these mice to test the hypothesis that HFD-induced obesity is associated with opposing changes in the kinetics of TG and PG. Experiments were performed using low and high TF to mimic endothelial dysfunction associated with venous thrombosis and severe vascular injury such as that observed with plaque rupture, respectively.33 Compared with CD, HFD did not alter the TG lag time or TtPeak, but significantly increased the TG velocity at low TF and increased the peak and ETP at both low and high TF (Figure 3A-F). Analysis of PG revealed a different pattern. Compared with CD-fed mice, PG was significantly delayed (prolonged lag time, TtPeak, and reduced velocity) in HFD-fed mice at both low and high TF, but no change in the plasmin peak was evident at either TF concentration (Figure 3G-K). HFD increased the EPP (Figure 3L). Similar results were observed for mice fed for 16 weeks and or with a higher fat diet (supplemental Figure 5). Multiple PG parameters correlated significantly with body weight and serum ALT, especially in reactions triggered with low TF (Table 2), strongly associating the observed changes in PG with HFD.
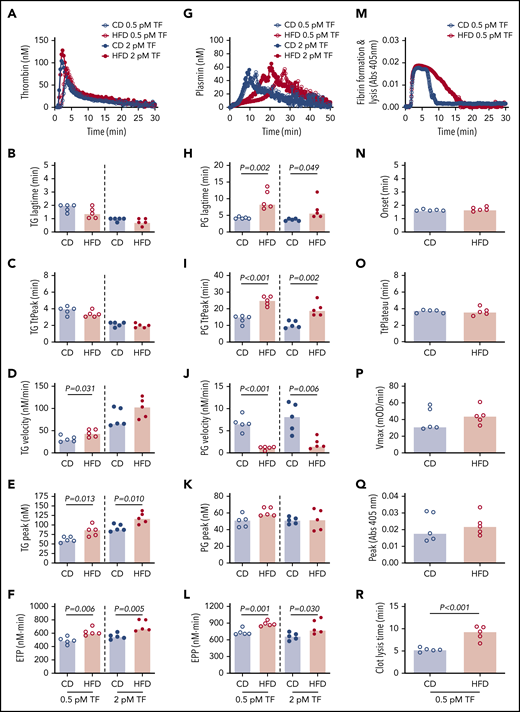
HFD increases TG and delays PG and fibrinolysis. (A-F) TG and (G-L) PG for CD- and HFD-fed mice were measured in the presence of 0.5 or 2 pM TF, as indicated, and 0.31 μg/mL rtPA (for PG assays). (M-R) Turbidity was measured in the presence of 0.5 pM TF and 0.31 μg/mL rtPA. Panels A, G, and M show representative curves. Bars indicate medians. Each dot represents a separate mouse.
HFD increases TG and delays PG and fibrinolysis. (A-F) TG and (G-L) PG for CD- and HFD-fed mice were measured in the presence of 0.5 or 2 pM TF, as indicated, and 0.31 μg/mL rtPA (for PG assays). (M-R) Turbidity was measured in the presence of 0.5 pM TF and 0.31 μg/mL rtPA. Panels A, G, and M show representative curves. Bars indicate medians. Each dot represents a separate mouse.
The combined functional effects of HFD feeding on plasma clotting and fibrinolysis were revealed in turbidity assays in which plasmas from HFD-fed mice demonstrated normal fibrin formation kinetics but significantly delayed clot lysis (Figure 3M-R). Collectively, these findings suggest the effect of HFD on TG and PG kinetics culminates in fibrin formation that is not balanced by an appropriate fibrinolytic response.
Changes in PAI-1 are insufficient to explain abnormalities in PG parameters in HFD-fed obese mice
To identify the molecular mechanisms contributing to delayed PG in HFD-fed mice, we first measured the plasma concentrations of proteins already known to affect PG. Concentrations of fibrinogen, plasminogen, and α2-antiplasmin were not significantly different between CD- and HFD-fed mice (Figure 4A-C). Previous studies showed that expression of the endogenous tPA inhibitor PAI-1 strongly correlates with body mass index in obese humans and mice, and PAI-1 has an important role in venous thrombosis and resistance of platelet-rich arterial thrombi to lysis.15,17,19,34 PAI-1 is synthetized in an active form, but converts spontaneously to a latent (inactive) conformation in plasma, comprising ∼90% of total circulating PAI-1.35 To determine if delayed PG could be attributed to elevated PAI-1, we measured total and active PAI-1 in plasmas from CD- and HFD-fed mice. Compared with CD-fed mice, HFD-fed mice had increased total and active PAI-1 (Figure 4D-E), and these correlated with body weight (Figure 4F-G) and multiple PG parameters (Table 3). To determine whether elevated PAI-1 in HFD-fed mice delays PG in the PG assay, we spiked normal plasma with mouse PAI-1 and measured PG. Increasing total PAI-1 did not prolong PG (Figure 4H). Spiking plasma with active human PAI-1 inhibited PG (Figure 4I); however, the concentration required to inhibit PG in this exogenous tPA-triggered assay was 100-fold higher than that detected in HFD-fed mice, suggesting the observed delay in PG stemmed from a second, independent antifibrinolytic mechanism.
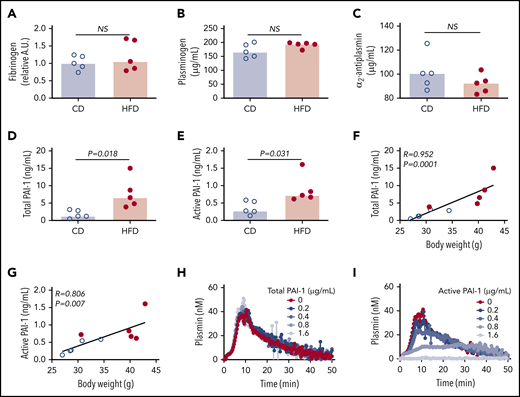
Increased PAI-1 is not sufficient to explain delayed PG in HFD-fed mice. (A) Fibrinogen, (B) plasminogen, (C) α2-antiplasmin, (D) total PAI-1, and (E) active PAI-1 in plasma from CD- and HFD-fed mice. Fibrinogen was measured by immunoblot and densitometry to confirm presence of all 3 chains; β-chain was used for quantification. Plasminogen, α2-antiplasmin, and PAI-1 were measured by ELISA. (F-G) Correlation between total and active PAI-1 and body weight. (H-I) PG was measured in 1:3-diluted normal, pooled plasma triggered with 1 pM TF and 0.31 µg/mL rtPA in the presence of various concentrations of (H) total mouse and (I) conformationally active human PAI-1. Bars indicate medians. Each dot represents a separate mouse. NS, not significant.
Increased PAI-1 is not sufficient to explain delayed PG in HFD-fed mice. (A) Fibrinogen, (B) plasminogen, (C) α2-antiplasmin, (D) total PAI-1, and (E) active PAI-1 in plasma from CD- and HFD-fed mice. Fibrinogen was measured by immunoblot and densitometry to confirm presence of all 3 chains; β-chain was used for quantification. Plasminogen, α2-antiplasmin, and PAI-1 were measured by ELISA. (F-G) Correlation between total and active PAI-1 and body weight. (H-I) PG was measured in 1:3-diluted normal, pooled plasma triggered with 1 pM TF and 0.31 µg/mL rtPA in the presence of various concentrations of (H) total mouse and (I) conformationally active human PAI-1. Bars indicate medians. Each dot represents a separate mouse. NS, not significant.
Elevated thrombomodulin and carboxypeptidase activity contribute to delayed PG
To more broadly survey differences between CD- and HFD-fed mice that could contribute to delayed PG, we characterized the plasma proteomes from these mice using mass spectrometry. Using the Ward clustering algorithm with Euclidean distance measurements, the 2 groups were readily distinguished by relative protein levels (Figure 5A). Partial least squares discriminant analysis data reduction methods segregated plasmas from CD- and HFD-fed mice (Figure 5B). Differences between groups were driven largely by metabolic pathways. Analysis did not detect substantive posttranslational modification of circulating fibrinogen in HFD-fed mice, but ∼70 proteins were significantly (P ≤ .05) different between groups (supplemental Table 1). As anticipated,10 Kyoto Encyclopedia of Genes and Genomes analysis revealed significant enrichments in pathways associated with complement and coagulation (P < 10−12) and cholesterol metabolism (P < 10−8) (Figure 5C). In particular, HFD-fed mice showed significant elevations in 2 proteins with potential functions in fibrinolytic pathways: C-1-inhibitor and carboxypeptidase B2 (also known as TAFI) (Figure 5D-E). C-1 inhibitor can inactivate fibrinolytic proteases including tPA and plasmin, whereas activated TAFI (TAFIa) cleaves C-lysine residues from fibrin, preventing tPA-mediated activation of plasminogen.36,37 Both C-1-inhibitor and TAFI correlated significantly with PG parameters (supplemental Figure 6), and TAFI measurements confirmed by enzyme-linked immunosorbent assay (ELISA) (Figure 5F) correlated significantly with data from mass spectrometry (R = 0.672, P = .039).
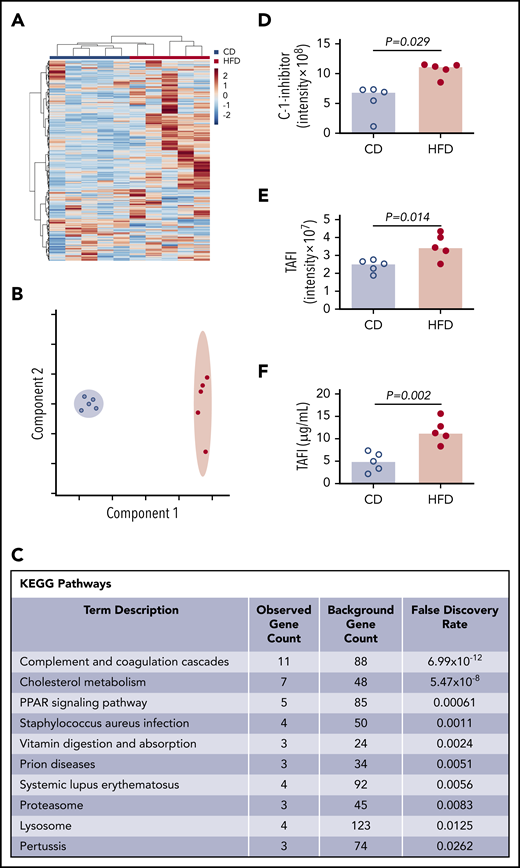
Mass spectrometry detects altered concentrations of coagulation and fibrinolytic proteins in plasma. (A) Heat map with Ward clustering of protein relative abundances (Z-scored). (B) Partial least squares discriminant analysis data reduction based on relative abundances of plasma proteins from (blue circles) CD- and (red circles) HFD-fed mice. (C) Enrichment of functional pathways in HFD-fed mice by Kyoto Encyclopedia of Genes and Genomes analysis. (D-E) Relative C-1-inhibitor and TAFI levels in CD- and HFD-fed mice determined by mass spectrometry. Intensity measurements are area under the curve for all peptides originating from the listed protein. (F) TAFI concentrations determined by ELISA. Bars indicate medians. Each dot represents a separate mouse.
Mass spectrometry detects altered concentrations of coagulation and fibrinolytic proteins in plasma. (A) Heat map with Ward clustering of protein relative abundances (Z-scored). (B) Partial least squares discriminant analysis data reduction based on relative abundances of plasma proteins from (blue circles) CD- and (red circles) HFD-fed mice. (C) Enrichment of functional pathways in HFD-fed mice by Kyoto Encyclopedia of Genes and Genomes analysis. (D-E) Relative C-1-inhibitor and TAFI levels in CD- and HFD-fed mice determined by mass spectrometry. Intensity measurements are area under the curve for all peptides originating from the listed protein. (F) TAFI concentrations determined by ELISA. Bars indicate medians. Each dot represents a separate mouse.
To determine the potential contribution of these proteins to PG, we spiked human C-1-inhibitor or zymogen human TAFI into plasma from wild-type mice and measured the effect on PG. Surprisingly, however, neither protein altered PG in this experiment (Figure 6A-B). Although TAFI can be activated by thrombin or plasmin, the thrombin/thrombomodulin complex substantially enhances TAFI activation (1250-fold).38-40 Thrombomodulin is primarily membrane-bound, but elevated soluble thrombomodulin has been detected in plasmas from humans and mice with obesity or inflammatory disease.41-45 Therefore, we tested the hypothesis that functional manifestations of elevated TAFI(a) in HFD-fed mice were unveiled by low levels of endogenous circulating thrombomodulin that were below the level of detection by mass spectrometry. Immunoblot analysis of plasmas from CD- and HFD-fed mice using CTM1009 antibody that recognizes the extracellular region of thrombomodulin revealed increased levels of a ∼56 kDa band in HFD mice (Figure 6C-D). This band is smaller than full-length mouse thrombomodulin (∼78 kDa46 ), suggesting it represents a cleaved form of thrombomodulin (ie, a species lacking the intracellular and transmembrane regions). Whereas band intensity did not correlate with TG lag time, TtPeak, velocity, or peak (supplemental Figure 7A-D), it correlated significantly with PG lag time, TtPeak, velocity, and EPP (supplemental Figure 7F-J).
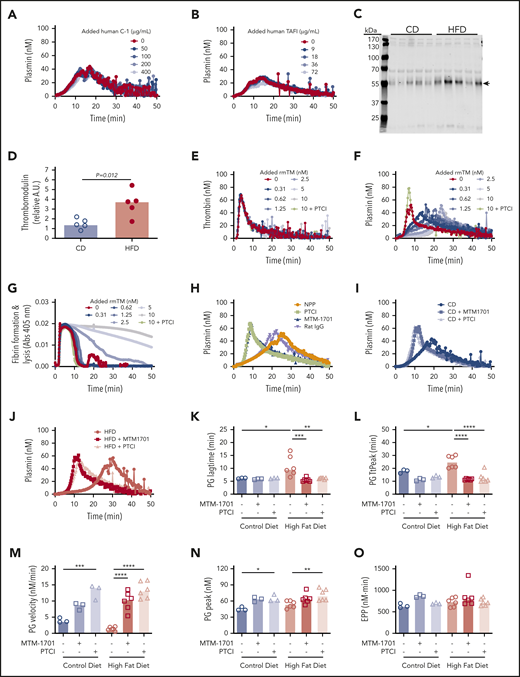
Soluble thrombomodulin and carboxypeptidase activity contribute to delayed PG. PG was measured in the presence of increasing concentrations of exogenous (A) human C-1 inhibitor and (B) human TAFI. (C-D) Plasma from CD- and HFD-fed mice were separated by sodium dodecyl sulfate-polyacrylamide gel electrophoresis and immunoblotted with anti-thrombomodulin antibody. The major band indicated with an arrow in panel C was quantified in panel D. Each lane and dot represent a separate mouse in panels C and D, respectively. (E) TG, (F) PG, and (G) turbidity were measured in the presence of increasing concentrations of rmTM (0.31-10 nM) or PTCI (50 µg/mL). (H) PG was measured in normal mouse plasma (NPP) in the absence and presence of PTCI and anti-mouse thrombomodulin antibody (MTM-1701) or control immunoglobulin G. (I-J) PG in plasma from CD- and HFD-fed mice in the absence and presence of MTM-1701 or PTCI. In this experiment, plasmas were from mice fed CD (13% kcal fat) or HFD (60% kcal fat) for 16 weeks. (K-O) PG parameters for CD- and HFD-fed mice in the absence or presence of MTM-1701 and PTCI. All experiments were performed in 1:3 diluted plasma, triggered with 0.5 pM TF and 0.31 µg/mL rtPA (for PG and turbidity assays). Each dot represents a separate mouse. Bars indicate medians. Statistical comparisons were performed by ANOVA with Dunnett post hoc testing using CD or HFD as the index condition. P < .05, **P < .01, ***P < .001, and ****P < .0001.
Soluble thrombomodulin and carboxypeptidase activity contribute to delayed PG. PG was measured in the presence of increasing concentrations of exogenous (A) human C-1 inhibitor and (B) human TAFI. (C-D) Plasma from CD- and HFD-fed mice were separated by sodium dodecyl sulfate-polyacrylamide gel electrophoresis and immunoblotted with anti-thrombomodulin antibody. The major band indicated with an arrow in panel C was quantified in panel D. Each lane and dot represent a separate mouse in panels C and D, respectively. (E) TG, (F) PG, and (G) turbidity were measured in the presence of increasing concentrations of rmTM (0.31-10 nM) or PTCI (50 µg/mL). (H) PG was measured in normal mouse plasma (NPP) in the absence and presence of PTCI and anti-mouse thrombomodulin antibody (MTM-1701) or control immunoglobulin G. (I-J) PG in plasma from CD- and HFD-fed mice in the absence and presence of MTM-1701 or PTCI. In this experiment, plasmas were from mice fed CD (13% kcal fat) or HFD (60% kcal fat) for 16 weeks. (K-O) PG parameters for CD- and HFD-fed mice in the absence or presence of MTM-1701 and PTCI. All experiments were performed in 1:3 diluted plasma, triggered with 0.5 pM TF and 0.31 µg/mL rtPA (for PG and turbidity assays). Each dot represents a separate mouse. Bars indicate medians. Statistical comparisons were performed by ANOVA with Dunnett post hoc testing using CD or HFD as the index condition. P < .05, **P < .01, ***P < .001, and ****P < .0001.
To determine potential functional effects of soluble thrombomodulin on TG, PG, and fibrin formation/lysis, we spiked wild-type plasma with recombinant mouse thrombomodulin (rmTM). Addition of low concentrations of rmTM that had no effect on TG (Figure 6E) significantly delayed PG (Figure 6F) and clot lysis (Figure 6G), and addition of monoclonal anti-mouse thrombomodulin antibody (MTM-1701)47 or potato tuber carboxypeptidase inhibitor (PTCI) to block carboxypeptidase activity reversed this effect (Figure 6F-H). Importantly, addition of MTM-1701 or PTCI shortened the PG lag time and TtPeak and increased the velocity and peak in plasmas from both CD- and HFD-fed mice, and effects were more pronounced in HFD-fed mice (Figure 6I-O). Collectively, these data suggest PG is delayed in HFD-fed mice via thrombomodulin-dependent activation of a carboxypeptidase activity, that is likely TAFI.
Prothrombotic phenotype can be detected in the relative kinetics of TG and PG
Representative curves showing TG, PG, and combined effects on fibrin formation and lysis for CD- and HFD-fed mice are depicted in Figure 7A-B. Although the onset of TG, and consequently fibrin formation, was rapid in both CD- and HFD-fed mice, delayed PG in HFD-fed mice produced a substantial delay in clot lysis. To quantify the degree of malalignment between TG and PG in HFD-fed mice, we calculated the TG/PG ratio for each parameter. TG/PG ratios for TtPeak and velocity correlated significantly with body weight, whereas the TG/PG ratio for peak correlated significantly with serum ALT (Table 4), suggesting independent mechanisms mediate relationships between PG and body weight and liver function in HFD-fed mice. Compared with CD-fed mice, HFD-fed mice had abnormal TG/PG ratios for parameters coinciding with fibrin formation: lag time, TtPeak, and velocity (Figure 7C-G). The degree of imbalance in these early parameters was not readily apparent from TG analysis alone, suggesting the TG/PG ratio reveals a global dysregulation in mechanisms that promote fibrin deposition and persistence. Collectively, these data suggest comprehensive assessment of procoagulant and fibrinolytic capacity provides unique insight into coagulopathic mechanisms caused by HFD in mice.
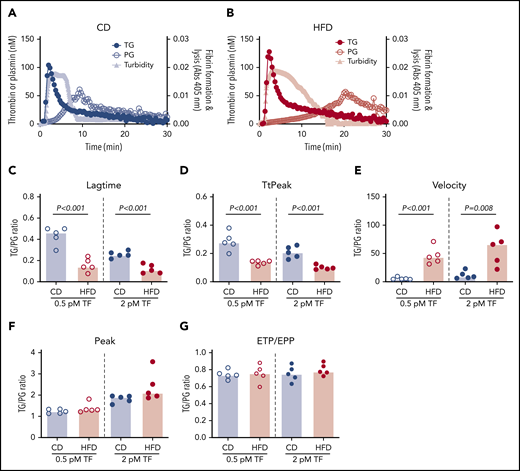
TG/PG ratios reveal a prothrombotic phenotype in HFD-fed mice. Representative curves of TG, PG, and turbidity for (A) CD-fed mice and (B) HFD-fed mice. TG/PG ratios were calculated by dividing each TG parameter by the corresponding PG parameter. Panels show TG/PG ratios for (C) lag time, (D) TtPeak, (E) velocity, (F) peak, and (G) ETP/EPP. Bars indicate medians. Each dot represents a separate mouse.
TG/PG ratios reveal a prothrombotic phenotype in HFD-fed mice. Representative curves of TG, PG, and turbidity for (A) CD-fed mice and (B) HFD-fed mice. TG/PG ratios were calculated by dividing each TG parameter by the corresponding PG parameter. Panels show TG/PG ratios for (C) lag time, (D) TtPeak, (E) velocity, (F) peak, and (G) ETP/EPP. Bars indicate medians. Each dot represents a separate mouse.
Discussion
A majority of research centered on coagulation perturbations in obesity has focused on altered procoagulant factors in obese patients and related experimental settings. However, although abnormal concentrations of circulating proteins comprising the plasminogen activator system (eg, tPA, plasminogen, PAI-1, α2-antiplasmin, TAFI) are also evident in obesity, the functional impact of these abnormalities has been difficult to define. Our development of a calibrated assay to measure PG kinetics in parallel with TG provides the opportunity to detect the global imbalance of processes that normally control fibrin deposition and dissolution. Application of this assay uncovered a previously undescribed thrombomodulin- and TAFI-dependent delay in PG kinetics in a robust setting of experimental obesity.
Increased plasma concentrations of the tPA inhibitor, PAI-1 have been documented in prior studies of obese humans and mice, and PAI-1 has emerged as a potential target for antithrombotic therapy. Interestingly, the relative insensitivity of our exogenous tPA-driven PG assay to active PAI-1 enabled our discovery of a second hypofibrinolytic mechanism involving thrombomodulin. Following activation of coagulation, thrombin binding to thrombomodulin shifts its specificity from procoagulant (eg, fibrin) to anticoagulant and profibrinolytic substrates (eg, protein C and TAFI, respectively). The relative contribution of the thrombin/thrombomodulin complex to anticoagulant and antifibrinolytic pathways is determined by the thrombomodulin concentration. Whereas high thrombomodulin inhibits coagulation by promoting protein C activation, low concentrations of cellular or soluble thrombomodulin promote TAFI activation.38,48 TAFIa removes C-terminal lysine residues from fibrin, reducing binding sites for both plasmin and plasminogen.37 Consequently, TAFIa decreases fibrin cleavage by plasmin as well as fibrin’s ability to support PG. Although carboxypeptidase N also possesses this activity and is inhibited by PTCI, carboxypeptidase N is constitutively active. TAFI requires activation by the thrombin-thrombomodulin complex or glycosaminoglycan-bound plasmin,49 making it the likely effector in this setting. Thus, our findings suggest a mechanism in which HFD induces a functional increase in soluble thrombomodulin that is insufficient to inhibit TG, but which facilitates thrombin-mediated activation of TAFI. Since a previous study attributed hypofibrinolysis in plasma from obese children to both PAI-1 and TAFI,50 these proteins likely function simultaneously but independently, resulting in potent antifibrinolytic activity in obesity.
Prior studies have detected low concentrations of soluble thrombomodulin in plasma from even healthy humans (292 ng/mL51 ). Accordingly, we observed thrombomodulin-dependent effects on PG in plasma from both CD- and HFD-fed mice; however, effects were enhanced by HFD. The source of and mechanisms that increase circulating thrombomodulin in obese humans and mice are unclear. Although thrombomodulin can be detected in leukocytes and platelets, it is predominantly expressed on vascular endothelium.52-54 Consequently, thrombomodulin in plasma of patients with inflammatory disease or obesity likely originates from shedding of thrombomodulin from activated endothelium. Consistent with this premise, our analysis of the plasma proteome also revealed elevated biomarkers of activated endothelium in HFD-fed mice (eg, von Willebrand factor [1.9-fold, P = .015] and soluble vascular cell adhesion molecule-1 [1.3-fold, P = .097]; supplemental Table 1). Specific mechanisms that increase thrombomodulin shedding in diet-induced obesity are unclear, but likely stem from inflammatory processes. Cytokines and adipokines associated with HFD, including tumor necrosis factor-α and leptin, reduce endothelial expression of thrombomodulin, but paradoxically increase thrombomodulin release into the circulation.43,55-60 Neutrophil-derived enzymes and oxidative damage also promote thrombomodulin shedding from endothelium.61 Our proteomic analysis of plasma from HFD-fed mice revealed increased cathepsin B (1.9-fold, P = .003), which can enhance protease activity, and reduced glutathione peroxidase-3 (0.75-fold, P < .005), which protects against oxidative damage. Because thrombomodulin has diverse and pleiotropic effects in physiology, it is difficult to conclude whether shedding is a pathologic result of the HFD or a compensatory mechanism that limits HFD-associated pathologies. However, it appears that this shift in thrombomodulin compartmentalization away from the endothelium to the plasma decreases vessel wall-associated anticoagulant activity while simultaneously inhibiting fibrinolytic activity. The potential for additive or synergistic contributions of these mechanisms to HFD-driven obesity warrants further analysis.
Our results documenting delayed plasma PG in experimental obesity offer insight into the prothrombotic state accompanying metabolic disease. Previous studies have documented a reciprocal relationship between fibrin formation and obesity. Specifically, fibrin engagement of leukocyte β2 integrins drives adipose and hepatic inflammation, amplifying HFD-induced obesity and fatty liver disease.9,62 Reducing coagulation activation genetically or pharmacologically decreases fibrin deposition in adipose tissue and liver, and inhibits HFD-induced obesity in mice.9,62 Thus, cyclical amplification of obesity and its sequelae by thrombomodulin/TAFI-dependent inhibition of fibrinolysis may stabilize fibrin deposits that potentiate inflammation. This situation may be similar to mechanisms driving metabolic advantages of PAI-1-deficient mice, which are protected from obesity and insulin resistance.19,63 By extension, the thrombomodulin/TAFI-dependent antifibrinolytic pathway may represent a novel target to enhance fibrin dissolution and consequently, decrease fibrin-driven inflammation in obesity. Given the complex role of thrombomodulin in both anticoagulant and antifibrinolytic functions, thrombomodulin-directed therapies are likely untenable. Interestingly, however, increased circulating TAFI in obese humans and mice is correlated with hypofibrinolysis and thrombotic risk.18,64-67 In vitro and in vivo studies show profibrinolytic effects from TAFI inhibition, including enhanced fibrinolysis in whole blood and plasma,68-71 reduced FeCl3 injury-induced vena cava thrombus mass in mice,71,72 and enhanced tPA-mediated thrombolysis in rabbits.73 These effects may be achievable with minimal bleeding risk, insofar as TAFI-deficient mice do not have a hemorrhagic phenotype or exhibit increased bleeding following tail transection.74 Proof-of-concept stems from studies successfully targeting thrombin/thrombomodulin-dependent TAFI activation to enhance fibrinolysis in a baboon model of sepsis,75 another setting in which thrombomodulin transitions from endothelium to a soluble form in plasma.
Prior studies have reported methods to measure PG kinetics in plasma using fluorescent substrates.21-23 Concentrations of TF and tPA differed modestly between these studies, ranging from ∼0.28-5 pM TF and ∼3.3-7.5 nM tPA, but were similar to concentrations used in our study (0.5 pM TF and ∼5.2 nM tPA). However, these methods had potential caveats, including inner filter effects and use of solvents that may compromise fibrin formation. Advances of our assay include the use of a mathematical model to correct for substrate consumption and the inner filter effect,76 calibration with α2M-Pm complex, and a water-soluble fluorogenic substrate. Although the use of diluted plasma may alter some biochemical relationships, dilution reduces substrate consumption,77 facilitates comparison with TG values,24 and solves logistical problems of small sample volumes in mouse studies. Our PG assay is triggered by human TF and tPA because mouse proteins are not as readily available. Human tPA exhibits similar dose-dependent binding to mouse fibrin as mouse tPA,78 and like mouse tPA, is rapidly inhibited by both human and mouse PAI-1, yielding similar t1/2 in mouse plasma.78 In the absence of fibrin, activation of mouse plasminogen by human tPA is ∼200-fold lower than by mouse tPA; however, in the presence of fibrin, it is only five- to 10-fold lower,78 making the PG assay quite sensitive to fibrin’s cofactor activity in mouse plasma.29 It is therefore interesting to speculate that if applied to other models of disease, the PG assay could also detect abnormalities in fibrinogen synthesis or posttranslational modifications (eg, acetylation, glycation, homocysteinylation) that have been associated with abnormal fibrinolysis.79-82 For example, use of our assay to differentiate effects of these modifications on abnormal fibrin structure vs defective PG may provide insight into the underlying pathophysiology in diseases including atherosclerosis and diabetes. In addition, because the rtPA concentrations we used are within levels targeted during therapeutic thrombolysis, the PG assay may inform studies of thrombus treatment or resolution.
Readouts from our PG assay may provide quantitative measures to define coagulopathy in pathological settings. First, use of a TG/PG ratio may yield a metric to identify global dysregulation in the mechanisms regulating these processes, as well as situations in which “rebalancing” has occurred. A classic example is liver dysfunction, in which multiple plasma proteins are altered simultaneously and phenotypes are difficult to predict.83 Differences between CD- and HFD-fed mice were significant at both low and high TF concentrations, suggesting both mild and severe events that expose TF to blood (eg, endothelial activation, plaque rupture) may promote robust and stable fibrin deposition. Second, in studies of thrombotic disease, integration of ex vivo measures of coagulation (eg, TAT, F1+2) with TG parameters provides complementary information on recent coagulation events in vivo and residual procoagulant potential in plasma. Measurements of fibrinolysis end-products (eg, α2-antiplasmin-plasmin complexes, D-dimer) with plasma PG may similarly be used to assess fibrinolytic events in vivo in concert with remaining fibrinolytic potential. Moreover, integration of procoagulant and fibrinolytic measurements may be used to define overall capacity to generate and sustain fibrin not only in obesity, but also in other settings involving simultaneous dysregulation of coagulation and fibrinolytic systems, including infection and disseminated intravascular coagulation.
In summary, we report a new PG assay and its application to an experimental model of diet-induced obesity in mice. Our analysis documents a consistent hemostatic imbalance among different HFDs and durations of feeding and exposes the antifibrinolytic activity of soluble thrombomodulin and TAFI. Discovery of this mechanism has functional consequences beyond intravascular thrombus formation, as this pathway may permit the persistence of fibrin that drives metabolic disease. It remains unclear whether changes in PG result from HFD, manifestations of obesity, or both. It will be interesting to determine whether abnormal PG can be detected in genetic models of obesity and in obese humans, and whether the TG/PG ratio can be used to differentiate the so-called “healthy obese.” Because elevated thrombomodulin has been detected in plasma from patients with other proinflammatory and prothrombotic diseases including cardioembolic stroke,41 sepsis-associated disseminated intravascular coagulation,42 and atherosclerosis,45 the antifibrinolytic mechanism unearthed here may have broad relevance across a range of inflammatory settings.
For original data, please contact the corresponding author.
The online version of this article contains a data supplement.
The publication costs of this article were defrayed in part by page charge payment. Therefore, and solely to indicate this fact, this article is hereby marked “advertisement” in accordance with 18 USC section 1734.
Acknowledgments
The authors thank Charles T. Esmon for providing antibodies, and Robert A. Campbell for reading the manuscript.
This study was supported by funding from the National Institutes of Health (NIH) National Heart, Lung, and Blood Institute R01HL126974 and R61HL141791 (A.S.W.) and U01HL143403 (A.S.W. and M.J.F.), NIH National Institute of Environmental Health Sciences R01ES017537 (J.P.L.), and NIH National Institute of Diabetes and Digestive and Kidney Diseases R01DK112778 (M.J.F.).
Authorship
Contribution: A.M., B.d.L., and A.S.W. developed the hypothesis; A.M., A.K.K., A.P., K.C.H., L.A.H., and J.R.B. performed experiments and/or collected data; V.A.P., F.J.C., and D.A.L. provided essential reagents; A.M., K.C.H., M.J.F., J.P.L., and A.S.W. analyzed data; A.M., J.P.L., and A.S.W. interpreted data; and A.M., M.J.F., J.P.L., and A.S.W. wrote the manuscript, which was revised and approved by all authors.
Conflict-of-interest disclosure: A.M. and B.d.L. are employed by Synapse Research Institute, a member of the STAGO Diagnostic group that produces calibrated automated thrombography for thrombin generation measurements in plasma. The remaining authors declare no competing financial interests.
Correspondence: Alisa S. Wolberg, Department of Pathology and Laboratory Medicine, University of North Carolina at Chapel Hill, 8018A Mary Ellen Jones Building, CB #7035, Chapel Hill, NC 27599-7035; e-mail: alisa_wolberg@med.unc.edu.

![Characterization of PG assay. (A) Platelet-poor plasma was mixed with TF, phospholipids, and rtPA. Calibrator wells contained plasma and calibrator (α2-macroglobulin/plasmin complex). Reactions were initiated by automatically dispensing fluorogenic substrate and CaCl2 to each well. These reactions produced 2 fluorescence curves (raw fluorescence from plasmin generation in plasma [solid line], calibrator curve [dashed line]) from which a PG curve was derived and associated parameters were calculated: time to measurable plasmin generation (lag time), TtPeak, velocity, maximum plasmin produced (peak), and time integral of PG (EPP). (B) PG was measured in Plg+/+ and Plg−/− plasmas diluted 1:6 (N = 3 mice/group); averaged curves are shown. (C-D) PG was measured in normal, pooled plasma (diluted 1:6) in the presence of (C) 1.25 μg/mL or (D) 0.31 μg/mL rtPA, with increasing concentrations of α2-antiplasmin (α2-AP, note longer time scale in panel D). (E) PG was measured in normal, pooled plasma diluted in HEPES-buffered saline. Dilutions are indicated as plasma-to-buffer ratio. Normal, pooled plasma was diluted (F) 1:3 or (G) 1:6 and PG was measured in the presence of the indicated concentrations of rtPA. (H-P) Thrombin generation, fibrin formation, and PG were measured in 1:6 diluted plasmas from littermate-matched wild-type mice and (H-J) fibrinogen-deficient mice (Fga+/−, Fga−/−), (K-M) mice expressing mutated fibrinogen that cannot polymerize (FgnAEK), and (N-P) factor XIII-deficient mice (F13a1+/−, F13a1−/−), or (Q-S) different TF concentrations (0.05-6 pM). All reactions included 1 pM TF and 1.25 µg/mL rtPA unless otherwise indicated. Panels C-S show representative curves.](https://ash.silverchair-cdn.com/ash/content_public/journal/blood/135/19/10.1182_blood.2019004267/1/m_bloodbld2019004267f1.png?Expires=1769557594&Signature=u3r~6Xu-wfwUXGSGl5eXN5ff2TTvjZ-duPUetMjoUIacdUrr0s5fqiXsbiRNnDotXRhC80DVHrhVD3djJDqlT4rr3EGKwUq1r3AZGpWIJaBtpg3oWN6t~ZZKkMjhNi6U2mWAogUmiIQE20RjfjQozAhi~IURzRILEqCAq49AjYwcbtdkWYRCA5TdxPb1lKtx~p70HEW1t6txG-Y6-6kw8AEU777d~bpAKw4bgfTzW3pgcJdd~c4ccLbsvxlE-k2nLAxWIWz5Sf6lJuRwlJxKc7JvnCNAOGcQeeGh3HUerMT~FXK1lWIoPRdzMAvGZhh5uVtsOn0GQb0U~RD7da3VHw__&Key-Pair-Id=APKAIE5G5CRDK6RD3PGA)


