

Key Points
Macrophages in the HBA region of the mouse embryo play a role in HS/PC expansion and/or maturation.
Embryonic head macrophages produce the proinflammatory tumor necrosis factor-α and act as niche cells in vitro to enhance hematopoiesis.

Abstract
Along with the aorta-gonad-mesonephros region, the head is a site of hematopoietic stem and progenitor cell (HS/PC) development in the mouse embryo. Macrophages are present in both these embryonic hemogenic sites, and recent studies indicate a functional interaction of macrophages with hematopoietic cells as they are generated in the aorta. Whereas brain macrophages or “microglia” are known to affect neuronal patterning and vascular circuitry in the embryonic brain, it is unknown whether macrophages play a role in head hematopoiesis. Here, we characterize head macrophages and examine whether they affect the HS/PC output of the hindbrain-branchial arch (HBA) region of the mouse embryo. We show that HBA macrophages are CD45+F4/80+CD11b+Gr1− and express the macrophage-specific Csf1r-GFP reporter. In the HBA of chemokine receptor-deficient (Cx3cr1−/−) embryos, a reduction in erythropoiesis is concomitant with a decrease in HBA macrophage percentages. In cocultures, we show that head macrophages boost hematopoietic progenitor cell numbers from HBA endothelial cells > twofold, and that the proinflammatory factor tumor necrosis factor-α is produced by head macrophages and influences HBA hematopoiesis in vitro. Taken together, head macrophages play a positive role in HBA erythropoiesis and HS/PC expansion and/or maturation, acting as microenvironmental cellular regulators in hematopoietic development.
Introduction
Hematopoietic stem cells (HSCs) are the self-renewing source of mature blood cell lineages in the adult. During embryonic development, both hematopoietic progenitor cells (HPC) and HSCs are generated from endothelial cells (ECs) of the major vasculature (aorta and vitelline/umbilical arteries)1-4 through a specialized developmental process, endothelial-to-hematopoietic transition (EHT), and emerge in the lumen as cell clusters. The mouse embryonic head also generates HSCs and HPCs,5 and functional hematopoietic assays localize these cells to the hindbrain-branchial arch (HBA)6 vascular regions. Rather than the formation of hematopoietic clusters as in the embryonic aorta lumen, imaging analyses of the HBA reveal the close associations of only single hematopoietic cells (HCs) adjacent to ECs,6 suggesting differences in the regulation of head hematopoietic development.
Molecular studies on hematopoietic stem/progenitor cell (HS/PC) development in the aorta of zebrafish embryos and the aorta-gonad-mesonephros (AGM) region of mouse embryos identified some factors and signaling pathways that facilitate EHT.2,7-9 Investigations focusing on the cellular microenvironment surrounding the embryonic aorta10 revealed rare cell-cell interactions involving neutrophils11 and macrophages12,13 : in zebrafish embryos, neutrophils signal to the intraaortic hematopoietic cells (IAHC) through tumor necrosis factor-α (TNF-α), and macrophages promote HS/PC mobilization at the vascular wall through localized production of MMP2/9.12,13 A surprisingly large number of CD45+F4/80+ macrophages were found to be scattered around the mouse embryonic day (E)10.5 aorta and adjacent to cells of the IAHC.8,14-16 Recent time-lapse imaging studies show transient interactions of macrophages with IAHC.16
The earliest embryonic macrophages in the mouse are formed in the yolk sac blood islands beginning at E7.5.17 In vivo lineage tracing supports a recruitment of these macrophages to head region, where in the brain they become the tissue resident macrophages, “microglia,” that persist through all stages of life.18,19 Microglia are regulators of central neural system patterning and promote vascular networking during embryonic stages.20-22 During adult stages, macrophages are effectors of immune response homeostasis (pro- and anti-inflammatory). Macrophages express the transmembrane tyrosine kinase receptor (Csf1r)23 and are regulated by colony stimulating factor-1 (Csf-1). Csf1r−/− mice exhibit diminished macrophage numbers, reproductive defects, obstructed organ development, and a severe brain phenotype (neocortical progenitor proliferation and apoptosis are increased, and the differentiation of some neuronal subtypes is reduced).24,25 Although microglia-neuron interactions are thought to involve the Cx3cr1-Cx3cl1 chemokine signaling pathway,26 it remains unknown whether macrophages/microglia are regulators of embryonic head hematopoiesis.
Proinflammatory factors produced by innate immune cells, such as interleukin-1 (IL-1), interferons (IFNs), and TNF-α, play a role in embryonic hematopoiesis.27 In Zebrafish embryos, TNF-α secreted by neutrophils activates downstream signaling pathways implicated in aortic HS/PC production.11 IL-1 receptor (IL-1RI)–deficient mouse embryos show a slight decrease in AGM HSC activity28 in mouse, and zebrafish embryos deficient for IFN-γ or IFN-α are significantly reduced in HS/PCs.15 In this study, we examine the role of head macrophages in HS/PC development in the mouse embryonic HBA and report that they influence HBA erythropoiesis and promote expansion and/or maturation of HBA HS/PC through TNF-α arising from HBA macrophages.
Materials and methods
Mouse and embryo generation
Wild-type (WT) C57BL/6 and MacGreen (Csf1r-GFP),29 Cx3cr1-GFP,30 Csf1r-Cre31 (from J. W. Pollard), RosaDTAlox32 (from G. Kassiotis), and Vav-Cre33 (from N. Speck) mice (all C57BL/6-Ly5.2 background) were used for timed matings and C57BL/6-Ly5.1 mice (8 to 12 weeks) were transplantation recipients. Embryos were generated from MacGreen male mice crossed with WT female mice, and Csf1r-Cre female mice crossed with RosaDTA male mice. Embryo staging was done by somite pair counts.34 HBA were dissected6 (Figure 1A), and forebrains were used for pheno/genotyping. Polymerase chain reaction (PCR) primers used for genotyping embryos are listed in supplemental Table 1, available on the Blood Web site. Mice were housed in the University of Edinburgh animal facilities and experimentation complied with UK Home Office Regulations and Licensing.
![Characterization of macrophages in E9.5 to E11.5 MacGreen HBA. (A) Schematic diagram of dissected HBA region on the mouse embryonic head. The region includes the first and second branchial arches. (B) Flow cytometric profile for E10.5 MacGreen HBA cells showing that all GFP+ (high-expressing) cells are CD45+CD11b+F4/80+Gr1− macrophages. Percentages shown in gated areas. FSC, forward scatter. (C) Percentages of MacGreen GFP+ cells in E9.5, E10.5, and E11.5 HBA (n ≥ 3). *P = .016; ***P < .001. (D) Three-dimensional whole-mount images of an immunostained MacGreen E10.5 head (34 somite pairs [sp]), with boxed areas enlarged in right panels. Anti-GFP (green) and anti-CD31 (magenta) antibody staining shows localization of macrophages surrounding the CD31+ vasculature. CA, carotid artery; NE, neuroepithelium; V, brain ventricle. Bar = 10 μm. (E) Representative flow cytometric data showing MFI and percentage of GFP+ macrophages and GFP− cells expressing chemokine receptors in the E10.5 (32 to 39 sp) MacGreen HBA. Dotted line = FMO; blue line = GFP− cells; gray filled = GFP+ cells. (F) Bar graphs showing percentages of chemokine receptor-expressing cells in the GFP+ fraction. n = 4 for Cx3cr1, Ccr7, Ccr5, Ccr3 and n = 3 for Cxcr4, Cxcr2.](https://ash.silverchair-cdn.com/ash/content_public/journal/blood/134/22/10.1182_blood.2018881243/3/m_blood881243f1.png?Expires=1767710280&Signature=hZ3IkvmJNMeo~80fRWKblCQM43GY1oCUCbFJqFvS1l6HPFhZ0ZURwF9oCnRgtj1Xps2NJgvTBoAK2jTBRDMwGMHUK69Fas5MBTqIa3nOFWqbpemXFjeV8oUiIP9MQQrKbr0r6eT-2z70gKwUU2cKcY6zSwE6asDYHb9HxoX8rVH3HAYCtdU3ji5rHK1VuytFPLtgYs0-QieplDzjUXGkj93dLznE1DIUVGzil4RhHjptOkFqGfYX5Rv9931LsRgMalK4i6WPyxImLOGKn92gCuQM3vXiGtpt2ddwkw3dGLprfx~82TfveYo~CWHsV542Z3I7tNuk7IQoMwAptw-yaA__&Key-Pair-Id=APKAIE5G5CRDK6RD3PGA)
Characterization of macrophages in E9.5 to E11.5 MacGreen HBA. (A) Schematic diagram of dissected HBA region on the mouse embryonic head. The region includes the first and second branchial arches. (B) Flow cytometric profile for E10.5 MacGreen HBA cells showing that all GFP+ (high-expressing) cells are CD45+CD11b+F4/80+Gr1− macrophages. Percentages shown in gated areas. FSC, forward scatter. (C) Percentages of MacGreen GFP+ cells in E9.5, E10.5, and E11.5 HBA (n ≥ 3). *P = .016; ***P < .001. (D) Three-dimensional whole-mount images of an immunostained MacGreen E10.5 head (34 somite pairs [sp]), with boxed areas enlarged in right panels. Anti-GFP (green) and anti-CD31 (magenta) antibody staining shows localization of macrophages surrounding the CD31+ vasculature. CA, carotid artery; NE, neuroepithelium; V, brain ventricle. Bar = 10 μm. (E) Representative flow cytometric data showing MFI and percentage of GFP+ macrophages and GFP− cells expressing chemokine receptors in the E10.5 (32 to 39 sp) MacGreen HBA. Dotted line = FMO; blue line = GFP− cells; gray filled = GFP+ cells. (F) Bar graphs showing percentages of chemokine receptor-expressing cells in the GFP+ fraction. n = 4 for Cx3cr1, Ccr7, Ccr5, Ccr3 and n = 3 for Cxcr4, Cxcr2.
Characterization of macrophages in E9.5 to E11.5 MacGreen HBA. (A) Schematic diagram of dissected HBA region on the mouse embryonic head. The region includes the first and second branchial arches. (B) Flow cytometric profile for E10.5 MacGreen HBA cells showing that all GFP+ (high-expressing) cells are CD45+CD11b+F4/80+Gr1− macrophages. Percentages shown in gated areas. FSC, forward scatter. (C) Percentages of MacGreen GFP+ cells in E9.5, E10.5, and E11.5 HBA (n ≥ 3). *P = .016; ***P < .001. (D) Three-dimensional whole-mount images of an immunostained MacGreen E10.5 head (34 somite pairs [sp]), with boxed areas enlarged in right panels. Anti-GFP (green) and anti-CD31 (magenta) antibody staining shows localization of macrophages surrounding the CD31+ vasculature. CA, carotid artery; NE, neuroepithelium; V, brain ventricle. Bar = 10 μm. (E) Representative flow cytometric data showing MFI and percentage of GFP+ macrophages and GFP− cells expressing chemokine receptors in the E10.5 (32 to 39 sp) MacGreen HBA. Dotted line = FMO; blue line = GFP− cells; gray filled = GFP+ cells. (F) Bar graphs showing percentages of chemokine receptor-expressing cells in the GFP+ fraction. n = 4 for Cx3cr1, Ccr7, Ccr5, Ccr3 and n = 3 for Cxcr4, Cxcr2.
Hematopoietic progenitor and stem cell assays
Single-cell suspensions from HBA or cultures were seeded in the methylcellulose (M3434; Stem Cell Technologies) colony-forming unit-culture (CFU-C) assay. Colonies were counted after 10 days, and lineage-specific colony outputs were quantitated as number of CFU-C per 1 embryo equivalent (ee) of HBA cells. HBA cells (1 to 3 ee) were injected IV into (9.0 Gy γ-irradiation, split dose) Ly5.1 mice. Peripheral blood was taken (4 and 16 weeks) for Ly5.1-/Ly5.2-specific fluorescence-activated cell sorter (FACS) analysis. Recipients are considered repopulated when ≥5% of cells are donor derived.
OP9-DL1 coculture system
OP9-DL1-B1 (Bmp4−/−) cells were generated by CRISPR-Cas9 (Bmp4 exon 1 single guide RNA: 5′-GTGTAAGGTTCGACGGACCG-3′, 5′CGGTCCGTCGAACCTTACAC-3′; Bmp4 exon3 single guide RNA: 5′-ACCATCAGCATTCGGTTACC-3′, 5′-GGTAACCGAATGCTGATGGT-3′) engineering. HBA cells were cocultured in 10% fetal bovine serum (Hyclone; Brunschwig Chemie), α-Minimal Essential Medium, 1% Pen-Strep, 1% Glutamax (all from Gibco) with OP9-DL1-B1 cells (stem cell factor, 100 ng/mL; IL-3, 100 ng/mL; and Flt3-ligand, 100 ng/mL; PeproTech) ± CSF1R Inhibitor (BLZ945 6.7 nM diluted in dimethyl sulfoxide [DMSO]; MedChemExpress).35 TNF-α, IL-1β (PeproTech), and TNF-α neutralizing antibody (nAb; 1 μg/mL; R&D Systems) were added at the start of coculture. After 7 days, supernatant and semiadhesive cells were harvested and sorted for enzyme-linked immunosorbent assays and methylcellulose cultures, respectively.
Flow cytometry
Cells from HBA, cultures, and adult hematopoietic tissues were antibody stained (supplemental Table 2) for 30 minutes on ice. Sorted cells were collected in 50% fetal bovine serum/phosphate-buffered saline for functional analyses or in lysis buffer for RNA extraction. Cytometry was performed on BDFortessa/Aria II(BD Biosciences).
Gene expression analysis
RNA from sorted cells was extracted with RNeasy MicroKit (Qiagen). Complementary DNAs were generated with oligdT primers and SuperScriptIII Reverse Transcriptase (Thermo Fisher Scientific). Real Time (RT)-PCR was performed by using Fast SYBR Green Master Mix and ABI7900 (Thermo Fisher Scientific) detection. Primers are listed in supplemental Table 3.
Embryo immunostaining
Whole-mount staining was performed according to published methods.36 MacGreen embryonic head was fixed 20 minutes in 2% paraformaldehyde. Antibodies are listed in supplemental Table 2.
Cytokine assays
TNF-α protein concentration was tested with the BD Cytometric Bead Array Kit. Standard curves were generated using supplied control samples, and data were analyzed by FCAPArray software.
Statistical analyses
Comparisons of 2 groups were performed with Student t test, and comparisons of >2 groups were performed using 1-way analysis of variance test. P < .05 was considered significant.
Results
Phenotypic characterization of macrophages in the mouse embryonic HBA
The HBA (branchial arch one and two) region from Csf1r-GFP (MacGreen, macrophage reporter) transgenic mouse embryos was dissected (Figure 1A), and cells were analyzed by flow cytometry.19,24,29 Brain-resident macrophages, microglia, originate from E7.5 yolk sac myeloid precursors, and upon entry into the brain lose cKit expression and initiate F4/80 expression.19,37 Of GFP+ cells in the E10 HBA, 99.6% were positive for the hematopoietic marker CD45 (Figure 1B). Whereas >95% of these cells were CD11b+F4/80+, only a small percentage were CD11b+F4/80−. Both fractions were negative for the granulocytic marker Gr1. Likewise, almost all (99.2%) CD45+F4/80+CD11b+Gr1− cells were GFP+ (supplemental.Figure 1A). Thus, most HBA GFP+ cells are macrophages. Between E9.5 and E10.5, there was a significant threefold increase in HBA GFP+ cells (0.29% ± 0.02% and 0.93% ± 0.08%, respectively), which further increased to 1.13% ± 0.23% at E11.5 (Figure 1C).
E10.5 MacGreen embryo whole-mount images showed macrophages scattered throughout the HBA, with many macrophages localized around the CD31+ ECs of the large lateral vessels (Figure 1D,1Di), the carotid arteries.6,38 Macrophages also localized along the small vessels (not shown), consistent with a role for macrophages in vascular networking.22,39 Macrophages were also present in the neuroepithelium (Figure 1Dii).
Chemokine and chemokine receptor expression on HBA cells
Because chemokine receptor/ligand interactions are involved in inflammatory responses, we examined MacGreen HBA cells for the expression of Cx3cr1, Cxcr4, Cxcr2, Ccr7, Ccr5, and Ccr3. Flow cytometric analyses (Figure 1E-F) showed that >90% of GFP+ cells expressed Cx3cr1 with a high mean fluorescence intensity (MFI; supplemental Figure 1B), and >85% expressed Cxcr4, but at a much lower MFI. About 78% of GFP+ cells were Ccr3+ (MFIs intermediate to high). Neither Ccr7 nor Cxcr2 were expressed, and <20% of cells were Ccr5+. Hence, Cx3cr1, Cxcr4, and Ccr3 may be relevant to HBA macrophage signaling/function.
To examine whether distinct HBA cells expressed the ligands for these receptors, hematopoietic (HC; CD41+ and/or CD45+), endothelial (EC; CD31+CD41−CD45−), and mesenchymal/other (MC; CD31−CD41−CD45−) cells were sorted (Figure 2A), and quantitative reverse transcription polymerase chain reaction (qRT-PCR) was performed (Figure 2B). Cx3cl1 expression was negligible in HCs and low in MCs, whereas expression in ECs was significantly higher than HCs. The expression of Cxcl12 (ligand of Cxcr4) was significantly higher in MCs than in either ECs or HCs. Ccl3 (ligand of Ccr1/Ccr5) was detected in both HCs and MCs, but not in ECs. Ccl11 (ligand of Ccr3) was weakly expressed in MCs. Together, these results suggest that the Cx3cr1/Cx3cl1 and/or Cxcr4/Cxcl12 signaling axes may be active in the HBA, particularly in recruitment of macrophages to head ECs and/or MCs.
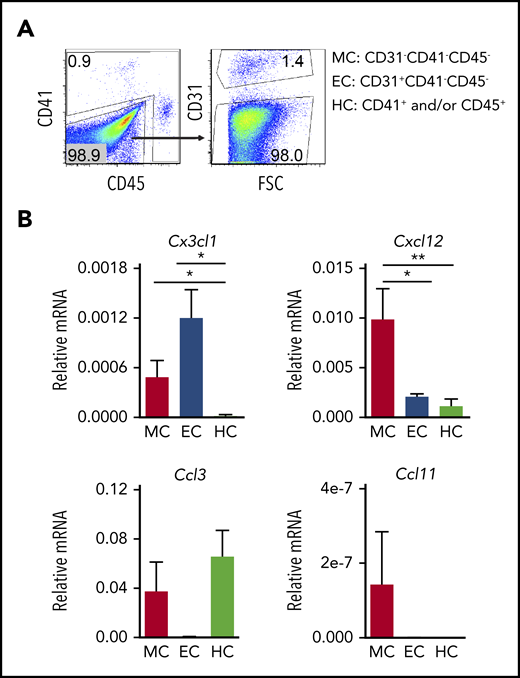
HBA cell subset-specific expression of chemokines at E10.5. (A) Flow cytometric sorting strategy for enrichment of MCs (CD31−CD41−CD45−), ECs (CD31+CD41−CD45−), and HCs (CD41+ and/or CD45+). (B) Relative expression of messenger RNA (mRNA) for chemokine genes Cx3cl1, Cxcl12, Ccl3, and Ccl11 as normalized to actin in E10.5 HBA sorted MC, EC, and HC. Standard error of the mean (SEM) is shown. n = 5; *P < .05; **P < .01.
HBA cell subset-specific expression of chemokines at E10.5. (A) Flow cytometric sorting strategy for enrichment of MCs (CD31−CD41−CD45−), ECs (CD31+CD41−CD45−), and HCs (CD41+ and/or CD45+). (B) Relative expression of messenger RNA (mRNA) for chemokine genes Cx3cl1, Cxcl12, Ccl3, and Ccl11 as normalized to actin in E10.5 HBA sorted MC, EC, and HC. Standard error of the mean (SEM) is shown. n = 5; *P < .05; **P < .01.
HBA macrophages and erythroid progenitors are quantitatively reduced in the absence of Cx3cr1
Cx3cr1 may be involved in the recruitment of yolk sac macrophage progenitors to the brain where they give rise to tissue resident microglia.37,39 Given that >90% of HBA MacGreen macrophages express Cx3cr1 (Figure 1E), we tested whether deficiency of Cx3cr1 affects the percentage of macrophages in the HBA and whether HBA hematopoiesis is affected. The insertion of EGFP in the Cx3cr1 gene reports Cx3cr1 transcription while generating a null allele. No change in viable cell numbers in E10.5 Cx3cr1+/GFP (HT) and Cx3cr1GFP/GFP (KO) HBA were found as compared with WT HBA (supplemental Table 4). However, macrophage percentages in HT (0.73% ± 0.02%) and KO (0.38% ± 0.02%) HBA were significantly reduced (0.15-fold and 0.57-fold, respectively) as compared with WT (0.86% ± 0.07%) (Figure 3A-B). Also, the percentage of phenotypic HPCs (cKit+CD41low) was decreased significantly to 0.42% ± 0.02% in HT and 0.32% ± 0.04% in KO HBA, as compared with WT (0.49% ± 0.09%) (Figure 3A,D; supplemental Figure 2). Functional assessment of the E10.5 HBA demonstrated a significant reduction in the total number of CFU-Cs in KO HBA as compared with WT (Figure 3F). Evaluation of specific colony types revealed statistically significant decreases in erythroid colony numbers in the E10.5 KO HBA as compared with WT. Despite decreased percentages of macrophages (Figure 3C) in the E11.5 HBA, phenotypic HPCs were not reduced (Figure 3E), and CFU-C numbers in the KO were similar to those in the WT HBA (Figure 3G). These data suggest that Cx3cr1-dependent macrophages play a role in erythropoiesis in the HBA prior to or at E10.5, but not thereafter, implicating differential and/or temporal regulation of HBA hematopoiesis.
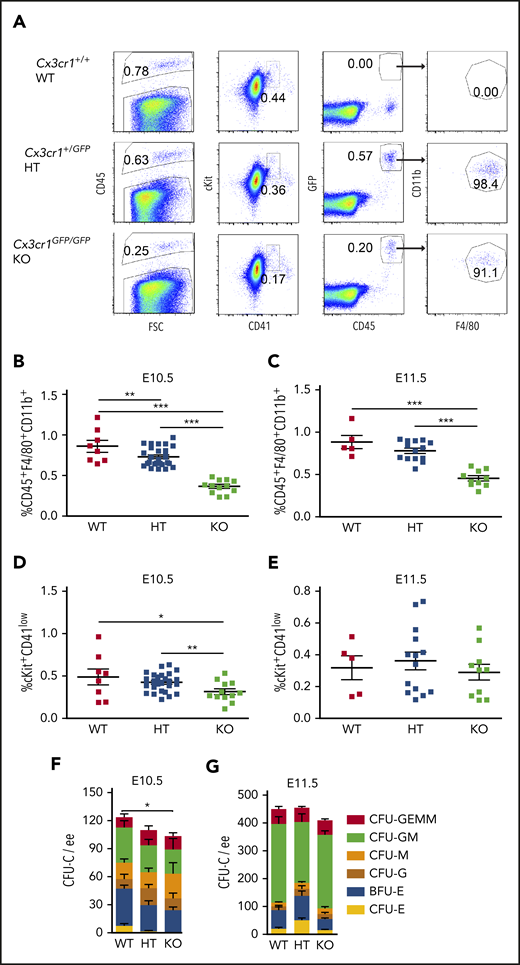
Cx3cr1 deficiency leads to the reduction of hematopoietic progenitors in E10.5 HBA, but not in E11.5 HBA. (A) Representative flow cytometric data and gated areas showing percentages of CD45+ HCs, cKit+CD41low HPCs, GFP+CD45+ cells, and GFP+CD45+CD11b+F4/80+ macrophages in the HBA of Cx3cr1+/+ (WT), Cx3cr1+/GFP (HT, heterozygous mutants), and Cx3cr1GFP/GFP (KO, knockout) E10.5 littermates. The percentage of CD45+CD11b+F4/80+ macrophages in the WT, HT, and KO HBA of (B) E10.5 (31 to 39 sp) and (C) E11.5 (42 to 48 sp) embryos. Each square represents a single HBA. n = 4; **P < .01; ***P < .001. The percentage of cKit+CD41low progenitor cells in WT, HT, and KO HBA of (D) E10.5 and (E) E11.5 littermates. n = 4; *P = .026; **P = .006. Methylcellulose culture data showing the number of CFU-Cs per 1 ee of E10.5 (F) and E11.5 (G) WT, HT, and KO HBA cells. n = 3; *P = .047. Numbers of each colony type are indicated by bar color. BFU-E, burst forming unit–erythroid; E, erythroid; G, granulocyte; GEMM, granulocyte, erythroid, macrophage, megakaryocyte; GM, granulocyte, macrophage; M, macrophage.
Cx3cr1 deficiency leads to the reduction of hematopoietic progenitors in E10.5 HBA, but not in E11.5 HBA. (A) Representative flow cytometric data and gated areas showing percentages of CD45+ HCs, cKit+CD41low HPCs, GFP+CD45+ cells, and GFP+CD45+CD11b+F4/80+ macrophages in the HBA of Cx3cr1+/+ (WT), Cx3cr1+/GFP (HT, heterozygous mutants), and Cx3cr1GFP/GFP (KO, knockout) E10.5 littermates. The percentage of CD45+CD11b+F4/80+ macrophages in the WT, HT, and KO HBA of (B) E10.5 (31 to 39 sp) and (C) E11.5 (42 to 48 sp) embryos. Each square represents a single HBA. n = 4; **P < .01; ***P < .001. The percentage of cKit+CD41low progenitor cells in WT, HT, and KO HBA of (D) E10.5 and (E) E11.5 littermates. n = 4; *P = .026; **P = .006. Methylcellulose culture data showing the number of CFU-Cs per 1 ee of E10.5 (F) and E11.5 (G) WT, HT, and KO HBA cells. n = 3; *P = .047. Numbers of each colony type are indicated by bar color. BFU-E, burst forming unit–erythroid; E, erythroid; G, granulocyte; GEMM, granulocyte, erythroid, macrophage, megakaryocyte; GM, granulocyte, macrophage; M, macrophage.
HBA macrophages promote the expansion and/or maturation of HBA EC-derived HPCs in OP9-DL1-B1 cocultures
As we previously reported, HCs are generated from ECs in the embryonic head5 and in vitro OP9-DL1 cocultures. To test the effect of head macrophages on head EC-derived hematopoiesis, we sorted HBA ECs (CD31+CD41−CD45−) and HBA macrophages (CD45+CD11b+F480+) (supplemental Figure 3A) and cocultured them on OP9-DL1-B1 (Bmp4−/−) stromal cells (Figure 4A). E10.5 HBA (VavCre transgenic) ECs and WT HBA macrophages were used to validate the source of HCs generated in the cultures. Following 7 days of OP9-DL1-B1 coculture, round semiadherent clusters of HCs were microscopically visible in the EC and EC + macrophage (MIX) cell cultures (Figure 4B). Macrophage only cultures did not contain clusters, but 0.12 ± 0.09 × 10³ CD45+ cells remained of the 1 × 10³ input macrophages after 3 and 7 days of culture (supplemental Figure 3B). Whereas EC cultures contained 6.50 ± 1.21 × 10³ CD45+ cells, MIX cultures showed 1.7-fold more CD45+ cells (10.95 ± 2.30 × 10³) (Figure 4C) than the EC cultures, suggesting that macrophage addition increases hematopoiesis.
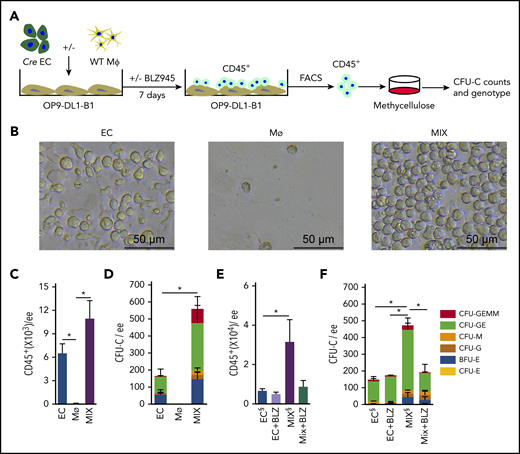
HBA macrophages increase number of HBA EC-derived HPCs. (A) Schematic diagram of the coculture system, with a monolayer of OP9-DL1-B1 cells overlaid with HBA EC, HBA macrophage (MФ), or MIX. One ee of HBA ECs (CD31+CD41−CD45−) and/or 1000 HBA MФ (CD45+CD11b+F480+) were added to each coculture well. After 7 days, nonadherent cells were harvested, FACS sorted, and plated in methylcellulose to quantitate hematopoietic colonies (CFU-C). The genotype of each colony was determined by Cre PCR. (B) Bright field microscopic images show the round morphology and density of HCs after 7 days of OP9-DL1-B1 culture of EC, MФ, or MIX. The number of (C) CD45+ cells and (D) CFU-Cs per ee of E10.5 (31 to 35 sp) HBA cells after 7 days of OP9-DL1-B1 culture of EC, MФ, or MIX. n = 4; *P < .05. The number of (E) CD45+ cells and (F) CFU-Cs per ee of E10.5 HBA from OP9-DL1-B1 culture of EC and MIX with or without Csf1r inhibitor BLZ945 (6.7 nM). BLZ945 (BLZ) is diluted in DMSO. EC& and MIX& have the DMSO& diluent added as a vehicle control. SEM is shown. n = 3, *P < .05. Colony types indicated by color bars.
HBA macrophages increase number of HBA EC-derived HPCs. (A) Schematic diagram of the coculture system, with a monolayer of OP9-DL1-B1 cells overlaid with HBA EC, HBA macrophage (MФ), or MIX. One ee of HBA ECs (CD31+CD41−CD45−) and/or 1000 HBA MФ (CD45+CD11b+F480+) were added to each coculture well. After 7 days, nonadherent cells were harvested, FACS sorted, and plated in methylcellulose to quantitate hematopoietic colonies (CFU-C). The genotype of each colony was determined by Cre PCR. (B) Bright field microscopic images show the round morphology and density of HCs after 7 days of OP9-DL1-B1 culture of EC, MФ, or MIX. The number of (C) CD45+ cells and (D) CFU-Cs per ee of E10.5 (31 to 35 sp) HBA cells after 7 days of OP9-DL1-B1 culture of EC, MФ, or MIX. n = 4; *P < .05. The number of (E) CD45+ cells and (F) CFU-Cs per ee of E10.5 HBA from OP9-DL1-B1 culture of EC and MIX with or without Csf1r inhibitor BLZ945 (6.7 nM). BLZ945 (BLZ) is diluted in DMSO. EC& and MIX& have the DMSO& diluent added as a vehicle control. SEM is shown. n = 3, *P < .05. Colony types indicated by color bars.
Sorted CD45+ cells from the cultures were plated into methylcellulose culture to test for progenitor activity. After 7 days of MIX coculture, a significant 3.4-fold increase in CFU-C number (561.3 ± 138.2 CFU-C/ee) was found as compared with EC cocultures (166.0 ± 52.92 CFU-C/ee) (Figure 4D). We next analyzed the DNA of individual CFU-C from the MIX cultures of Vav-Cre EC and WT CD45+CD11b+F4/80+ macrophages to identify the source of the HPCs. Of the 40 CFU-Cs examined for the Cre transgene by PCR, all were positive, indicating that they were EC derived (supplemental Figure 3C). No CFU-C originated from the macrophages. These data demonstrate that HBA macrophages promote an increase in EC-derived HPCs in vitro.
HBA macrophage depletion influences HS/PC numbers
Using the rationale that >95% of HBA macrophages are Csf1r expressing (Figure 1B) and that Csf1r is not expressed by HSCs or some HPCs in the midgestation embryo40,41 or as we found by 36% of HBA HPCs (supplemental Figure 4B), the Csf1r inhibitor BLZ945 was added to the MIX cultures to test whether macrophage depletion affects HBA HPC numbers. Whereas the number of CD45+ HCs showed little change between BLZ945-treated and vehicle-treated control MIX cultures (Figure 4E), the number of CFU-C was significantly reduced in the BLZ945-treated MIX cultures and was similar to EC-only cultures, as compared with the control MIX cultures (Figure 4F). These results suggest that the in vitro increase in HBA HPCs is dependent on macrophages.
To further examine HBA hematopoiesis in vivo in the absence of macrophages, Csf1r-Cre mice were crossed with RosaDTA mice (lox-stop-lox-diphtheria toxin A). Normal Mendelian ratios of Csf1r-Cre:DTA and WT midgestation embryos were found (supplemental Table 5). The total viable HBA cell number was comparable between Csf1r-Cre:DTA and WT siblings (supplemental Table 6), and viable cell percentages were similar in E9.5 to E11.5 HBA (supplemental Figure 4; Figure 5A). Whereas CD31+CD45− EC percentages were unaffected (Figure 5C) in the E9.5 to E11.5 Csf1r-Cre:DTA HBA and hematopoietic-related gene expression was not affected (E10.5; supplemental Figure 4E), macrophages (CD45+CD11b+F4/80+) were almost completely absent (Figure 5B), indicating the specificity of targeted ablation. Interestingly, the percentage of phenotypic HCs (CD45+CD11b−F4/80−; excludes macrophages) was decreased in the E9.5 to E11.5 Csf1r-Cre:DTA HBA compared with the WT siblings (Figure 5D). CFU-C assays confirmed a decrease in functional HPC, with 3.0 ± 3.0 CFU-C per E9.5 Csf1r-Cre:DTA HBA as compared with 73.3 ± 18.3 CFU-C per WT HBA. Similar decreases in CFU-Cs were found in the E10.5 and E11.5 Csf1r-Cre:DTA HBA (38.5 ± 5.3, 18.0 ± 9.9 per HBA, respectively) compared with control (155.0 ± 47.7, 503 ± 41.8 per HBA) (Figure 5E). These results, together with the results of the coculture system, suggest that macrophages have a positive influence on the expansion and/or maturation of HPCs in the HBA.
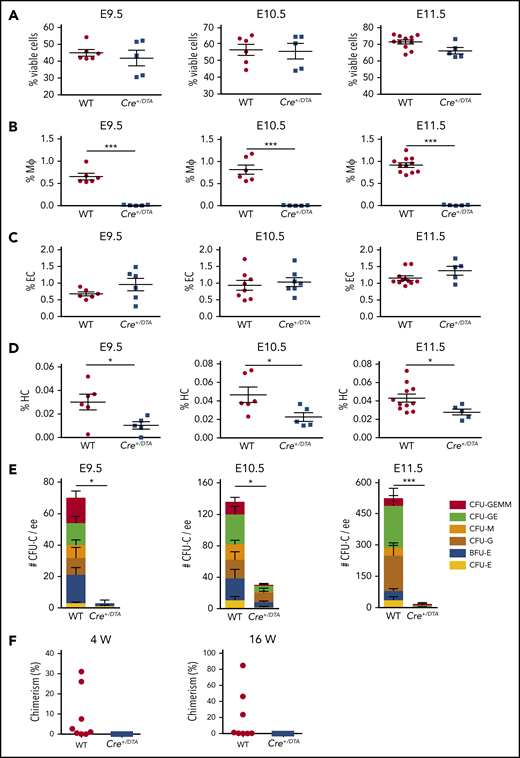
HS/PCs are reduced in the E9.5 to E11.5 HBA in Csf1r-directed DTA depletion. Percentages of (A) viable HBA cells as determined by Hoescht dye exclusion, (B) CD45+F4/80+CD11b+ macrophages, (C) CD31+CD45− ECs, and (D) CD45+F4/80−CD11b− HCs from E9.5 to E11.5 WT and Csf1r-Cre+/DTA (Cre+/DTA) littermates in FACS analysis. Each dot or square represents 1 WT or Cre+/DTA embryo. SEM is shown. n = 3; *P < .05; ***P < .001. (E) CFU-C per ee of HBA cells in E9.5, 10.5, and 11.5 WT and Cre+/DTA littermates. Colony type is indicated by color bars. E9.5 n = 2; E10.5 n = 3; E11.5 n = 3; *P < .05; ***P < .001. (F) Percentage of donor-cell (Ly5.2) chimerism in the peripheral blood of irradiated (Ly5.1) recipients injected with WT or Cre+/DTA E11.5 (44 to 48 sp) HBA cells as determined by Ly5.1/Ly5.2 FACS analysis. Eight recipients received WT (1 to 3 ee) and 8 recipients received Cre+/DTA (1 to 3) HBA cells. Dots and squares indicate individual recipients of WT or Cre+/DTA cells, respectively, that were examined at 4 and 16 weeks (W) posttransplantation. n = 5.
HS/PCs are reduced in the E9.5 to E11.5 HBA in Csf1r-directed DTA depletion. Percentages of (A) viable HBA cells as determined by Hoescht dye exclusion, (B) CD45+F4/80+CD11b+ macrophages, (C) CD31+CD45− ECs, and (D) CD45+F4/80−CD11b− HCs from E9.5 to E11.5 WT and Csf1r-Cre+/DTA (Cre+/DTA) littermates in FACS analysis. Each dot or square represents 1 WT or Cre+/DTA embryo. SEM is shown. n = 3; *P < .05; ***P < .001. (E) CFU-C per ee of HBA cells in E9.5, 10.5, and 11.5 WT and Cre+/DTA littermates. Colony type is indicated by color bars. E9.5 n = 2; E10.5 n = 3; E11.5 n = 3; *P < .05; ***P < .001. (F) Percentage of donor-cell (Ly5.2) chimerism in the peripheral blood of irradiated (Ly5.1) recipients injected with WT or Cre+/DTA E11.5 (44 to 48 sp) HBA cells as determined by Ly5.1/Ly5.2 FACS analysis. Eight recipients received WT (1 to 3 ee) and 8 recipients received Cre+/DTA (1 to 3) HBA cells. Dots and squares indicate individual recipients of WT or Cre+/DTA cells, respectively, that were examined at 4 and 16 weeks (W) posttransplantation. n = 5.
In vivo transplantation assays were performed with cells from E11.5 Csf1r-Cre:DTA HBA to test whether macrophages are involved in HSC development. Whereas the peripheral blood donor cell chimerism in 3 of 8 mice injected with WT HBA cells was >5% at 4 weeks posttransplantation and averaged 22.7% ± 12.3% at 16 weeks posttransplantation, no recipients (0 of 8; n = 5) receiving Csf1r-Cre:DTA HBA cells were donor cell engrafted (Figure 5F). These data support a role for macrophages in HS/PC expansion and/or maturation in the HBA.
Proinflammatory signaling molecules are expressed by HBA cells
Macrophages may function in the HBA through the local secretion of proinflammatory factors such as IL-1 and TNF-α, which have been shown by others to be involved in embryonic hematopoiesis.11,28 To examine proinflammatory factor expression in the HBA (MacGreen embryos), qRT-PCR was performed for IL1α, IL1β, TNFα, and IL-6 on GFP+ cells (mostly macrophages; Figure 1B), other HBA cells (GFP−), and control OP9-DL1-B1 cells. IL1α, IL1β, and TNFα were expressed exclusively by GFP+ cells, whereas IL-6 expression was restricted to OP9-DL1 cells (Figure 6A). Expression was also examined in EC (CD31+CD45−) and macrophage (CD45+CD11B+F4/80+GFP+) (Figure 6B). IL1α, IL1β, and TNFα expression was confirmed in macrophage and only low/no expression in EC. If these proinflammatory factors are involved in the EHT process or hematopoietic growth, receptor expression would be expected on HBA EC or HC. According to the gating strategy in Figure 2A, MC, ECs, and HCs were sorted and tested for expression of IL1 receptors (IL1R1, IL1Rap, IL1R2) and TNFα receptors (TNFR1, TNFR2). All 3 HBA populations expressed IL1R1 and IL1Rap. IL1R2 was highly expressed in HCs, with very little/no expression in MCs and ECs. TNFR1 expression was 4.2-fold higher in ECs as compared with MCs and 2.2-fold higher than HCs. In contrast, TNFR2 was expressed highly in HCs (Figure 6C). These results showing expression of IL1R1, IL1Rap, and TNFR1 on HBA ECs and TNFR2 on HCs suggest that they may respond to macrophage-derived IL-1β and TNF-α.

Genes of proinflammatory pathways are expressed in HBA cells. (A) Relative mRNA expression of IL1α, IL1β, TNFα, and IL-6 normalized to actin in GFP+ (G+) and GFP− (G−) cells in the E10.5 MacGreen HBA as determined by qRT-PCR. OP9-DL1-B1 (DL1) is the negative control. n = 3; *P < .05. (B) Relative mRNA expression of IL1α, IL1β, TNFα, and IL-6 as normalized to actin in macrophages (MΦ, CD45+CD11b+F4/80+Gr1−), ECs (CD31+CD45−) in the E10.5 HBA as determined by qRT-PCR. OP9-DL1-B1 (DL1) is the negative control. n = 4; *P < .05; **P < .01; ****P < .0001. (C) Fold-change in the relative mRNA expression of IL1 and TNF receptor genes (IL1R1, IL1Rap, IL1R2, TNFR1, TNFR2) in E10.5 HBA EC and HCs as compared with MCs. IL1R1, IL1Rap, IL1R2, TNFR2, n = 3; TNFR1, n = 4; *P < .05.
Genes of proinflammatory pathways are expressed in HBA cells. (A) Relative mRNA expression of IL1α, IL1β, TNFα, and IL-6 normalized to actin in GFP+ (G+) and GFP− (G−) cells in the E10.5 MacGreen HBA as determined by qRT-PCR. OP9-DL1-B1 (DL1) is the negative control. n = 3; *P < .05. (B) Relative mRNA expression of IL1α, IL1β, TNFα, and IL-6 as normalized to actin in macrophages (MΦ, CD45+CD11b+F4/80+Gr1−), ECs (CD31+CD45−) in the E10.5 HBA as determined by qRT-PCR. OP9-DL1-B1 (DL1) is the negative control. n = 4; *P < .05; **P < .01; ****P < .0001. (C) Fold-change in the relative mRNA expression of IL1 and TNF receptor genes (IL1R1, IL1Rap, IL1R2, TNFR1, TNFR2) in E10.5 HBA EC and HCs as compared with MCs. IL1R1, IL1Rap, IL1R2, TNFR2, n = 3; TNFR1, n = 4; *P < .05.
Supernatants from cocultures were tested for the presence of proinflammatory factors TNF-α and IL-1β. Enzyme-linked immunosorbent assay analysis showed quantitatively higher levels of TNFα in the macrophage only (2511.0 ± 668.9 fg/mL) and MIX (2049.0 ± 188.3 fg/mL) cultures compared with EC (371.3 ± 231.1 fg/mL) cultures (Figure 7A). Only very low levels of IL-1β protein were found in the 3 cultures (data not shown). Hence, macrophage-produced TNF-α may induce HS/PC generation and/or maturation in the mouse HBA.
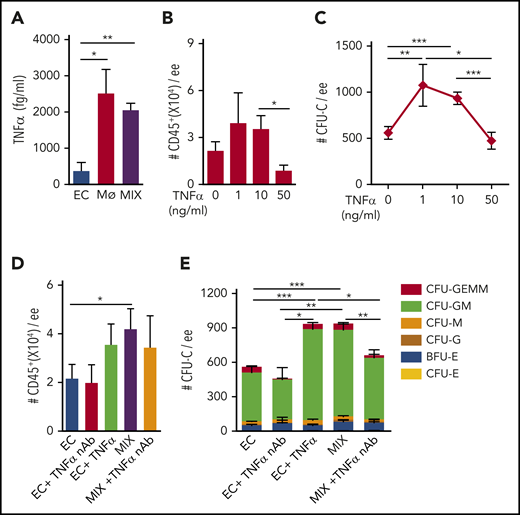
Proinflammatory factors are involved in HBA HC output. (A) Concentration (fg/mL) of TNF-α protein in the supernatant of OP9-DL1-B1 cultures containing E10.5 (34 to 39 sp) HBA EC, MФ, or MIX, as determined by FCAP assay. n = 3; *P = .039; **P = .005. Number of (B) CD45+ cells and (C) CFU-C number per 1 ee of HBA cells in EC cultures supplemented with different TNF-α concentrations. n = 4. Number of (D) CD45+ cells and (E) CFU-C/ee of E10.5 HBA cells in the OP9-DL1-B1 cocultures containing EC, EC+TNF-α nAb (0.4 μg/mL), EC+TNF-α (10 ng/mL), MIX, MIX+TNF-α nAb (0.4 μg/mL). n = 4. Colony types are indicated by color bars. *P < .05; **P < .01; ***P < .001.
Proinflammatory factors are involved in HBA HC output. (A) Concentration (fg/mL) of TNF-α protein in the supernatant of OP9-DL1-B1 cultures containing E10.5 (34 to 39 sp) HBA EC, MФ, or MIX, as determined by FCAP assay. n = 3; *P = .039; **P = .005. Number of (B) CD45+ cells and (C) CFU-C number per 1 ee of HBA cells in EC cultures supplemented with different TNF-α concentrations. n = 4. Number of (D) CD45+ cells and (E) CFU-C/ee of E10.5 HBA cells in the OP9-DL1-B1 cocultures containing EC, EC+TNF-α nAb (0.4 μg/mL), EC+TNF-α (10 ng/mL), MIX, MIX+TNF-α nAb (0.4 μg/mL). n = 4. Colony types are indicated by color bars. *P < .05; **P < .01; ***P < .001.
Proinflammatory factor TNF-α addition to HBA EC cultures increases HPC numbers
To test whether TNF-α could substitute for HBA macrophages, TNF-α was titrated into HBA EC cultures. After 7 days, CD45+ cell numbers were not significantly changed in 1 ng/mL or 10 ng/mL TNF-α–supplemented cultures as compared with the no-TNF-α cultures, but were reduced in 50 ng/mL TNF-α cultures (Figure 7B). However, significant increases in CFU-C numbers (1073.0 ± 225.9 and 931.7 ± 67.6, respectively) were found in cultures with 1 ng/mL or 10 ng/mL TNF-α, compared with no-TNF-α cultures (557.6 ± 68.2). TNF-α cultures (50 ng/mL) yielded similar CFU-C to cultures without TNF-α (Figure 7C).
To validate the effect of TNF-α, we added TNF-α nAb to EC and MIX cultures. CD45+ cell and CFU-C numbers did not change in the EC cultures in the presence of the nAb (Figure 7D-E). In contrast, addition of nAb to MIX cultures showed a significant reduction in CFU-C numbers (659.0 ± 80.6), as compared with MIX (933.9 ± 62.1) and EC + TNF-α (931.7 ± 67.6) control cultures (Figure 7E). These results suggest that TNF-α–secreting macrophages promote expansion and/or maturation of HPCs (mostly GM progenitors) derived from HBA ECs.
Discussion
Our identification of a novel role for macrophages in hematopoiesis in the developing HBA now adds to the known roles of macrophages in the embryonic head, such as vascular networking by tip fusion of ECs22 and neuronal interactions and patterning.42,43 Interestingly, Cx3cr1/Cx3cl1 axis is involved all these developmental processes. Macrophages influence the expansion and/or maturation of HBA HS/PCs and likely regulate this process through production of TNF-α. Although some proinflammatory molecules were shown previously to affect the emergence of HS/PCs in the aorta region of zebrafish and mouse embryos,11,15 this is the first demonstration that macrophages are important cellular regulators of embryonic head hematopoiesis. Because macrophages are involved in neuronal patterning of the embryonic brain,21 our results from early hematopoietic developmental stages may have biomedical relevance for neuropathologies during later life stages.
Macrophages in the embryonic HBA regulate hematopoiesis in vivo
As well as expressing macrophage markers CD11b, F4/80, and CD45, all midgestation HBA macrophages express the Csf1r-GFP reporter. Csf1r-expressing cells were found in close proximity to the CD31+ brain vasculature, and by flow cytometry were found to express high levels of the Cx3cr1, Cxcr4, and Ccr3 chemokine receptors. Interestingly, HBA ECs express Cx3cl1, the ligand for Cx3cr1.
It has been shown that emigration of yolk sac–derived macrophages to the embryonic brain18,19 and to the AGM16 is dependent on the Cx3cr1/Cx3cl1 signaling axis. HCs in the aorta during the time of EHT are decreased/absent in the absence of Cx3cr1, and AGM HPC numbers and HSC in vivo repopulating activity are decreased in Cx3cr1 null embryos.16 Similarly, we found that HPC numbers in the HBA of Cx3cr1 null embryos were significantly reduced. This is likely to be a consequence of decreased macrophage emigration to this region and is supported by the fact that macrophage (CD45+CD11b+F4/80+) percentages were significantly (50%) reduced, and percentages of progenitor cells (cKit+CD41low) were also significantly reduced in the Cx3cr1 null HBA.
We also examined the role of macrophages in HBA hematopoiesis by Cre-Lox targeting diphtheria toxin A (DTA)–mediated ablation to Csf1r+ macrophages. HPC numbers in the Csf1r-DTA HBA were significantly reduced as compared with numbers in WT littermate HBAs. Moreover, no transplantable HSCs were found in Csf1r-DTA HBAs. It is important to note that there was a complete absence of CD45+CD11b+F4/80+ macrophages in the Csf1r-DTA HBA, but viable cells and CD31+CD45− EC percentages were largely unaffected.
Because Csf1r is expressed on multilineage (B, T, and myeloid) progenitors in the embryo, it has been suggested that this receptor plays a role in early hematopoiesis.44,45 Others have recently reported that Csf1r is expressed by and regulates myeloid-primed B-lymphoid progenitors in the mouse fetal liver.46 Single-cell RNA sequencing of highly enriched HS/PCs from mouse embryonic and fetal stages reveals some low Csf1r expression by these cells,47 yet Csf1r cell tracing and other studies suggest that Csfr1 is not expressed by HSCs.16,41 Thus, it is unclear in the HBA whether cells other than macrophages express Csf1r. Our analysis of sorted MacGreen HBA cells revealed that HPCs were distributed in the high-, intermediate-, and negative-expressing fractions (supplemental Figure 4A), and thus, has implications for the use of the in vivo Csf1r targeted DTA ablation model. Within E10.5 HBA, 36% of HPC are Csfr1 negative, 28% are intermediate expressing, and 36% are high expressing. If DTA is directly ablating the high- and intermediate-expressing HPCs, we would expect to find a 64% decrease in the number of CFU-C/HBA. However, a 78% decrease in CFU-C/HBA was found (Figure 5E), leaving open the possibility that some Csf1r-negative HPCs are affected by the absence of macrophages. Further studies are needed to address this.
As compared with DTA-mediated macrophage ablation, which resulted in large reductions in CFU-C numbers/HBA, deficiency of Cx3cr1 had a mild effect, reducing CFU-C numbers by only 10%. The differences are likely due to the fact that in addition to Cx3cr1/Cx3cl1, several other chemokines/ligands are playing roles in recruiting macrophages/progenitors to the HBA. Indeed, not only are Cx3cr1 and its ligand expressed in macrophages and ECs, respectively, but also Cxcr4 and its ligand Cxcl12, respectively, are expressed in macrophages and MCs of embryonic head. The Cxcr4/Cxcl12 axis maintains the HSC pool in the adult bone marrow, and hence, it may play an HS/PC maintenance role in the HBA.
Macrophages promote increases in HPC numbers from HBA ECs in vitro
Vascular structures in the embryonic head are complex. Unlike the aorta, in which HC clusters have been found in close association with the vascular endothelium, only single HCs have been found in association with the embryonic head vasculature.6,48 Three-dimensional composite images of the whole Csf1r-GFP embryonic head show a close association of GFP+ macrophages with CD31+CD45− ECs, suggesting an influence of macrophages in the HBA in vivo. We used an in vitro coculture system to test for the effects of macrophages on HCs and HPCs arising from HBA ECs. Like aortic ECs, cultures of HBA ECs show that the head vasculature produces HS/PC. A significant threefold increase in HPCs in MIX cocultures was found, as compared with ECs alone. When a Csf1r inhibitor was added, it blocked the promotion of HPC expansion. This could be due to the direct effects of the inhibitor on macrophages or may be due to direct effects of the inhibitor on Csfr1 expressing HPCs. Interestingly, the same number of CFU-C/HBA was found as those produced by the EC-only cultures; thus, the HBA contains some Csf1r independent HPC. The interaction of HBA macrophages with HBA EC may, in addition to increasing HPC numbers, influence EC hematopoietic fate induction. We have attempted to examine this issue in the OP9-DL1-B1 MIX and EC cultures. Preliminary results indicate that the number of hematopoietic-like clusters generated after 3 or 7 days of MIX cultures increases by a factor of 2 compared with the EC cultures (the number of cells per cluster does not change). Continuous vital imaging of EC and HC at the single-cell level in MIX cultures is necessary to resolve this issue.
Actions of proinflammatory factors on HBA hematopoiesis
Within the cells of the HBA, we found that the proinflammatory factor TNF-α was most highly and specifically expressed by macrophages. HBA ECs express their cognate receptors. Supplementation of HBA EC cultures with TNF-α resulted in more HPCs: HPC numbers were increased to the same degree as when macrophages were added to the culture. Moreover, a TNF-α blocking antibody when added to the MIX cocultures reduced HPC numbers to those found in EC-only cocultures. Our data are consistent with a previous report in which TLR stimulations in embryos resulted in the secretion of cytokines, including TNF-α, from macrophages.49 Other groups have shown that neutrophil-derived TNF-α in zebrafish embryos is required for HS/PC specification,11 and that TNF-α in adult mouse bone marrow granulocytes promotes vascular and hematopoietic regeneration.50 However, the role for the TNF signaling pathway in HSC maintenance is controversial. In a TNF loss-of-function in vivo model, 1 group showed that TNF plays a stimulatory function on HSC maintenance.51 In contrast, another group showed that TNF is a suppressor of normal HSC activity in vitro and in vivo.52-55 In our coculture system, the observed positive influence of TNF-α on CD45+ cell numbers is concentration dependent: low and intermediate concentrations of TNF-α increased CFU-C number/HBA, whereas a high concentration showed the same CFU-C number/HBA as in the absence of TNF-α. Thus, the concentration of active TNF-α may explain the conflicting results in the literature. In the HBA, it is likely that TNF-α exerts its positive influence on the HPC in vitro through factor concentration gradients elicited through the direct interaction with or proximity of macrophages.
Along with IL-1β, which we have shown here is expressed by HBA macrophages, factors such as IFNγ and prostaglandin E2 that have been shown to regulate HSC production of zebrafish and mouse AGM HSCs15,56,57 would be interesting to examine in the HBA for effects on endothelial to hematopoietic transition and HPC function. Together with transcriptome profiling of HBA macrophages, it may be possible to identify the combination and balance of different factors regulating hematopoiesis at different sites of embryonic development.
For original data, please contact the corresponding authors.
The online version of this article contains a data supplement.
The publication costs of this article were defrayed in part by page charge payment. Therefore, and solely to indicate this fact, this article is hereby marked “advertisement” in accordance with 18 USC section 1734.
Acknowledgments
The authors thank all laboratory members for helpful comments, A. Maglitto for assistance with mouse irradiations, and A. Hang for helping with qRT-PCR. The authors also thank J. W. Pollard for the contribution of MacGreen, CX3CR1-GFP, and CSF1r-Cre mice, G. Kassiotis for ROSAloxDTA mice, and the QMRI Flow Cytometry Facility for technical support for FACS.
These studies were supported by European Research Council Advanced Grant (ERC AdG) 341096 (E.D.) and a grant from the National Natural Science Foundation of China (81870087) and the National Key Research and Development Program of China Stem Cell and Translational Research (SQ2019YFA0111100).
Authorship
Contribution: E.D. and Z.L. conceived the project, designed the experiments, and wrote the manuscript; S.A.M. provided some reagents, helped design some experiments, and discussed data; C.R.-S. performed some qRT-PCR, FACS, and progenitor and transplantation experiments and discussed data; W.H. and X.N. helped perform some coculture experiments; C.S.V. performed irradiations; and B.L. gave material support.
Conflict-of-interest disclosure: The authors declare no competing financial interests.
Correspondence: Elaine Dzierzak, University of Edinburgh, Centre for Inflammation Research, Queens Medical Research Institute, 47 Little France Crescent, Edinburgh, EH16 4TJ, United Kingdom; e-mail: elaine.dzierzak@ed.ac.uk; and Zhuan Li, Southern Medical University, School of Basic Medical Sciences, Department of Developmental Biology, Guangzhou, China; e-mail: zhuanli2018@smu.edu.cn.


