Key Points
Transcriptomes and enhancers of human CD4+ Tfh and non-Tfh T effector cells reveal cell type–specific differences.
These data are a significant resource for understanding mechanisms of normal and perturbed Tfh cell function.
Abstract
T follicular helper (Tfh) cells are a subset of CD4+ T helper cells that migrate into germinal centers and promote B-cell maturation into memory B and plasma cells. Tfh cells are necessary for promotion of protective humoral immunity following pathogen challenge, but when aberrantly regulated, drive pathogenic antibody formation in autoimmunity and undergo neoplastic transformation in angioimmunoblastic T-cell lymphoma and other primary cutaneous T-cell lymphomas. Limited information is available on the expression and regulation of genes in human Tfh cells. Using a fluorescence-activated cell sorting–based strategy, we obtained primary Tfh and non-Tfh T effector cells from tonsils and prepared genome-wide maps of active, intermediate, and poised enhancers determined by chromatin immunoprecipitation–sequencing, with parallel transcriptome analyses determined by RNA sequencing. Tfh cell enhancers were enriched near genes highly expressed in lymphoid cells or involved in lymphoid cell function, with many mapping to sites previously associated with autoimmune disease in genome-wide association studies. A group of active enhancers unique to Tfh cells associated with differentially expressed genes was identified. Fragments from these regions directed expression in reporter gene assays. These data provide a significant resource for studies of T lymphocyte development and differentiation and normal and perturbed Tfh cell function.
Introduction
T follicular helper (Tfh) cells are a subset of CD4+ T helper (Th) lymphocytes that migrate into the B-cell follicle and provide germinal center (GC) B cells with survival and differentiation signals essential for B-cell selection with maturation into memory B cells and long-lived antibody-secreting plasma cells.1-8 Tfh cells also secrete cytokines that enable B-cell isotype class switching appropriate to invading pathogens.5,8,9 Tfh cells can be distinguished from other Th cells by downregulation of P-selectin glycoprotein ligand 1 (PSGL-1), required for their emigration from T-cell zones of secondary lymphoid organs toward the B-cell follicle, and by their sustained expression of the transcriptional repressor B-cell lymphoma 6 (BCL6), the C-X-C chemokine receptor type 5 (CXCR5) needed for their migration into the follicle, and the programmed cell death receptor (PD-1) necessary for proper B-cell maturation therein in GCs.10,11 Although Tfh cells are essential for the GC response, much less is known about their origin, development, and function compared with other CD4 Th cell subsets.12
Tfh cells are abnormally regulated in several inherited and acquired diseases.13,14 Expansion of dysfunctional Tfh cells is a major contributor to systemic autoimmunity, including systemic lupus erythematosus (SLE; lupus), Sjogren syndrome, and rheumatoid arthritis.15,16 Their malignant transformation results in the phenotype of angioimmunoblastic T-cell lymphoma (AITL), a subset of peripheral T-cell lymphoma (PTCL).17-21 Tfh cells are thought to be the origin of subtypes of primary cutaneous T-cell lymphoma.22,23 A possible contributory role for Tfh cells in graft-versus-host disease also has been suggested.24
Recent advances in genomic technologies have revolutionized our understanding of gene expression and gene regulation, and their relationship to mechanisms of human disease.25 Detailed information on cellular transcriptomes obtained by RNA sequencing (RNA-seq) provides unbiased information on transcript composition and abundance, including detection of novel transcripts, novel isoforms, alternative splicing, and allele-specific expression.26-28 Similarly, genomic strategies have allowed understanding of programs controlling cellular development and differentiation by providing insight into the regulatory DNA sequences that control or regulate these programs.
Enhancers are DNA regulatory sequences with numerous, complex roles in the control of gene expression,29-32 participating in cellular development, differentiation, and cell fate determination.33-36 They assist in determining nuclear organization,32 transcription initiation, and the release of RNA polymerase II from promoter pausing,37 transcriptional competence,35 and insulator element activity.38,39 Noncoding RNAs have also been linked to enhancer function40-46 and intergenic enhancers may act as alternate, tissue-specific promoters generating abundant, spliced, multiexonic poly(A)+ RNAs.47 Secondary enhancers synergize with primary enhancers to fine-tune gene expression.48,49 Recent studies in 3-dimensional transcriptional space reveal that turning on and off enhancers during development correlates with promoter activity and that promoter-enhancer interactions are highly cell-type specific varying widely across the genome.50-53
Numerous studies characterizing enhancers in human lymphoid cells on a genome-wide scale have been performed.54-64 Despite their biologic relevance, data are not available for human primary Tfh cell enhancers, perhaps because of the difficulty in obtaining adequate samples for analysis. Obtaining sufficient numbers from mice is also challenging, in light of the challenge differentiating these cells in vitro, in comparison with other Th cell subsets.65 Using a fluorescence-activated cell sorting (FACS)-based strategy, we obtained Tfh cells, and for comparison, non-Tfh T effector cells (hereafter, T effector or Teff cells) from tonsils. Using these purified samples, we constructed and analyzed genome-wide maps of active, intermediate, and poised enhancers, with integration of global transcriptome analyses determined by RNA-seq. Consistent with their predicted function, these important regulatory elements were enriched near genes highly expressed in lymphoid cells or involved in lymphoid cell structure and function. Many Tfh cell enhancers mapped to sites previously associated with autoimmune disease in genome-wide association studies (GWAS). A group of differentially marked active enhancers unique to Tfh cells associated with differentially expressed genes was identified. This group contained genes expressed at high levels, including PDCD1 and BCL6, which are critical for Tfh cell function. Fragments from several enhancer regions were also associated with directed statistically significant expression in reporter gene assays.
Together, these data provide a significant resource for studies of programs of gene expression in Tfh and non-Tfh Teff cells and their regulation. This will allow a deeper understanding of CD4+ lymphocyte development, differentiation, structure, and function, mechanisms of the GC response, and provide insights into normal and perturbed Tfh cell function including that associated with immune disorders and lymphomas.
Methods
Flow cytometry and cell sorting
To obtain primary human Tfh and Teff cells, human tonsils were cut into small sections and homogenized by crushing followed by straining through a 40-μM nylon filter. CD4+ T lymphocytes were enriched using a negative selection biotin-based magnetic separation kit (EasySep; StemCell Technologies) prior to cell surface staining with the antibodies to: CD4 (clone RPA-T4), CD45RA (clone HI-100), T-cell receptor β (TCRβ; clone IP26), PD-1 (clone EH12.1), CXCR5 (clone RF8B2), and PSGL-1 (clone KPL-1; all from BD Biosciences). Staining of CXCR5 was performed at room temperature (25°C) with 1-hour incubation. Intracellular staining for Foxp3 was performed using the Foxp3/Transcription Factor Staining Buffer Set (eBiosciences) following the manufacturer’s protocol. Stained and rinsed cells were analyzed using an LSRII Multilaser Cytometer (BD Biosciences) or specific populations were sorted using a FACSAria (BD Biosciences).
Cell selection and RNA analyses
RNA was isolated from lymphocytes and prepared for RNA-seq analyses as described.66 Samples were sequenced on an Illumina HiSequation 2000 using 75-bp paired-end reads. FASTQ format sequencing reads were aligned to the hg19 genome, NCBI Build 37, using TopHat Version 2.0.4 software with default parameters except minimum anchor length of 12. The EdgeR program was used to identify differences in expression of RefSeq transcripts. Filtering included transcripts with >1 tag per million reads in 3 or more samples. Quantitative real-time polymerase chain reaction (PCR) was performed to confirm expression levels of RNA transcripts (supplemental Table 1, available on the Blood Web site). Gene set enrichment analysis (GSEA) was performed as described using default parameters except 10 000 permutations were performed.67
Chromatin immunoprecipitation
Chromatin immunoprecipitation (ChIP) assays were performed as previously described.68 Samples were immunoprecipitated with antibodies against monomethyl histone 3 lysine 4 (H3k4me1; Abcam), trimethyl histone 3 lysine 27 (Abcam), acetyl histone 3 lysine 27 (H3K27Ac; Abcam), and nonspecific rabbit immunoglobulin G (IgG; Santa Cruz Biotechnology).
High-throughput sequencing and data analyses
DNA processing and high-throughput sequencing were performed as described.66 Sequenced reads were mapped to the human genome (hg1969 NCBI Build 37) using the BWA alignment program. The Model-based Alignment of ChIP-Seq (MACS) program version 1.4.0rc2 was used to identify H3K4me1 and H3K27Ac peaks with a P value of <10e-5.70 The MACS2 program version 2.0.10.20131216 was used to identify broad regions bound by H3K27me3 that had an enrichment of fourfold or more. Localization of histone modifications relative to known genes was done using customized BedTools scripts. Motif finding was performed using the Homer algorithm (http://homer.salk.edu/homer/motif/). Conservation analyses were performed using PhastCons.71,72 The Genomic Regions Enrichment Annotations Tool (GREAT) was used to analyze functional significance of cis-regulatory regions identified by ChIP sequencing (ChIP-seq).73
Validation of ChIP-seq results
Primers were designed for representative binding regions for all 3 antibodies in candidate enhancers identified by the MACS program (supplemental Table 2). Immunoprecipitated DNA was analyzed by quantitative real-time PCR (iCycler; Bio-Rad) as described.68
Identification and analysis of biologically relevant SNPs
The locations of single nucleotide polymorphisms (SNPs) shown to demonstrate highly significant linkage to immune disorder-related traits (supplemental Table 3) were obtained from the UCSC genome browser database and the catalog of published GWAS compiled by the National Human Genome Research Institute (NHGRI; www.genome.gov/gwastudies).74 Using BedTools software, enhancers were intersected with immune disorder–related SNPs and overlap identified.
Reporter gene assays
Candidate enhancer regions were amplified using primers flanking the boundaries of called peaks (supplemental Table 4) and cloned upstream of an SV40 promoter-firefly luciferase reporter cassette in the pGL2Promoter plasmid. Transfections were performed as described.75 A total of 107 Jurkat cells (TIB-152; ATCC) were transfected by electroporation with a single pulse of 300 V at 950 μF with 15 μg of test plasmid and 0.3 µg of pRL-TK, a reporter plasmid expressing Renilla luciferase driven by the herpes simplex virus thymidine kinase (HSV-TK) promoter (Promega) as described.76 Two days after transfection, cell extracts were analyzed using the Dual-Luciferase assay according to the manufacturer’s instructions (Promega).
Data access
The raw data files generated by the RNA-seq and ChIP-seq analyses have been submitted to Gene Expression Omnibus (GEO; http://www.ncbi.nlm.nih.gov/geo/, reference series GSE58597).
Results
Transcriptome analyses of primary human naive, Tfh, and Teff cells by RNA-seq
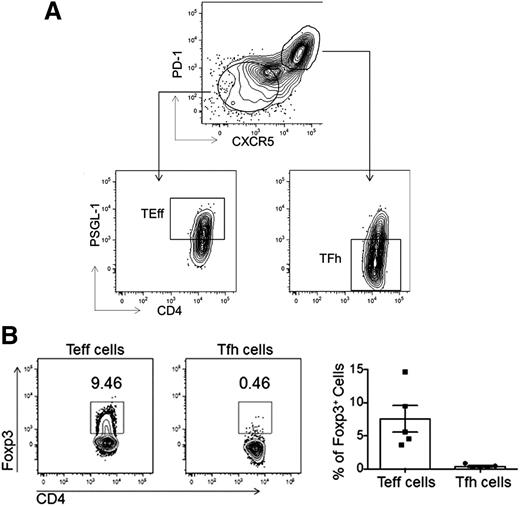
Human primary naive (CD4+CD45RA−TCRβ+), Tfh (CD4+CD45RA−TCRβ+PD-1hiCXCR5hiPSGL-1lo), and Teff cells (CD4+CD45RA−TCRβ+PD-1loCXCR5loPSGL-1hi) were isolated from human tonsils using the sorting strategy described (Figure 1A). A population of T follicular regulatory (Tfr) cells which exhibit a phenotype similar to Tfh cells, that is, CXCR5hi and PD-1hi expression, may be present within our sorted Tfh cell fraction. To quantify the amount of Tfr cells in our sorted Tfh cell population, we performed intracellular staining for Foxp3 in Tfh cells from 5 different tonsils and found that Tfr cells (CD4+CD45RA−PD-1hiCXCR5hiPSGL-1loFoxp3+) comprised <0.5% of the tonsillar Tfh cell population (P < .0079; Figure 1B). Thus, the small numbers of Tfr cells found in the Tfh cell sorting gate should not significantly bias our transcriptome and genomic analyses.
FACS. (A) Primary human Tfh, Teff, and naive T-cell populations were isolated from tonsil via FACS as shown. (B) Intracellular staining for Foxp3 was used to identify the percentage of Tfr cells within the Tfh cell population. Representative flow cytometry plots (left) show the percentages of Foxp3+ Tfh or Teff cells in the tonsils using the gating strategy as described in panel A, with data quantified from 5 different patients (right).
FACS. (A) Primary human Tfh, Teff, and naive T-cell populations were isolated from tonsil via FACS as shown. (B) Intracellular staining for Foxp3 was used to identify the percentage of Tfr cells within the Tfh cell population. Representative flow cytometry plots (left) show the percentages of Foxp3+ Tfh or Teff cells in the tonsils using the gating strategy as described in panel A, with data quantified from 5 different patients (right).
RNA was isolated and RNA-seq performed to obtain the transcriptome of Tfh, Teff, and naive T cells. Multidimensional scaling was performed on expressed genes (>1 cpm in 3 or more samples) to assess sample relatedness. Samples from each cell type clustered together (Figure 2A), indicating that samples from each cell type were closely related and distinct from the other cell types. Quantitative real-time PCR validated expression levels of representative messenger RNA (mRNA) transcripts detected by RNA-seq (supplemental Table 5). Overall, 11 839, 12 007, and 12 202 transcripts were expressed in Tfh, Teff, and naive T-cell RNA, respectively, with 11 307 expressed in all 3 cell types (supplemental Figure 1).
Transcriptome analyses: human primary Tfh, Teff, and naive T cells have distinct expression profiles. (A) Tfh, Teff, and naive T-cell transcriptomes were obtained by RNA-seq and subjected to multidimensional scaling analysis of expressed genes. Symbols representing 3 or 4 biologic replicates of Tfh (red squares), Teff (blue circles), and naive T cells (green triangles) clustered together, indicating that samples from each cell type are closely related and distinct from the other cell types. (B) Venn diagram display of differentially expressed genes. (C) Heat map display of gene expression patterns of differentially expressed genes. Red represents elevated expression while blue represents decreased expression, compared with the row mean. Each column represents a biologic replicate. Genes displayed in panels B and C were selected based on fold changes of 2 or more and FDR adjusted P value < .05 between cell types. (D) RNA coverage profiles of representative differentially expressed genes. FDR, false discovery rate.
Transcriptome analyses: human primary Tfh, Teff, and naive T cells have distinct expression profiles. (A) Tfh, Teff, and naive T-cell transcriptomes were obtained by RNA-seq and subjected to multidimensional scaling analysis of expressed genes. Symbols representing 3 or 4 biologic replicates of Tfh (red squares), Teff (blue circles), and naive T cells (green triangles) clustered together, indicating that samples from each cell type are closely related and distinct from the other cell types. (B) Venn diagram display of differentially expressed genes. (C) Heat map display of gene expression patterns of differentially expressed genes. Red represents elevated expression while blue represents decreased expression, compared with the row mean. Each column represents a biologic replicate. Genes displayed in panels B and C were selected based on fold changes of 2 or more and FDR adjusted P value < .05 between cell types. (D) RNA coverage profiles of representative differentially expressed genes. FDR, false discovery rate.
EdgeR, a Bioconductor software package for examining differential expression of replicated count data, identified the differentially expressed transcripts among the 3 cell types (Figure 2B). These genes were sorted by absolute differences (fold change) in their expression (supplemental Table 6) and heat maps displaying patterns of differentially expressed genes prepared (Figure 2C, supplemental Figure 2). Several of the most differentially expressed genes with increased expression in Tfh cells encoded proteins critical for Tfh cell function including PDCD1, CXCR5, and BCL6 (Figure 2D), validating our sorting strategy. In parallel, several differentially expressed genes, including CCR7 and IL7R, exhibited increased expression in Teff cells, consistent with their phenotype (Table 1). The top 4 functional networks, as assessed by ingenuity pathway analysis (IPA) of differentially expressed genes between Tfh and Teff cells, all with scores ≥30, included cell movement, hematological system development and function, and immune cell trafficking (network 1); cellular development, hematological system development and function, and hematopoiesis (network 2); cell cycle, dermatological diseases, and gastrointestinal disease (network 3); and hematological system development and function, immune cell trafficking, and inflammatory response (network 4). The top categories associated with the category Diseases and Disorders included inflammatory response, connective tissue disorders, skeletal and muscular disorders, inflammatory disease, and immunological disease.
GSEA
AITL is a subtype of PTCL with a molecular signature indicating origin from Tfh cells.20,77-82 To better understand Tfh cell gene expression in AITL, we performed GSEA using a gene set containing genes upregulated in Tfh cells compared with Teff cells. We compared 37 AITL samples from the data set GSE19069,77 to the 60 non-AITL samples, primarily containing other malignancies of T-cell origin, in the data set (supplemental Figure 3). The normalized enrichment score, which reflects the degree to which a gene set is overrepresented at the top or bottom of a ranked list of genes, was 2.02 (P < .00001) indicating highly significant enrichment of Tfh cell–expressed genes in the AITL samples.
H3K4me1, H3K27me3, and H3K27Ac occupancy in Tfh and Teff cell chromatin
ChIP-seq was performed with antibodies for H3K4me1, H3K27me3, and H3K27Ac using primary Tfh and Teff cell chromatin to generate genome-wide maps of histone architecture. The MACS program was used to identify peaks with a cutoff of P < 10e-5. Validation of histone modification enrichment at selected peaks identified by ChIP-seq was performed by quantitative ChIP PCR for all 4 antibodies (supplemental Table 7).
Identification of multiple classes of Tfh and Teff cell enhancers
Enhancers are frequently marked by monomethylation of lysine 4 of histone H3 (H3K4me1), with further classification as active and poised. Active enhancers are dynamic participants in gene expression whereas poised enhancers participate in gene expression in response to various cellular stimuli, for example, differentiation cues. Zentner and colleagues refined this classification, further classifying enhancers as active, poised, and intermediate based on chromatin architecture, conservation, genomic location, levels of gene expression of associated genes, and predicted function of associated genes.83,84
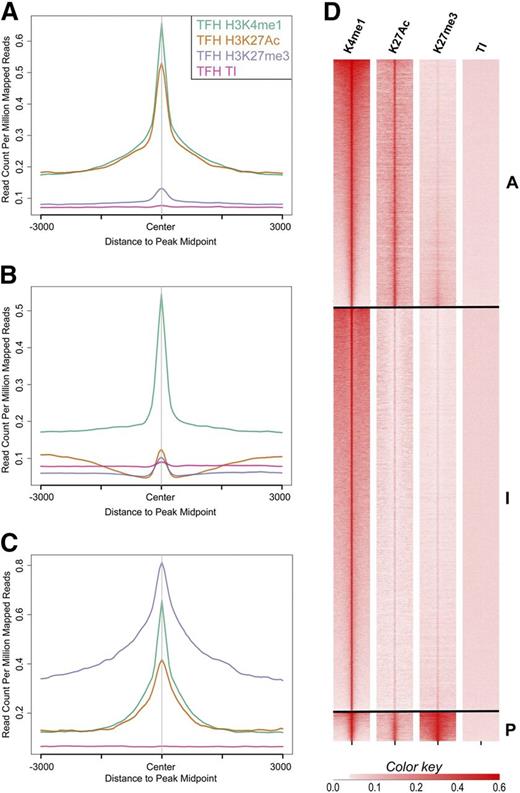
Using these definitions, we identified and classified Tfh and Teff cell enhancers as active, intermediate, and poised. There were 17 229 active, 28 098 intermediate, and 2055 poised enhancers in Tfh cells and 16 707 active, 14 555 intermediate, and 940 poised enhancers in Teff cells. Aggregate plots of each enhancer class centered on peaks of H3K4me1 demonstrated high amounts of H3K27Ac in active enhancers and enrichment of H3K27me3 in poised enhancers (Figure 3A-C). Heat maps generated by ranked plots averaged across rows of HeK4me1, H3K27Ac, and/or H3K27me3 peaks revealed patterns of distinct chromatin architecture characteristic of the enhancer classes (Figure 3D).
Histone-modification density and enhancer class in human primary Tfh cell chromatin. The signal density of H3K4me1, H3K27Ac, H3K27me3, and background TI chromatin is plotted relative to the H3K4me1 peak. (A-C) The average signal over all enhancers in the active, intermediate, and poised enhancer classes, respectively. (D) Signal for each enhancer in the active (A), intermediate (I), and poised (P) enhancer classes. TI, total input.
Histone-modification density and enhancer class in human primary Tfh cell chromatin. The signal density of H3K4me1, H3K27Ac, H3K27me3, and background TI chromatin is plotted relative to the H3K4me1 peak. (A-C) The average signal over all enhancers in the active, intermediate, and poised enhancer classes, respectively. (D) Signal for each enhancer in the active (A), intermediate (I), and poised (P) enhancer classes. TI, total input.
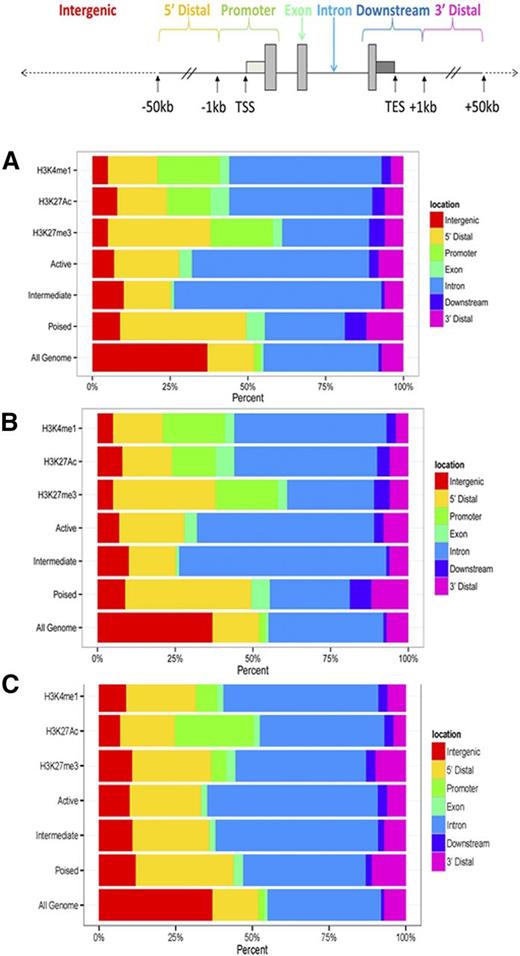
The human genome was portioned into seven bins relative to RefSeq genes corresponding to exons, introns, promoters, distal (-1 to −50kb), downstream (+1 to +50kb), and intergenic regions. Sites of specific histone modifications and enhancer class were assigned to these bins and percentages calculated (Figure 4A). In Tfh cells, poised enhancers were less frequently found in introns, but were found more frequently in the 5′ and 3′ distal regions of associated genes. Similar localization of poised enhancers was observed in Teff cells (Figure 4B).
Distribution of histone modifications, and active, intermediate, and poised enhancers in human primary Tfh and Teff cell chromatin. The human genome was portioned into 7 bins relative to RefSeq genes. The percentage of the human genome represented by each bin was color coded, and the distribution of peaks of each histone modification and enhancer class, active, intermediate, and poised, in each bin graphed on the color-coded bar. (A) Tfh cells. (B) Teff cells. (C) K562 cells are included as a nonlymphocyte, hematopoietic cell type for comparison. TES, transcriptional end site.
Distribution of histone modifications, and active, intermediate, and poised enhancers in human primary Tfh and Teff cell chromatin. The human genome was portioned into 7 bins relative to RefSeq genes. The percentage of the human genome represented by each bin was color coded, and the distribution of peaks of each histone modification and enhancer class, active, intermediate, and poised, in each bin graphed on the color-coded bar. (A) Tfh cells. (B) Teff cells. (C) K562 cells are included as a nonlymphocyte, hematopoietic cell type for comparison. TES, transcriptional end site.
Expression and function of genes associated with enhancer classes in Tfh and Teff cells
Typically, cell and tissue-type specific enhancers act over distances of tens to hundreds of kilobases.85 Thus, bona fide Tfh and Teff cell enhancers are expected to be enriched in the genomic vicinity of genes that are expressed and functional in their respective cells.86-88 To determine whether Tfh and Teff cell enhancers are localized in this manner, gene expression in Tfh and Teff cells was correlated with each enhancer class. To exclude gene promoters, localization of H3K4me1 within 1 kb of annotated transcriptional start sites (TSSs) was excluded from the analyses. There was a statistically significant higher expression of genes with active enhancers 1-50 kb from a TSS compared with expression of genes associated with active enhancers >50 kb of a TSS in Tfh and Teff cells (both P values <2.2e-16, supplemental Figure 4A-B). Levels of gene expression of associated genes were highest for active enhancers and lowest for poised enhancers, with levels of expression between these values for intermediate enhancers in Tfh cells 1-50 kb and >50 kb of a TSS.
We also examined whether enhancers were enriched near genes with known Tfh and Teff cell function. We performed a statistical enrichment analysis of functional gene annotations associated with each type of enhancer class.73 Tfh cell active and intermediate enhancers were associated with genes linked to immune cell-related biological functions whereas poised enhancers were associated with genes involved in cellular development and differentiation (supplemental Figure 5A). The top enriched phenotypes linked to genes associated with Tfh cell active enhancers were immune and lymphocyte-related phenotypes (Table 2). Teff cell active enhancers were associated with genes linked to immune signaling, Teff intermediate enhancers were associated with genes linked to immune responses, and poised Teff enhancers were associated with genes linked to transcription (supplemental Figure 5B).
Conservation analyses by enhancer class
Conservation plots using PhastCons conservation scores with the 46-way vertebrate hg19 multiple alignment PhastCons track were constructed for each enhancer class of Tfh and Teff cells. Similar to results previously observed,84 only poised enhancers showed strong conservation in both cell types (supplemental Figure 6).
Motif enrichment
The Homer program was used to identify overrepresented DNA/transcription factor motifs at sites of candidate enhancers. The top overrepresented motifs at sites of active enhancers in Tfh cells were ETS, ZIC2, TLX, and MEF2C with overrepresentation of ETS, RUNX1, and DCE in Teff cells (supplemental Figure 7).
Enhancer classes and biologically relevant SNPs
We explored whether SNPs associated with biologically relevant immune cell traits and with immune cell traits were enriched in Tfh cell enhancers. We used the set of noncoding SNPs from the GWAS catalog of the NHGRI (www.genome.gov/gwastudies),74 and we collected a data set of immune-associated noncoding SNPs. (see “Methods”; there are 1514 SNPs associated with these terms from the GWAS catalog.) Currently, the functional significance of the overwhelming majority of these SNPs is unknown. SNP locations were compared with the locations of Tfh cell enhancers. For active Tfh enhancers, there was association with 321 SNPs in the GWAS catalog with 86 (5.7%) related to immune cell traits (supplemental Table 8). For intermediate Tfh enhancers, there was association of 197 SNPs in the total GWAS catalog with 38 (2.5%) related to immune cell traits. For poised Tfh enhancers, there were no SNPs linked to immune cell traits (supplemental Table 8). Examples of immune disease-associated SNPs with Tfh cell active enhancers are shown in supplemental Figure 8.
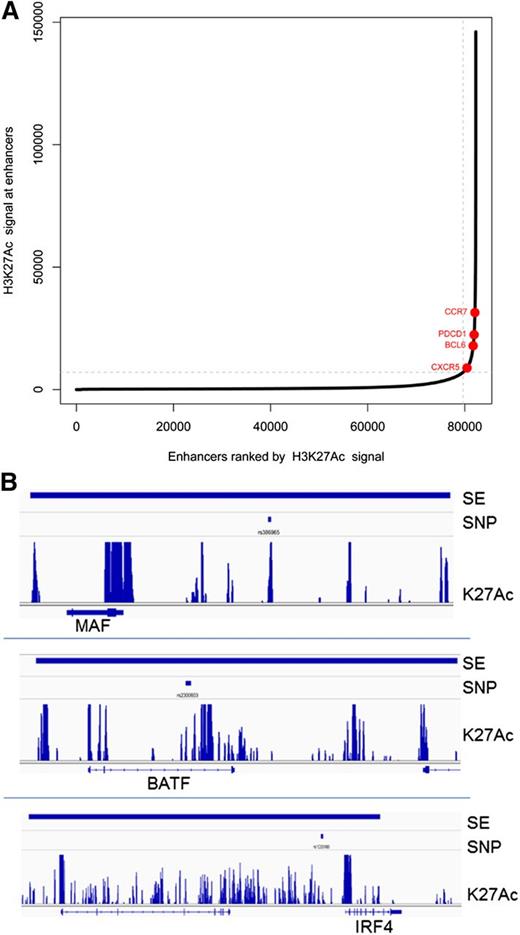
A subset of enhancers, called superenhancers or stretch enhancers, important for regulating genes critical for cell type–specific identity, have been described.89,90 Superenhancers span large regions of chromatin, have domains of transcription factor binding sites, and are marked by significant amounts of H3K4me1 and H3K27Ac modification. We identified superenhancers in Tfh cell chromatin as described by finding regions with the highest levels of clustered, K27 acetylated chromatin (Figure 5).89,91 In some cell types, disease-associated SNPs are enriched in superenhancers of relevant cell types, suggesting that altered expression of key cell identity genes may contribute to disease phenotype.90,91 For Tfh cell superenhancers, there was association with 893 SNPs in the total GWAS catalog with 119 SNPs (13%) linked to immune cell traits (supplemental Table 9). Relevant SNPs were found in superenhancers near the MAF, IRF4, and BATF gene loci (Figure 5). For superenhancer-associated SNPs, the majority were associated with rheumatoid arthritis, type 1 diabetes, multiple sclerosis, celiac disease, and ulcerative colitis. Thus, SNPs associated with biologically relevant, disease-associated immune cell traits were significantly enriched in superenhancers compared with active or intermediate Tfh cell enhancers.
Superenhancers in Tfh cells. (A) Distribution of H3K27Ac normalized ChIP-seq signal across Tfh cell enhancers. Superenhancers are shown in red. Select superenhancer-associated genes are labeled. (B) Representative Tfh cell superenhancers associated with immune-related SNPs at 3 gene loci: MAF, BATF, and IRF4. The called superenhancer is denoted by the thick blue line at the top of the figure. The associated SNP is shown below the superenhancer line. The track of H3K27 acetylated chromatin is shown above the associated gene locus.
Superenhancers in Tfh cells. (A) Distribution of H3K27Ac normalized ChIP-seq signal across Tfh cell enhancers. Superenhancers are shown in red. Select superenhancer-associated genes are labeled. (B) Representative Tfh cell superenhancers associated with immune-related SNPs at 3 gene loci: MAF, BATF, and IRF4. The called superenhancer is denoted by the thick blue line at the top of the figure. The associated SNP is shown below the superenhancer line. The track of H3K27 acetylated chromatin is shown above the associated gene locus.
Tfh cell type–specific enhancers
To assess the cell-type specificity of the enhancers identified, we compared Tfh enhancers marked by nonpromoter-associated peaks of H3K4 monomethylation to enhancers in 61 different cell types. This identified 1660 enhancers that were present in Tfh cell chromatin but were not present in the other cell types. To further refine cell-type specificity, we next compared enhancers marked by nonpromoter-associated peaks of H3K4 monomethylation in Tfh cells to enhancers in 13 hematopoietic cell types, primarily lymphoid cells. We identified 7166 nonpromoter-associated H3K4me1 peaks in Tfh cell chromatin not present in the 13 other cell types, with 9475 not identified in the 10 lymphoid cell types. Jaccard coefficient clustering revealed that hematopoietic cell enhancers clustered distinctly from human embryonic stem cell enhancers (for comparison) and lymphoid cell enhancers clustered distinctly from other hematopoietic cell enhancers (not shown).
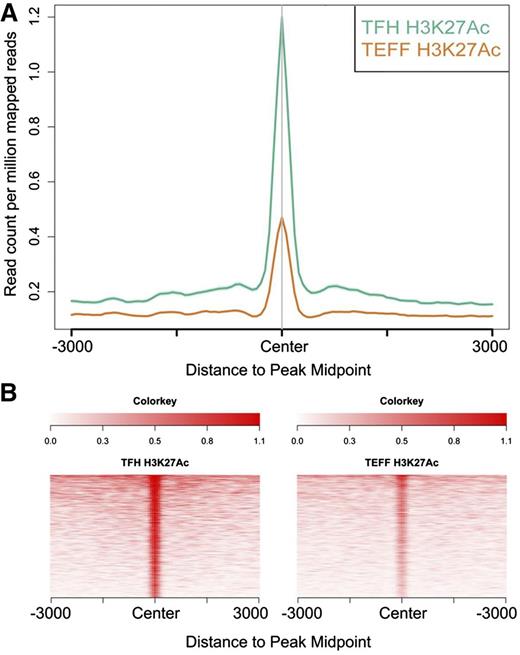
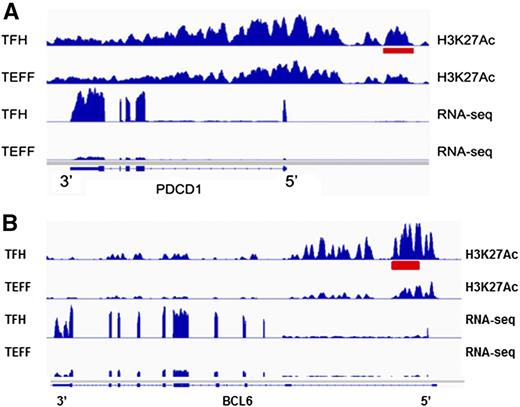
To identify enhancers potentially contributing to differential gene regulation in Tfh and Teff cells, we compared levels of H3K27 acetylation at nonpromoter peaks of H3K4me1 in Tfh and Teff cell chromatin, as relative amounts of acetylation have been correlated with enhancer strength or levels of gene expression.92 There were 1281 differentially acetylated enhancers between the 2 cell types (Figure 6A-B). We then determined whether the genes nearest these differentially acetylated enhancers were also differentially expressed in the associated cell type. There were 43 differentially marked enhancers associated with differentially expressed genes (Table 3) expressed at higher levels in Tfh cells, including PDCD1 and BCL6 (Figure 7), genes associated with Tfh cell function.
Differential histone 3 lysine 27 acetylation in Tfh and Teff cells. Differentially H3K27 acetylated enhancers in Tfh and Teff cell chromatin were identified. (A) The signal density of H3K27Ac was plotted relative to the H3K4me1 peak. (A) The average signal over all differentially acetylated enhancers in Tfh and Teff cells is shown. (B) The signal for each differentially acetylated enhancer in both cell types.
Differential histone 3 lysine 27 acetylation in Tfh and Teff cells. Differentially H3K27 acetylated enhancers in Tfh and Teff cell chromatin were identified. (A) The signal density of H3K27Ac was plotted relative to the H3K4me1 peak. (A) The average signal over all differentially acetylated enhancers in Tfh and Teff cells is shown. (B) The signal for each differentially acetylated enhancer in both cell types.
Tfh cell type–specific active enhancers. (A) A differentially acetylated enhancer 5′ of the PDCD1 gene locus in Tfh cells is shown (red bar). Normalized RNA sequencing read density from each cell type at the PDCD1 gene locus is shown below. (B) A differentially acetylated enhancer in intron 1 of the BCL6 gene locus in Tfh cells is shown (red bar). Normalized RNA sequencing read density from each cell type at the BCL6 gene locus is shown below.
Tfh cell type–specific active enhancers. (A) A differentially acetylated enhancer 5′ of the PDCD1 gene locus in Tfh cells is shown (red bar). Normalized RNA sequencing read density from each cell type at the PDCD1 gene locus is shown below. (B) A differentially acetylated enhancer in intron 1 of the BCL6 gene locus in Tfh cells is shown (red bar). Normalized RNA sequencing read density from each cell type at the BCL6 gene locus is shown below.
Reporter gene assay of Tfh cell type–specific enhancers
Individual reporter gene plasmids were prepared with representative, differentially acetylated enhancer elements associated with differential gene expression in Tfh cells cloned upstream of an SV40 gene promoter-luciferase reporter gene cassette. These included enhancers associated with the B-cell lymphoma 6 (BCL6), histidine-ammonia lyase (HAL), suppressor of tumorigenicity 14 (ST14), CXXC finger protein 5 (CXXC5), secretoglobin, family 3A, member 1 (SCGB3A1), Dab reelin signal transducer homolog 1 (DAB1), WNK lysine-deficient protein kinase 2 (WNK2), and guanine nucleotide binding protein (G protein), γ 4 (GNG4) genes. Plasmids were transfected into human T lymphoid Jurkat cells, which express all but 1 of the associated genes (supplemental Table 10), cell lysates collected after 2 days, and luciferase activity analyzed. All 7 Tfh cell-specific enhancers directed statistically significant (P < .05) reporter gene activity between 2 and 3.5 times over activity of control (supplemental Figure 9).
Discussion
Tfh cells are necessary for B-cell maturation into memory and long-lived plasma cells in GCs of B-cell follicles.93 They provide signals to cognate B cells via CD40 ligand, PD-1, and cytokines, including IL-21 and IL-4, promoting B-cell proliferation and affinity maturation within the GC.94-98 Tfh cell development requires the transcription factors Achaete-scute complex homolog 2 (ASCL2) and BCL6, leading to expression of transcripts important for their function, while repressing activation of genes, among them Blimp1 (PRDM1), critical for development of other Th subsets.5,8,9 ASCL2 and BCL6 upregulation also promotes expression of the chemokine receptor CXCR5 necessary for Tfh cell entry into the B-cell follicle following a gradient of its ligand CXCL13.10,11 Genes encoding these proteins were all highly expressed in the Tfh cells we isolated from tonsils.
Our integrative analyses also revealed that several of these genes were associated with Tfh cell type–specific enhancers, including PDCD1, CXCR5, and BCL6, suggesting that these cis elements are critical for Tfh cell identify and function. However, not all key factors exhibited either differential expression at the transcriptome level and/or Tfh cell-specific enhancers. Although a remote enhancer cannot be excluded, no Tfh cell-type enhancers were identified within 100 kb of the ASCL2 gene locus, indicating that additional regulatory factors direct expression of ASCL2 in Tfh cells.
The master regulator BCL6 regulates a unique program of gene expression essential for Tfh cell differentiation and function.5,8,9 BCL6 promotes expression of genes important for Tfh cell migration and function, while repressing critical regulators and microRNAs of other Th subsets.8,9 Similar to their relationship in GC B cells, BLC6 and Blimp1 (PRDM1) are reciprocal and antagonistic regulators of the Tfh cell phenotype.5,9,99-101 The precise mechanism(s) whereby BCL6 controls these processes in Tfh cells is unclear. Numerous functional roles outside of the GC have been described for BCL6, including a late check point function in pre-B cells, generation and maintenance of effector and memory CD8+ and memory CD4+ cells, regulation of effector functions in peripheral Tregs, regulation of Th17 Th cell differentiation, and acting to constrain immune and inflammatory responses in macrophages (reviewed in Bunting and Melnick102 ). We found BCL6 expressed in Tfh, Teff, and naive T cells, with markedly increased expression in Tfh cells. In parallel, our studies also identified a Tfh cell-specific enhancer in the BCL6 gene locus. It will be important to identify the cis-regulatory elements that control BCL6 expression in Tfh cells and other related lineages.
Recent reports indicate that there is heterogeneity in Tfh cells,103,104 including variable populations of Tfh cells circulating in human peripheral blood.105-109 Although Tfr cells were excluded as a major population of the Tfh cells we obtained from tonsil, variable types of Tfh cells were likely included in the bulk population of Tfh cells. In addition, despite phenotypic and transcriptional differences with other CD4+ Th subsets, Tfh cells secrete many common Teff cytokines such as IL-4, IFN-γ and IL-17, implying a complex relationship between Tfh cells and other CD4 T effector lineages and highlighting the plasticity of Tfh cells.110 Further refining these varying cellular populations, for example, by using single-cell transcriptome analyses, will provide insight into T effector cell development, differentiation, and function.111
AITL is an uncommon subtype of PTCL with a poor prognosis.112 Initial studies revealed a pan T-cell phenotype with expression of Tfh markers including CD10, CXCL13, and PD-1. Gene expression profiling studies identified a specific molecular signature in AITL, indicating origin from Tfh cells,19,77-82 as well as overlap with other, less well-defined PTCL.77,113 Recent genomics-based studies have identified a group of common mutations AITL, including mutations in IDH2, RHOA, TET2, and DNMT3.19,20,114-118 These studies have led to reclassification of subtypes of PTCL and have allowed assignment of diagnostic and prognostic significance to these subtypes.19 Combining detailed transcriptome information provided by RNA-seq with genome-wide mutation analyses will allow further refinement of these lymphoma subtypes, allowing better assignment of disease diagnosis and prognosis, as well as revelation of novel targets for therapeutic strategies.
GWAS studies have identified many SNPs enriched in patients with autoimmune diseases, leading to the identification of many disease-associated loci.119,120 Frequently, specific SNPs are found in more than 1 autoimmune disorder, in line with the observation that some patients suffer from more than 1 such disorder, with certain polymorphisms likely contributing to common causality.121 Most variants identified in GWAS studies are outside coding regions,122 and are enriched for regulatory and transcriptionally functional SNPs.123 Because expansion of dysfunctional Tfh cells is a major contributor to systemic autoimmunity, we examined the relationship between Tfh cell enhancers and superenhancers and SNPs identified in GWAS. We found many SNPs linked to autoimmune diseases by GWAS in Tfh cell enhancers, particularly multiple sclerosis, rheumatoid arthritis, and type I diabetes, with several linked to multiple such illnesses, with even more significant enrichment in Tfh cell superenhancers. The challenge now is to translate the linkage of autoimmune SNPs and Tfh cell enhancers and superenhancers to a better understanding of Tfh cell development and differentiation and to determine the functional significance of variants associated with quantitative traits linked to autoimmune disease.
The online version of this article contains a data supplement.
The publication costs of this article were defrayed in part by page charge payment. Therefore, and solely to indicate this fact, this article is hereby marked “advertisement” in accordance with 18 USC section 1734.
Acknowledgments
This work was supported in part by grants T32HD007094 (Eunice Kennedy Shriver National Institute), R01HL106184, RO1HL65448 (National Heart, Lung, and Blood Institute), T32AR07107, RO1AR040072, R21AR062842, and P30AR053495 (National Institute of Arthritis and Musculoskeletal and Skin Diseases) from the National Institutes of Health and the Alliance for Lupus Research.
Authorship
Contribution: J.S.W. designed and performed experiments and analyzed data; K.L.-G., Y.M., and M.S. designed and performed experiments; S.C. and Y.Z. performed experiments; V.P.S. analyzed data; and J.C. and P.G.G. designed experiments, analyzed data, and wrote the manuscript.
Conflict-of-interest disclosure: The authors declare no competing financial interests.
Correspondence: Joseph Craft, Departments of Medicine and Immunobiology, Yale University School of Medicine, 300 Cedar St, PO Box 208031, New Haven, CT 06520-8031; e-mail: joseph.craft@yale.edu; and Patrick G. Gallagher, Departments of Pediatrics, Pathology, and Genetics, Yale University School of Medicine, 333 Cedar St, PO Box 208064, New Haven, CT 06520-8064; e-mail: patrick.gallagher@yale.edu.
References
Author notes
J.C. and P.G.G. are senior authors.

