Key Points
Human naive CD4+ T cells and resting nTreg are differentially methylated at 127 regions in their genomic DNA.
Forkhead-binding motifs are present in promoter-associated differentially methylated regions, inferring broader epigenetic control of Treg.
Abstract
Regulatory T cells (Treg) prevent the emergence of autoimmune disease. Prototypic natural Treg (nTreg) can be reliably identified by demethylation at the Forkhead-box P3 (FOXP3) locus. To explore the methylation landscape of nTreg, we analyzed genome-wide methylation in human naive nTreg (rTreg) and conventional naive CD4+ T cells (Naive). We detected 2315 differentially methylated cytosine–guanosine dinucleotides (CpGs) between these 2 cell types, many of which clustered into 127 regions of differential methylation (RDMs). Activation changed the methylation status of 466 CpGs and 18 RDMs in Naive but did not alter DNA methylation in rTreg. Gene-set testing of the 127 RDMs showed that promoter methylation and gene expression were reciprocally related. RDMs were enriched for putative FOXP3-binding motifs. Moreover, CpGs within known FOXP3-binding regions in the genome were hypomethylated. In support of the view that methylation limits access of FOXP3 to its DNA targets, we showed that increased expression of the immune suppressive receptor T-cell immunoglobulin and immunoreceptor tyrosine-based inhibitory motif domain (TIGIT), which delineated Treg from activated effector T cells, was associated with hypomethylation and FOXP3 binding at the TIGIT locus. Differential methylation analysis provides insight into previously undefined human Treg signature genes and their mode of regulation.
Introduction
Regulatory T cells (Treg) are pivotal in maintaining T-cell homeostasis and preventing autoimmune disease.1 Prototypic natural CD4+ Treg (nTreg) are derived from the thymus and programmed by the transcription factor Forkhead-box P3 (FOXP3),2,3 which is required for both their development and suppressive function. In humans, naive resting nTreg (rTreg) are relatively homogenous and can be isolated based on surface expression of CD45RA and CD25. Activated nTreg (aTreg), derived from rTreg after antigen activation in vivo, mostly comprise the CD25high fraction of memory (CD45RO+) CD4+ T cells.4 However, there is no clear phenotypic distinction in human blood between aTreg and activated CD45RO+ CD25+ conventional T cells (Tconv)4,5 or from antigen-activated naive CD4+ T cells (Naive) that also transiently express FOXP3.5 Thus, markers that better identify nTreg would aid assessment of immune status in health and disease. nTreg have reduced surface expression of the interleukin (IL)-7 receptor alpha chain (CD127)6,7 and express the Ikaros transcription factor family member Helios.8 However, activation of Tconv also leads to downregulation of CD1275 and expression of HELIOS.9 Lack of consensus about the status of nTreg in human disease, for example, in autoimmune diseases such as type 1 diabetes,10 underscores the need for specific and stable nTreg markers.
Demethylation at the FOXP3 locus allows identification of T cells with a stable nTreg phenotype. Demethylation within a highly conserved region, the Treg-specific demethylated region (TSDR; or conserved noncoding sequence 2, CNS2), is restricted to nTreg and is not seen in recently activated Tconv that transiently express FOXP3.11,12 Demethylation allows chromosome relaxation and binding of FOXP3 itself as well as other transcription factors (CREB/ATF, STAT5, ETs-1, Cbf-β-Runx1) in order to maintain transcriptional activity at the FOXP3 locus.13-16 To further explore the epigenetic landscape in shaping nTreg phenotype and function, we performed global DNA methylation profiling to identify differentially methylated cytosine–guanosine dinucleotides (CpGs) between human rTreg and Naive cells before and after activation in vitro. We describe regions of differential methylation (RDMs) that are potentially able to bind FOXP3 and regulate expression of other Treg signature genes, illustrated directly for TIGIT, which is a suppressive receptor expressed by Treg.
Materials and methods
Human blood T-cell isolation, activation, and phenotyping
This study was conducted in accordance with the Declaration of Helsinki. Approval was obtained from the Walter and Eliza Hall Institute’s human research ethics committee. Blood buffy coat samples were donated by the Australian Red Cross Blood Service. CD4+ T cells were flow-sorted into Naive (CD45RA+ CD45RO− CD25−) and rTreg (CD45RA+ CD45RO−CD25+), CellTrace Violet (CTV) dye labeled, activated for 3 days with anti-CD3 (soluble, 100 ng/mL; OKT3) and anti-CD28 (200 ng/mL; CD28.2; BD) antibodies and irradiated autologous CD4+ T-cell–depleted peripheral blood mononuclear cells in IP5 medium (Iscove’s modified Dulbecco’s medium [Gibco] supplemented with 5% pooled human serum). On day 4, fresh IP5 containing recombinant human IL-2 (final of 20 U/mL) was added, and cells were cultured for an additional 2 days. On day 6, proliferated and CD25+ (CTVdim CD25+) cells were sorted.
Suppressor assay
rTreg were added to CTV-labeled Naive (5 × 10⁴) at 1:1 and 1:2 (suppressor:responder) ratios together with autologous antigen-presenting cells, in duplicate. Cells were stimulated with anti-CD3 antibody (soluble, 200 ng/mL) for 4 days and analyzed for CTV dilution. Suppression was calculated as the percent repression of Naive proliferation.
Chromatin immunoprecipitation and quantitative, reverse-transcription polymerase chain reaction
Naive and rTreg were activated with anti-CD3 (plate-bound, 3 μg/mL), anti-CD28 (soluble, 1 μg/mL) antibodies and IL-2 (200 U/mL) for 6–10 days to obtain Act-Naive and Act-rTreg. Induced Treg (iTreg) were differentiated from Naive with the same stimuli plus transforming growth factor-β1 (5 ng/mL). FOXP3 ChIP, 10–20 million cells, were used. Relative FOXP3 enrichment was first normalized to input DNA, and fold change was calculated compared with an intergenic region. Primers are listed in supplemental Table 1 (available on the Blood Web site).
Genomic DNA isolation, bisulfite conversion, and sequencing
Genomic DNA was isolated with a blood and tissue kit (DNeasy; Qiagen), subjected to sodium bisulfite conversion with a DNA methylation kit (EZ; Zymo Research). Converted DNA was used as the template to amplify the fragments for sequencing and methylation Taqman assay.
Reverse-transcription polymerase chain reaction, quantitative polymerase chain reaction, and Taqman quantitative, reverse-transcription polymerase chain reaction
Total RNA was extracted with reagent (TRI; Invitrogen). For reverse transcription, random hexamers (Qiagen) were used. Quantitative polymerase chain reaction (qPCR) was performed in duplicate with 200 ng first-strand cDNA. Hypoxanthine phosphoribosyltransferase-1 was used as a control. miRNAs were detected using Taqman miRNA assays (Ambion), and U6 snRNA was used as a reference gene. Methylated CpGs were detected using bisulfite-converted genomic DNA and 6-carboxy-2′,4,4′,5′,7,7′–hexachlorofluorescein– and 6-carboxy fluorescein (FAM)-labeled probes. Methylation was calculated using the following formula: % methylation = 100/[1 + 2Ct(methylated - unmethylated)].
Illumina 450k arrays
Bisulfite-converted DNA was used to hybridize the Infinium HumanMethylation450 BeadChips as previously described.17 Illumina iScan was used to scan the BeadChips. The raw intensity data (IDAT) were imported into the R (2.15.2; http://cran.r-project.org/), processed using the minfi (1.4.0) Bioconductor package,18 and normalized for technical variations using SWAN.19 Poorly performing probes (P > .01 in 1 or more samples) and probes interrogating single nucleotide polymorphisms on the array were removed from further analysis. This resulted in a final dataset of 481 473 probes.
Differential methylation analysis
The proportion of methylation at each CpG is represented by the β value, defined as the proportion of the methylated signal to the total signal and calculated from the normalized intensity values. Statistical analyses were performed on M values [M = log2 (methylated/unmethylated)].20 For probe-wise differential methylation analysis, a linear model was fitted, taking into account the paired sample within an individual and using the limma (3.14.4) package.21 P values were adjusted to control for the false discovery rate (FDR) using the Benjamini–Hochberg method.22 Significantly differentially methylated probes (DMPs) were defined as those having an adjusted P < .05 and an absolute difference in mean β values |Δβ| ≥ 0.2.
Identification of RDMs
RDMs were identified using the “dmrFind” in the Bioconductor package charm (2.4.0).23 FDRs were calculated using the “qval” function in the charm package, with numiter = 1000 permutations. RDMs were further refined by the exclusion of regions with an absolute average percentage methylation difference across probes of <15%.
Functional annotation
Motif identification
Gene set testing
Gene sets include FOXP3 targets in mice28,29 and humans30 based on FOXP3 ChIP experiments, genes regulated by FOXP3 in mice31 and in humans,32 and genes encoding mouse cytokines and transcription factors33 (supplemental Table 2). Gene set testing was performed on all RDMs annotated to genes using 1-tailed Fisher exact tests.
ChIP-seq data analysis
Human FOXP3 ChIP-seq data34 were obtained from the Sequence Read Archive, and the quality was assessed using FastQC (0.10.1). The 35bp reads were then trimmed using Trimmomatic (0.30).35 Bowtie (0.12.7) in best mode with default parameters36 was used to map reads to the human genome (hg19). MACS (1.4.2) with default parameters37 was subsequently used to identify FOXP3 binding peaks.
Details of the methods can be found in the supplemental Methods section. All primers and probes are listed in supplemental Table 1. HumanMethylation450 BeadChips raw data were deposited at Gene Expression Omnibus with accession number GSE49667.
Results
CD4+ T-cell subsets: phenotype, function, and DNA methylation
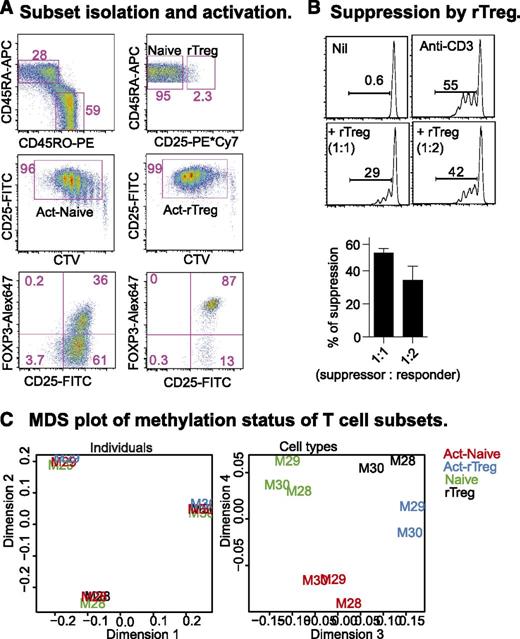
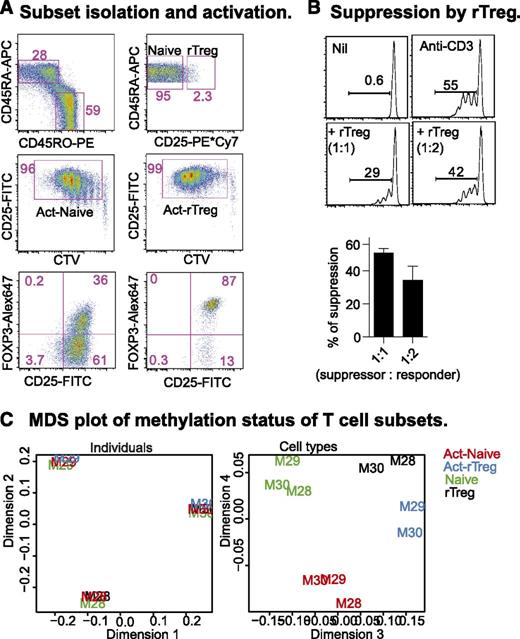
Human rTreg are a relatively homogenous population that, after activation in vitro, resemble the activated nTreg (aTreg) observed in peripheral blood.4 We sorted Naive and rTreg from 3 healthy male blood donors (M28, M29, M30; Figure 1A, top panel) and activated them for 6 days with anti-CD3 and anti-CD28 antibodies, supplemented with IL-2 at day 4. After activation, both populations proliferated and were CD25+ (Figure 1A, middle panel). The majority (>85%) of activated rTreg (Act-rTreg) and some of the activated Naive (about 30%; Act-Naive) expressed FOXP3 (Figure 1B, bottom panel). In an autologous suppression assay, rTreg inhibited Naive proliferation (Figure 1B).
CD4+T-cell subsets: phenotype, function, and DNA methylation. (A) Naive and rTreg from male blood donors were sorted (top panel) and activated with soluble anti-CD3 and -28 antibodies (100 and 200 ng/mL, respectively) and autologous irradiated CD4+ cell-depleted peripheral blood mononuclear cells for 4 days, supplemented with 20 U/mL IL-2 for an additional 2 days. Act-Naive and Act-rTreg were sorted as proliferating CTVdim CD25+ cells (middle panel). FOXP3 expression was examined by intracellular staining (bottom panel). (B) Sorted CTVdim CD25+ cells were incubated with Naive CD4+ T cells (5 × 10⁴) at 1:1, 1:2, 1:4, 1:8, and 1:16 ratios with anti-CD3 antibody (100 ng/mL), with or without IL-2 (20 U/mL) for 5 days. (C) Multidimensional scaling (MDS) analysis of the normalized, filtered data. The MDS plot is analogous to a principal components analysis plot. The axes represent the major sources of variation in the data based on the top 1000 genes with the largest standard deviations between samples; dimension 1 represents the largest source of variation, dimension 2 represents the next largest orthogonal source of variation, followed by dimension 3, etc. The left-hand MDS plot shows that the largest source of variation between samples was the difference in baseline methylation between the donors. Examination of further sources of variation reveals that methylation differences between cell types and activation status are also present, as shown in the right-hand MDS plot. Each sample is labeled with the donor ID and colored by cell type.
CD4+T-cell subsets: phenotype, function, and DNA methylation. (A) Naive and rTreg from male blood donors were sorted (top panel) and activated with soluble anti-CD3 and -28 antibodies (100 and 200 ng/mL, respectively) and autologous irradiated CD4+ cell-depleted peripheral blood mononuclear cells for 4 days, supplemented with 20 U/mL IL-2 for an additional 2 days. Act-Naive and Act-rTreg were sorted as proliferating CTVdim CD25+ cells (middle panel). FOXP3 expression was examined by intracellular staining (bottom panel). (B) Sorted CTVdim CD25+ cells were incubated with Naive CD4+ T cells (5 × 10⁴) at 1:1, 1:2, 1:4, 1:8, and 1:16 ratios with anti-CD3 antibody (100 ng/mL), with or without IL-2 (20 U/mL) for 5 days. (C) Multidimensional scaling (MDS) analysis of the normalized, filtered data. The MDS plot is analogous to a principal components analysis plot. The axes represent the major sources of variation in the data based on the top 1000 genes with the largest standard deviations between samples; dimension 1 represents the largest source of variation, dimension 2 represents the next largest orthogonal source of variation, followed by dimension 3, etc. The left-hand MDS plot shows that the largest source of variation between samples was the difference in baseline methylation between the donors. Examination of further sources of variation reveals that methylation differences between cell types and activation status are also present, as shown in the right-hand MDS plot. Each sample is labeled with the donor ID and colored by cell type.
We prepared DNA from rTreg, Naive, Act-Naive, and Act-rTreg for methylation analysis on Illumina Infinium HumanMethylation450 (450k) arrays. Following quality control and preprocessing (see “Materials and methods” section), multidimensional scaling (MDS) analysis of the normalized, filtered data indicated that the largest source of variation between the samples was between the donors (Figure 1C, left panel). However, a more thorough examination of other sources of variation revealed consistent differences between cell types and activation status (Figure 1C, right panel). Our statistical analysis therefore accounted for interindividual differences when testing for methylation differences between cell types.
Differential DNA methylation between Naive and rTreg
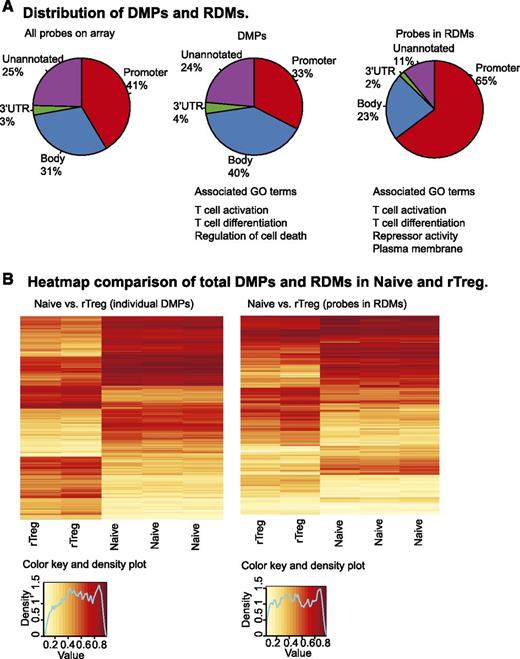
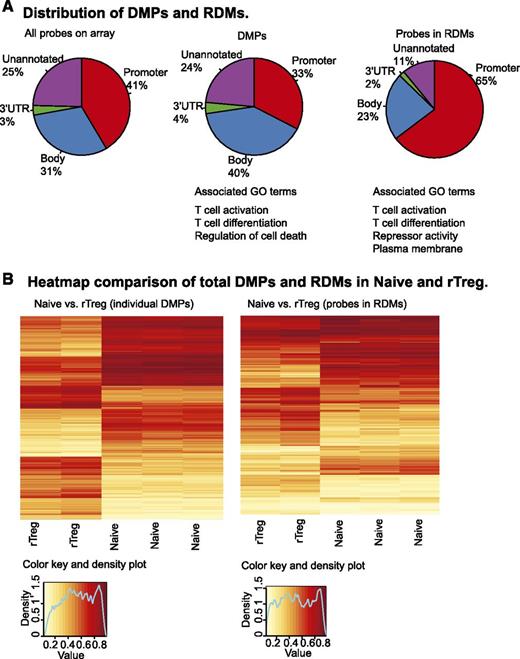
Between Naive and rTreg, 2315 CpGs were significantly differentially methylated (FDR adjusted P < .05, |Δβ| ≥0.2; supplemental Table 3). These represented <0.5% of the total CpG probes (n = 481 473). More than 70% (n = 1681) of the DMPs were associated with genes (n = 1137), while the remaining 634 were not annotated. With respect to genomic context, 33% (n = 747) of the DMPs were in promoter regions, 40% (n = 920) in gene bodies, 4% (n = 86) in 3′ untranslated regions (UTRs) of known genes, and 24% (n = 541) were not assigned to a genomic feature. Compared with the probes on the 450k array, DMPs showed a significant enrichment in the gene body (P < 2.2 × 10⁻¹⁶, Fisher exact test [FET]) and a deficiency in promoter (P < 2.2 × 10⁻¹⁶, FET), while the proportions in the 3′ UTR and unannotated regions were not significantly different from a randomly selected set (Figure 2A). The most significant clusters identified by DAVID functional annotation clustering analysis24,25 of the genes associated with DMPs were terms T-cell activation and differentiation and regulation of cell death (supplemental Table 4).
Differential DNA methylation between Naive and rTreg. (A) Functional annotations of the 450k array probes (left panel), 2315 DMPs between Naive and rTreg cells (middle panel), and probes associated with 127 RDMs between Naive and rTreg (right panel). (B) Unsupervised hierarchical clustering of the β values of both the significant DMPs (left panel) and RDM probes (right panel) resulted in distinct groupings of the Naive and rTreg samples. Each horizontal row in the heat map represents a CpG probe and each vertical column is a sample. The color indicates the level of methylation at each CpG in each sample, as described by the color key.
Differential DNA methylation between Naive and rTreg. (A) Functional annotations of the 450k array probes (left panel), 2315 DMPs between Naive and rTreg cells (middle panel), and probes associated with 127 RDMs between Naive and rTreg (right panel). (B) Unsupervised hierarchical clustering of the β values of both the significant DMPs (left panel) and RDM probes (right panel) resulted in distinct groupings of the Naive and rTreg samples. Each horizontal row in the heat map represents a CpG probe and each vertical column is a sample. The color indicates the level of methylation at each CpG in each sample, as described by the color key.
Promoter methylation is inversely correlated with gene expression
Neighboring CpGs are often correlated in methylation status,38,39 and genomic regions are more functionally relevant.40-43 Thus, we performed an analysis to identify RDMs, which can be defined as clusters of physically proximal CpGs (within ∼300bp) that are significantly different in their methylation between cell types.44 One hundred and twenty-seven RDMs were identified between Naive and rTreg (supplemental Table 5). The RDMs encompassed 608 individual CpG probes and were associated with 97 genes and 23 unannotated genomic regions (supplemental Table 6). Of the 608 individual probes, 65% (n = 385) were located in promoter regions, 23% (n = 134) in gene bodies, 2% (n = 11) in 3′ UTRs, and 11% (n = 65) were unannotated (Figure 2A, right panel). In contrast to the individual DMPs, the probes located in RDMs were significantly enriched in promoter annotations (P < 2.2 × 10⁻¹⁶, FET) and a corresponding decrease in gene body (P < 1.823 × 10−05, FET) and unannotated regions (P < 1.348 × 10⁻¹⁴, FET), while the proportion in 3′ UTR did not differ significantly. The top clusters from DAVID analysis24,25 were the associated with the terms T-cell activation and differentiation of the genes associated with RDMs. However, in contrast to the DMPs, the next 2 most significant clusters contained terms associated with repressor activity and plasma membrane (supplemental Table 7).
Unsupervised clustering of the β values of both the DMPs and RDM probes resulted in distinct groupings of the Naive and rTreg samples (Figure 2B). In both cases, hypermethylation and hypomethylation were distributed evenly between rTreg and Naive, which is in contrast to the previous report of relative hypomethylation in nTreg obtained using other methods.45
To explore the relationship between methylation changes and gene expression, we correlated the methylation status of promoter-associated RDMs with gene expression data from Schmidl et al.46 We observed a negative correlation between methylation and gene expression (Pearson correlation coefficient, −0.5; P = .0026; supplemental Figure 1), suggesting that changes in promoter methylation are related to gene expression. The 12Mb methylation data from Schmidl et al46 showed minimal (<0.01%) overlap with the 450k array CpGs. However, 5 RDMs intersected with their regions of interest, of which 3 were consistently differentially methylated in both studies (data not shown).
Activation-induced changes in DNA methylation profiles
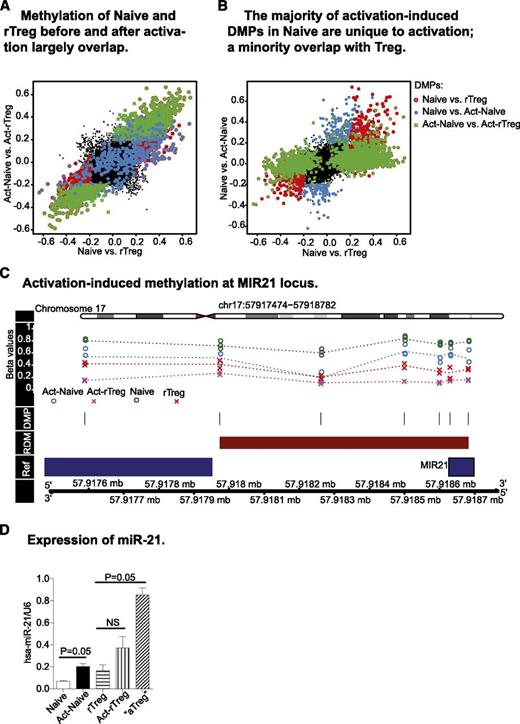
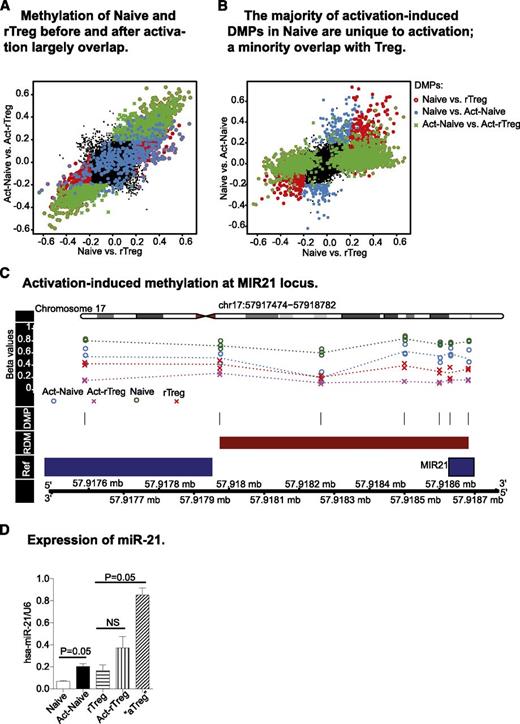
The ability of the immune system to combat diverse, potentially pathogenic insults and still maintain tolerance to self is reflected by the lineage and functional plasticity of T cells, including Treg. We therefore examined the fidelity of distinct DNA methylation profiles after antigen activation in Naive and rTreg. Act-rTreg and Act-Naive displayed significant differences in 1689 CpG probes (supplemental Table 8), the majority of which overlapped with the differences found between these 2 T-cell subsets before activation (Figure 3A). Thus, the DNA methylation profiles that distinguished Naive and rTreg were largely unaffected by activation.
Activation-induced changes in DNA methylation profiles. (A) Act-Naive and Act-rTreg displayed significant differences in 1679 CpG probes (green cross), the majority of which overlapped with the differences found between these 2 T-cell subsets before activation (red circle). The distinct DNA methylation profiles between Naive and rTreg are largely unaffected by activation. (B) Activation-induced methylation changes in 466 CpGs in Naive CD4+T cells (blue dots). Of these, 171 overlapped with the methylation patterns of rTreg and 283 were unique to activation. (C) Activation-induced demethylation at the MIR21 locus. (D) Expression of miR-21 in Naive and Treg before and after activation. Data are represented as mean ± standard error of the mean of 3 donors. *P = .05 (Mann–Whitney test, 1-tailed).
Activation-induced changes in DNA methylation profiles. (A) Act-Naive and Act-rTreg displayed significant differences in 1679 CpG probes (green cross), the majority of which overlapped with the differences found between these 2 T-cell subsets before activation (red circle). The distinct DNA methylation profiles between Naive and rTreg are largely unaffected by activation. (B) Activation-induced methylation changes in 466 CpGs in Naive CD4+T cells (blue dots). Of these, 171 overlapped with the methylation patterns of rTreg and 283 were unique to activation. (C) Activation-induced demethylation at the MIR21 locus. (D) Expression of miR-21 in Naive and Treg before and after activation. Data are represented as mean ± standard error of the mean of 3 donors. *P = .05 (Mann–Whitney test, 1-tailed).
Next, we examined the activation-induced DNA methylation differences in Naive and rTreg. In Naive, methylation at 466 CpGs was significantly different after activation (supplemental Table 9). Of these probes, 36.7% (n = 171) acquired methylation patterns that were similar to those of rTreg and 60.7% (n = 283) were unique to activation (Figure 3B). The genes with activation-associated DMPs were enriched for terms related to transcription, DNA binding, and positive regulation of various cellular processes in the most significant cluster, followed by clusters containing terms DNA binding, nucleotide binding, phosphorylation, and kinase activity (supplemental Table 10). Eighteen RDMs were also identified, 13 of which were associated with known genes (KSR1, MIR21, GFI1, CSF2, NCF4, VMP1, HSD17B8, IL13, ITGAX, RPTOR, AIM2, CCL5, CD59) and 5 were unannotated (supplemental Table 11). The genes with activation-associated RDMs were enriched for terms related to cytokine–cytokine receptor interaction and regulation of T-cell differentiation (supplemental Table 12), indicating that changes in DNA methylation are associated with Naive activation and plasticity. Interestingly, activation did not lead to significant DNA methylation changes in rTreg.
The methylation status of activation-associated RDMs may regulate gene expression. Activation of Naive induced significant demethylation at the microRNA MIR21 locus (Figure 3C). Therefore, we examined expression of miR-21 in Naive and rTreg before and after activation. miR-21 was significantly upregulated after activation in Naive. Activation in vitro did not induce significant changes in rTreg, but aTreg isolated directly ex vivo exhibited significantly increased miR-21 expression (Figure 3D).
Identification of Forkhead-binding motifs in RDMs
We were interested to know if putative transcription factor binding sites were present in promoter-associated RDMs. An overrepresented motif was identified using MEME26 (supplemental Figure 2A). When compared with known binding motif models using TOMTOM,18 this motif was identified as a candidate Forkhead-binding motif (supplemental Figure 2B), similar to one previously described by Sadlon et al.30 Therefore, we investigated the relationship between the RDMs and genomic FOXP3 binding sites. We compared the genomic positions of our 127 RDMs with human ChIP-chip30 and ChIP-seq34 data. The ChIP-chip data identified 8305 FOXP3 binding peaks and the ChIP-seq data identified 26 483 peaks (see “Materials and methods” section). Almost 60% of the ChIP-chip peaks were also covered by the ChIP-seq peaks. Creating a union of the ChIP-chip and ChIP-seq peak regions resulted in 28 885 unique FOXP3 binding loci. Using this list, we found a direct overlap with 24 of our RDMs (supplemental Figure 3). Although this number appears small, the combined list of peaks only covers 33 342 (<7%) of the 450k CpGs. Given the number of genomic bases covered by each RDM and ChIP peak, in the context of the whole genome the number of bases covered by both RDMs and ChIP peaks is significantly overrepresented (P < 2.2 × 10⁻¹⁶; Pearson χ2 test), implying a relationship between methylation status and FOXP3 binding in nTreg. Furthermore, we found that RDMs overlapping FOXP3 peaks were significantly more likely to be hypomethylated in nTreg (P = .0051; 1-sided FET). The positions and methylation status of the RDMs, along with evidence for FOXP3 binding, are summarized in Table 1. We subsequently selected and validated by quantitative reverse transcription-PCR (qRT-PCR) the expression of several other hypomethylated genes in Treg (supplemental Figure 2C). Our findings are consistent with the view that demethylation, especially in promoter regions of Treg genes, increases gene expression.
FOXP3 binding coincides with hypomethylation in the genome
FOXP3 can function either as a transcriptional activator (eg, to FOXP3 itself) or suppressor (eg, to IL2 and IFNG). To explore how DNA methylation may be associated with different modes of FOXP3 function, we further examined the methylation status of FOXP3 binding sites in the genome using the published human ChIP-chip30 and ChIP-seq34 data. CpG probes within FOXP3–ChIP peaks were significantly hypomethylated compared with the probes not in the peaks (supplemental Figure 4). As a transcriptional activator, FOXP3 binds to its own demethylated TSDR in Treg to maintain its transcription.10 To investigate whether FOXP3 potentially utilizes similar mechanisms to regulate the expression of other genes, we performed gene set tests on the genes associated with RDMs (see “Materials and methods” section). The differentially expressed genes in Treg and the FOXP3 target genes were significantly enriched in the RDMs (supplemental Table 13). Interestingly, genes directly activated by FOXP3 were enriched in the hypomethylated RDMs in Treg. However, genes directly repressed by FOXP3 were not differentially methylated between rTreg and Naive (supplemental Figure 5). Thus, a range of other factors, including the context of DNA methylation (eg, within or outside a CpG island) and cofactors bound to FOXP3, may ultimately determine the transcriptional regulatory function of FOXP3.
Hypomethylation is required for FOXP3 binding
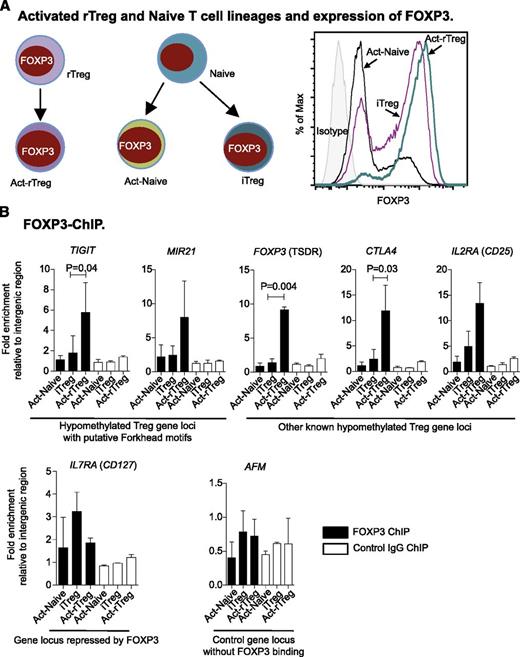
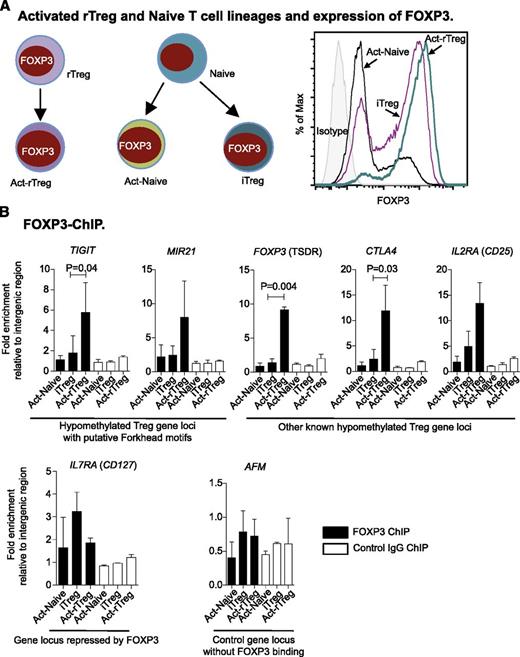
To examine how methylation affects FOXP3 binding, we took advantage of differential DNA methylation between Act-rTreg and Naive-derived Act-Naive and iTreg lineages, which all express FOXP3 (Figure 4A). By ChIP-qPCR, we observed enrichment of FOXP3 at the demethylated TIGIT and MIR21 loci in Act-rTreg, as well as at other hypomethylated loci (FOXP3 TSDR, CTLA4, and IL2Ra) known to bind to FOXP3. In contrast, at the IL7RA (CD127) locus, repressed by FOXP3, enrichment of FOXP3 was marginal, suggesting indirect or weak binding. As a control, no enrichment of FOXP3 binding was observed at intron 1 of AFM (Figure 4B). Overall, our findings indicate that methylation (and its context) limits FOXP3 binding, thereby influencing Treg function.
Hypomethylation is required for FOXP3 binding. (A) Illustration of subsets of activated T cells (left panel) and expression of FOXP3 (right panel). (B) Enrichment of FOXP3 binding in hypomethylated Treg gene loci upregulated by FOXP3 and at the FOXP3-repressed IL7RA locus. AFM intron 1 was used as a control. Data are represented as mean + standard deviation of 3 donors; paired t test (2-tailed).
Hypomethylation is required for FOXP3 binding. (A) Illustration of subsets of activated T cells (left panel) and expression of FOXP3 (right panel). (B) Enrichment of FOXP3 binding in hypomethylated Treg gene loci upregulated by FOXP3 and at the FOXP3-repressed IL7RA locus. AFM intron 1 was used as a control. Data are represented as mean + standard deviation of 3 donors; paired t test (2-tailed).
Treg-specific demethylation at the T-cell immunoglobulin and immunoreceptor tyrosine-based inhibitory motif domain locus
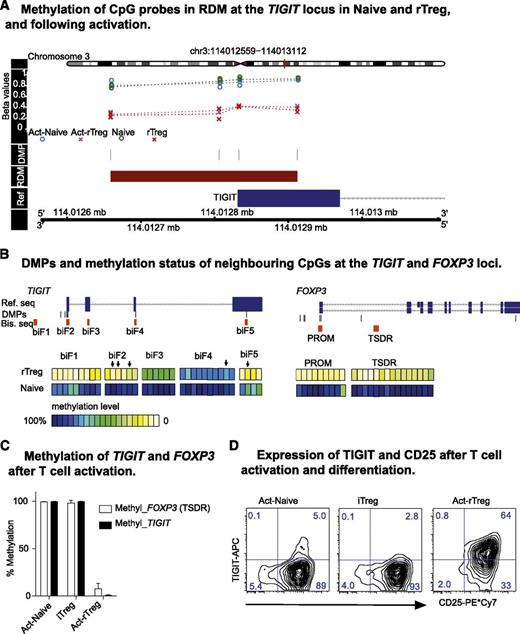
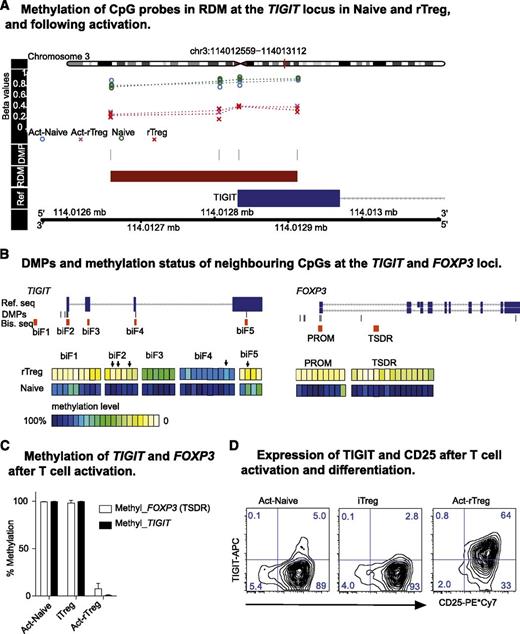
T-cell immunoglobulin and immunoreceptor tyrosine-based inhibitory motif domain (TIGIT) is a recently discovered receptor that suppresses activation of T cells, dendritic cells, and natural killer (NK) cells.47-49 We identified an overlapping RDM and FOXP3 binding peak in the TIGIT promoter (supplemental Figure 3). Demethylation at the TIGIT locus was one of the most significantly differentially methylated regions that distinguished Naive and rTreg, not altered by activation, and is required for FOXP3 binding (Figures 4B and 5A). To validate our array data and evaluate the potential of using TIGIT as a new Treg marker, we extended DNA methylation across the TIGIT locus in 5 donors by clonal bisulfite sequencing of CpG dinucleotides proximal to the DMPs. As a control, we also analyzed methylation of the FOXP3 promoter and TSDR on the same samples (supplemental Figure 6). The CpG dinucleotides of TIGIT were hypomethylated in rTreg across several regions, most apparent in biF1, 2, and 5 where putative promoter and enhancer regions are located (Figure 5B, left panel). Demethylation of the TSDR in the FOXP3 locus indicated the purity of isolated Naive and rTreg (Figure 5B). In addition, activation and differentiation of Naive into Act-Naive or iTreg cells did not change the methylation status of TIGIT or FOXP3 (Figure 5C), as measured by methylation-sensitive Taqman-qPCR. TIGIT was described as being expressed in human Treg and activated Tconv cells.47 We found that significantly increased TIGIT protein expression occurred only in Act-rTreg cells, which is in contrast to Act-Naive and iTreg (Figure 5D). Thus, TIGIT, unlike CD25 and FOXP3, can distinguish activated nTreg cells from in vitro activated conventional T cells.
Treg-specific hypomethylation at the TIGIT locus. (A) DMPs and RDM in TIGIT locus. (B) Location of the PCR fragments neighboring DMPs in TIGIT (biF1-5) and FOXP3 loci and clonal bisulfite sequencing results. Ref. seq, reference sequence; Bis. seq, clonal bisulfite sequencing fragments. (Arrows) DMPs identified from 450k array. Data are represented as the mean of 5 donors. (C) Methylation-sensitive Taqman-qPCR showing methylation at TIGIT (RDM) and FOXP3 (TSDR) loci in Act-Naive and iTreg and demethylation in Act-rTreg. Data are represented as mean + standard deviation of 3 donors; paired t test (2-tailed). (D) Expression of TIGIT and CD25 in Act-Naive, iTreg, and Act-rTreg. Data are representative of 10 healthy individuals all showing similar results.
Treg-specific hypomethylation at the TIGIT locus. (A) DMPs and RDM in TIGIT locus. (B) Location of the PCR fragments neighboring DMPs in TIGIT (biF1-5) and FOXP3 loci and clonal bisulfite sequencing results. Ref. seq, reference sequence; Bis. seq, clonal bisulfite sequencing fragments. (Arrows) DMPs identified from 450k array. Data are represented as the mean of 5 donors. (C) Methylation-sensitive Taqman-qPCR showing methylation at TIGIT (RDM) and FOXP3 (TSDR) loci in Act-Naive and iTreg and demethylation in Act-rTreg. Data are represented as mean + standard deviation of 3 donors; paired t test (2-tailed). (D) Expression of TIGIT and CD25 in Act-Naive, iTreg, and Act-rTreg. Data are representative of 10 healthy individuals all showing similar results.
Delineation of human nTreg based on TIGIT expression
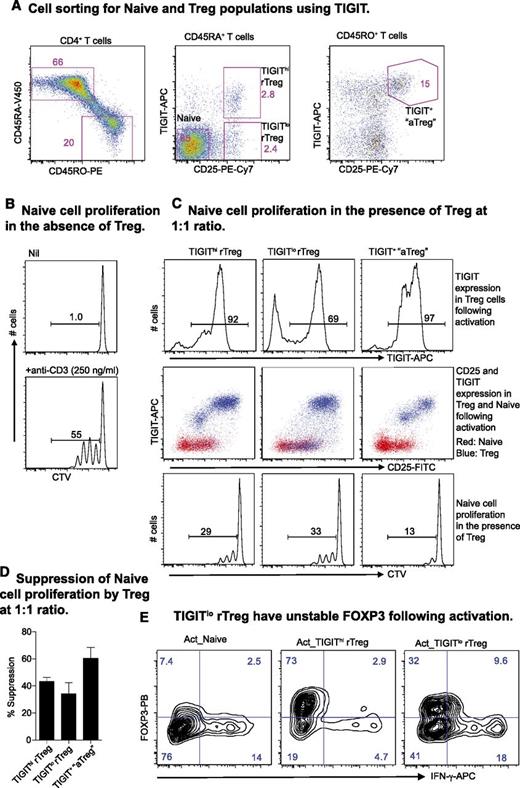
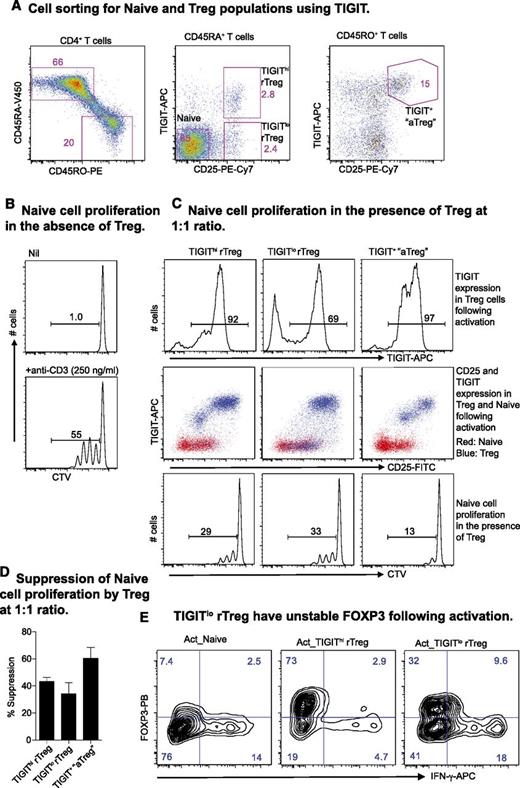
Finally, we determined whether TIGIT expression could further delineate human nTreg. CD4+ rTreg, normally identified by the expression of CD45RA and CD25, were divided by TIGIT into 2 compartments. In the memory fraction, the combination of TIGIT and CD25 also improved the gating strategy for isolating aTreg ex vivo (Figure 6A). In an autologous suppression assay (Figure 6B), these Treg subsets further upregulated TIGIT after activation and suppressed Naive proliferation (Figure 6C-D). However, a fraction (∼30%) of TIGITlo rTreg cells did not upregulate TIGIT (Figure 6C, upper panel), and these cells also showed reduced FOXP3 and increased interferon-gamma (IFN-γ) expression (Figure 6E).
Expression of TIGIT on Treg and the Treg suppressor function. (A) TIGIT delineates human rTreg and aTreg. (B) Naive proliferation at day 4 in the absence of Treg. (C) TIGIT expression on Treg and Naive (top and middle panel) was analyzed at day 4 during a suppressor assay (bottom panel). (D) Suppression by different Treg subsets presented as percent inhibition of Naive proliferation. Data are presented as mean + standard deviation of 3 donors. (E) Naive, TIGIThi rTreg, and TIGITlo rTreg activated in vitro with plate-bound anti-CD3 (3 μg/mL) and soluble anti-CD28 (1 μg/mL) antibodies and IL-2 (200 U/mL) for 3 days. Cells were supplemented with IL-2 at day 4 and analyzed for FOXP3 and IFN-γ production by intracellular staining at day 6. Data are representative of results from 3 individuals.
Expression of TIGIT on Treg and the Treg suppressor function. (A) TIGIT delineates human rTreg and aTreg. (B) Naive proliferation at day 4 in the absence of Treg. (C) TIGIT expression on Treg and Naive (top and middle panel) was analyzed at day 4 during a suppressor assay (bottom panel). (D) Suppression by different Treg subsets presented as percent inhibition of Naive proliferation. Data are presented as mean + standard deviation of 3 donors. (E) Naive, TIGIThi rTreg, and TIGITlo rTreg activated in vitro with plate-bound anti-CD3 (3 μg/mL) and soluble anti-CD28 (1 μg/mL) antibodies and IL-2 (200 U/mL) for 3 days. Cells were supplemented with IL-2 at day 4 and analyzed for FOXP3 and IFN-γ production by intracellular staining at day 6. Data are representative of results from 3 individuals.
Discussion
Demethylation of CpGs in the FOXP3 promoter12,50 and TSDR11,51 are stable epigenetic markers for nTreg. This has important implications for assessing T-cell status in humans in health and disease, illustrated by the fact that while expression of CD25 and FOXP3 leads to variable estimates of Treg frequency in people with type 1 diabetes10 or immune dysregulation, polyendocrinopathy, enteropathy, X-linked–like syndrome,52 TSDR demethylation quantitatively defines Treg frequency.52,53 Apart from being a useful lineage mark, demethylation at the FOXP3 locus is required to maintain the suppressor function of Treg. In this regard, FOXP3 binds to the demethylated TSDR to maintain its own transcription.13-16 We reasoned that other differences in DNA methylation across the genome might further elucidate the lineage and function of Treg. We detected 2315 individual DMPs comprising 127 RDMs between human rTreg and Naive cells and showed that DNA methylation in Naive was plastic and could be altered by cell activation. The latter was also recently described for mouse naive CD4+ T cells.54 Nevertheless, Act-Naive and rTreg retained the majority of the DNA methylation profile of their parent cells, and activation did not induce significant changes in DNA methylation in rTreg.
Inspired by the knowledge that FOXP3 binds to its own demethylated TSDR to maintain its expression, we examined whether FOXP3 was involved in regulating the expression of other Treg genes in a similar fashion. We found that CpGs within the genomic FOXP3 binding sites were significantly hypomethylated. Interestingly, genes activated by FOXP3 were enriched in the hypomethylated RDMs. Genes that are repressed by FOXP3 were not differentially methylated between rTreg and Naive. Ohkura et al45 reported that demethylation was “causative” for increased expression of some Treg signature genes, such as Helios and Eos. Other genes such as Il2, Ifng, and Zap70 were repressed by Foxp3 but showed no difference in DNA methylation. Complementary to their finding, we found that FOXP3 does not change DNA methylation at the TIGIT and FOXP3 loci in Act-Naive and iTreg. Instead, demethylation (within or outside CpG islands) allows FOXP3 to access its targets and exert its function. FOXP3 can act as a transcriptional activator and repressor. We propose that FOXP3 uses different mechanisms to regulate gene activation compared with repression. FOXP3 may directly enhance gene expression by binding to demethylated regions that contain a Forkhead-binding motif, as we demonstrated for TIGIT, MIR21, FOXP3, CTLA4, and CD25. In contrast, cofactors (eg, recruited to CpG island) may be required for FOXP3-mediated gene repression. Different modes of FOXP3 target binding and gene expression regulation have also been suggested by Samstein et al.55
Differential methylation could be associated with heterogeneity of Treg function, for which TIGIT may be illustrative. TIGIT is expressed by Treg47 and suppresses a range of immune cells, including T cells, dendritic cells, and NK cells.47-49 We found that hypomethylation at the TIGIT locus characterizes human Treg and that TIGIT expression allows activated Treg to be better distinguished from effector T cells ex vivo or after activation in vitro. It is likely that demethylation and FOXP3 binding regulate TIGIT expression and that TIGIT in turn prevents nTreg from becoming IFN-γ–secreting effector T cells. MIR21 is another example. The MIR21 locus is demethylated in Treg. In Naive CD4+ T cells, active demethylation occurs after T-cell activation. MIR21 overexpression is associated with human autoimmune diseases such as systemic lupus erythematosus, which is also characterized by aberrant DNA methylation of CD4+ T cells.56
In conclusion, it is sobering to consider that despite the broad genomic coverage of the Infinium 450k array (most RefSeq genes, promoters, 5′ UTRs, first exons, gene bodies, and 3′ UTR regions), the vast majority of CpGs in the genome are not probed by the array. Further characterization of individual DMPs and neighboring regions is required to fully appreciate the methylation landscape of human Treg and to identify potential biomarkers for the assessment of T-cell status in human disease.
The online version of this article contains a data supplement.
The publication costs of this article were defrayed in part by page charge payment. Therefore, and solely to indicate this fact, this article is hereby marked “advertisement” in accordance with 18 USC section 1734.
Acknowledgments
This work was supported by grants from the Australian National Health and Medical Research Council (program grant 305500 to L.C.H.) and Walter and Eliza Hall Institute Genomics Funding (to Y.Z.).
Y.Z. was a Juvenile Diabetes Research Foundation Post-doctoral Fellow, L.C.H. was a Senior Principal Research Fellow, A.O. was a Career Development Fellow of the National Health and Medical Research Council, and M.E.B. was a Queen Elizabeth II Fellow of the Australian Research Council. This work was made possible through Victorian State Government Operational Infrastructure Support and Australian National Health and Medical Research Council Research Institute Infrastructure Support Scheme.
Authorship
Contribution: Y.Z., M.E.B., and L.C.H. designed the experiments; Y.Z., G.N., and J.Q. performed all the experiments; J.M. and A.O. performed all the analysis; Y.Z. and J.M. drafted the manuscript; L.C.H., A.O., and M.E.B. contributed to the rewriting; and all authors contributed to discussions.
Conflict-of-interest disclosure: The authors declare no competing financial interests.
Correspondence: Alicia Oshlack, Murdoch Children's Research Institute, Royal Children's Hospital, 50 Flemington Rd, Parkville 3052, Australia; e-mail: alicia.oshlack@mcri.edu.au; and Leonard C. Harrison, The Walter and Eliza Hall Institute of Medical Research, 1G Royal Parade, Parkville, Victoria, 3052, Australia; e-mail: harrison@wehi.edu.au.
References
Author notes
Y.Z. and J.M. contributed equally to the work.

