Key Points
The integration of mutations and cytogenetic lesions improves the accuracy of survival prediction in chronic lymphocytic leukemia.
Abstract
The identification of new genetic lesions in chronic lymphocytic leukemia (CLL) prompts a comprehensive and dynamic prognostic algorithm including gene mutations and chromosomal abnormalities and their changes during clonal evolution. By integrating mutational and cytogenetic analysis in 1274 CLL samples and using both a training-validation and a time-dependent design, 4 CLL subgroups were hierarchically classified: (1) high-risk, harboring TP53 and/or BIRC3 abnormalities (10-year survival: 29%); (2) intermediate-risk, harboring NOTCH1 and/or SF3B1 mutations and/or del11q22-q23 (10-year survival: 37%); (3) low-risk, harboring +12 or a normal genetics (10-year survival: 57%); and (4) very low-risk, harboring del13q14 only, whose 10-year survival (69.3%) did not significantly differ from a matched general population. This integrated mutational and cytogenetic model independently predicted survival, improved CLL prognostication accuracy compared with FISH karyotype (P < .0001), and was externally validated in an independent CLL cohort. Clonal evolution from lower to higher risk implicated the emergence of NOTCH1, SF3B1, and BIRC3 abnormalities in addition to TP53 and 11q22-q23 lesions. By taking into account clonal evolution through time-dependent analysis, the genetic model maintained its prognostic relevance at any time from diagnosis. These findings may have relevant implications for the design of clinical trials aimed at assessing the use of mutational profiling to inform therapeutic decisions.
Medscape EDUCATION Continuing Medical Education online
This activity has been planned and implemented in accordance with the Essential Areas and policies of the Accreditation Council for Continuing Medical Education through the joint sponsorship of Medscape, LLC and the American Society of Hematology. Medscape, LLC is accredited by the ACCME to provide continuing medical education for physicians.
Medscape, LLC designates this Journal-based CME activity for a maximum of 1.0 AMA PRA Category 1 Credit(s)™. Physicians should claim only the credit commensurate with the extent of their participationin the activity.
All other clinicians completing this activity will be issued a certificate of participation. To participate in this journal CME activity: (1) review the learning objectives and author disclosures; (2) study the education content; (3) take the post-test with a 70% minimum passing score and complete the evaluation at http://www.medscape.org/journal/blood; and (4) view/print certificate. For CME questions, see page 1482.
Disclosures
Associate Editor John G. Gribben served as an advisor or consultant for Celgene and Roche and as a speaker or a member of a speakers bureau for Roche, Jensen, and Celgene. The authors and CME questions author Laurie Barclay, freelance writer and reviewer, Medscape, LLC, declare no competing financial interests.
Learning objectives
Upon completion of this activity, participants will be able to:
Describe 4 chronic lymphocytic leukemia (CLL) subgroups based on gene mutations and chromosomal abnormalities.
Describe the ability of this integrated mutational and cytogenetic model to predict survival and prognosis.
Describe clonal evolution in this model and its effect on predicting prognosis.
Release date: February 21, 2013; Expiration date: February 21, 2014
Introduction
The course of chronic lymphocytic leukemia (CLL) ranges from very indolent with a nearly normal life expectancy to rapidly progressive leading to early death.1,2 To better understand the genetic basis of CLL heterogeneity and improve prognostication of patients, all recurrent and clinically relevant molecular lesions should be combined into a comprehensive prognostic model.
Chromosomal aberrations and TP53 mutations are of key importance for predicting CLL outcome.3,4 Recently, next-generation sequencing has disclosed a further degree in the molecular complexity of CLL by revealing novel genetic lesions affecting the NOTCH1, SF3B1, MYD88, and BIRC3 genes.5-9 Alterations of these genes occur in approximately 5%-10% of CLL patients at diagnosis and, in the case of NOTCH1, SF3B1, and BIRC3, have shown significant correlations with survival in consecutive series from independent institutions.5-11 These findings prompt the integration of the newly discovered genetic lesions into a model based on both chromosomal abnormalities and gene mutations.
Available genetic prognostic models in CLL are based on the evaluation of risk factors detected at a specific time point.3,4 The appearance of additional genetic lesions during CLL course may dynamically modify patient survival, as suggested by the association between clonal evolution and poor prognosis, treatment resistance, and transformation.12-22 On these bases, a dynamic prognostic model based on a time-dependent analysis of CLL genetic lesions may prove useful for a better understanding of disease outcome. In the present study, we report an integrated mutational and cytogenetic model for CLL survival prediction that maintains its prognostic relevance in a time-dependent fashion.
Methods
Patients
Time-fixed analysis at diagnosis was based on a training series of 637 newly diagnosed and previously untreated CLL patients of whom 583 (91.5%) were provided with regular follow-up. Among CLL from the training series that required treatment, 122 of 266 (45.8%) patients received rituximab-based regimens (ie, fludarabine-cyclophosphamide-rituximab, fludarabine-rituximab, or pentostatin-cyclophosphamide-rituximab), 64 of 266 (24.0%) received fludarabine-based regimens (ie, fludarabine or fludarabine-cyclophosphamide), and 80 of 266 (30.1%) received alkylator-based regimens (ie, chlorambucil). To externally validate the results of the time-fixed analysis, an independent cohort of 370 newly diagnosed and previously untreated CLL patients was also investigated. Time-dependent analysis and analysis of clonal evolution were based on a single-institution cohort of 257 CLL patients of the training series with sequential tumor samples (n = 469) and clinical information prospectively collected at clinically relevant time points (ie, at diagnosis, progression, and last follow-up). Further details of the study populations are available in supplemental Table 1 and supplemental Methods (available on the Blood Web site; see the Supplemental Materials link at the top of the online article). CLL diagnosis was according to 2008 International Workshop on Chronic Lymphocytic Leukemia-National Cancer Institute criteria (IWCLL-NCI) and confirmed by a flow cytometry score > 3 in all cases.2 Monoclonal B-cell lymphocytosis were excluded. The study was approved by the institutional ethical committee (protocol code 59/CE; study number CE 8/11). Patients provided informed consent in accordance with local institutional review board requirements and the Declaration of Helsinki.
Samples
Overall, 1274 CLL samples were subjected to mutational and FISH analysis. CLL samples were extracted from fresh or frozen PBMCs isolated by Ficoll-Paque gradient centrifugation. In all cases, the fraction of tumor cells corresponded to > 70% as assessed by flow cytometry. Matched normal DNA from the same patient was obtained from saliva or from purified granulocytes and was confirmed to be tumor-free by PCR of tumor-specific IGHV-D-J rearrangements. High-molecular-weight genomic DNA was extracted from tumor and healthy samples according to standard procedures. DNA was quantified by the NanoDrop 2000C spectrophotometer (Thermo Scientific).
Molecular studies
The mutation hot spots of the TP53 (exons 4-9, including splicing sites; RefSeq NM_000546.5), NOTCH1 (exon 34; including splicing sites; RefSeq NM_017617.2), SF3B1 (exons 14, 15, 16, 18, including splice sites; RefSeq NM_012433.2), MYD88 (exons 3, 5, including splicing sites; RefSeq NM_002468.4), and BIRC3 (exons 6-9, including splicing sites; RefSeq NM_001165.4) genes were analyzed by PCR amplification and DNA direct sequencing of high-molecular-weight genomic DNA.8,10,11 The mutant allele frequency was estimated by next-generation sequencing.5 Amplicons known to harbor TP53, NOTCH1, SF3B1, MYD88, or BIRC3 mutations by Sanger sequencing were reamplified from genomic DNA by oligonucleotides containing the gene-specific sequences, along with the 10-bp MID tag for multiplexing and amplicon library A and B sequencing adapters. The obtained amplicon library was subjected to deep sequencing on the Genome Sequencer Junior instrument (454 Life Sciences).5 To obtain approximately 700-fold coverage per amplicon, no more than 100 amplicons/run were analyzed. The obtained sequencing reads were mapped to reference sequences and analyzed by the Amplicon Variant Analyzer Version 2.7 software (Roche) to establish the mutant allele frequency. Probes used for FISH analysis were: (1) LSID13S319, CEP12, LSIp53, and LSIATM (Abbott) and (2) RP11-177O8 (BIRC3) BAC clone.11 Further details of the molecular studies are available in supplemental Methods.
Statistical analysis
Overall survival (OS) was the primary end point and was measured from the date of initial presentation to the date of death from any cause (event) or last follow-up (censoring). Treatment-free survival was measured from date of initial presentation to date of progressive disease requiring treatment according to IWCLL-NCI guidelines (event), death or last follow-up (censoring).2 Survival analysis was performed by the Kaplan-Meier method. The crude and adjusted association between time-fixed exposure variables at diagnosis and OS was estimated by Cox regression. The stability of the Cox model was internally validated using bootstrapping procedures.23,24 Recursive partitioning was applied to divide patients in genetic subgroups with different outcome.25 The stability of the recursive decision tree was validated by the random survival forest method.26 An amalgamation algorithm was used to merge terminal nodes showing homogenous survival.25 Relative survival, defined as the ratio between the actuarial survival observed in the CLL cohort and the expected survival of the general Italian population matched to CLL patients by sex, age, and calendar year of diagnosis, was calculated using the Ederer II method. Time to acquisition of a risk factor was estimated considering death as a competing risk and was compared across groups with the Gray test. The crude and adjusted effect of time-varying prognostic factors was assessed by time-dependent Cox regression. Landmark analysis was used to illustrate the effect of time-varying prognostic factors. Associations and anti-associations between genetic lesions were assessed by Fisher exact test corrected for multiple comparisons by the Bonferroni test. The number of cases (n = 637) allowed us to identify all possible cooccurring genetic lesions in the study and exclusive alterations in genetic lesions that occurred in at least 8.6% of cases. Categorical variables were compared by χ2 test and Fisher exact test when appropriate. Continuous variables were compared by Mann-Whitney (2 unrelated samples) or Wilcoxon (2 related samples) tests. All statistical tests were 2-sided. Statistical significance was defined as P < .05. The analysis was performed with SPSS Version 20.0 and R Version 2.15.1 (http://www.r-project.org) software. Further details of the statistical analysis are available in supplemental Methods.
Results
Mutational complementation groups and independent prognostic value of genetic lesions in newly diagnosed CLL patients
As a preliminary step toward the construction of an integrated mutational and cytogenetic model, we assessed the prevalence and independent prognostic value of the candidate genetic lesions in the training series of 637 CLL patients (supplemental Tables 1-3). Del13q14 and +12 distributed in a mutually exclusive fashion (P < .0001; supplemental Figures 1 and 2). With the sole exception of the expected association between NOTCH1 mutations and +12 CLL (P = .0014),27,28 the prevalence of other genetic lesions did not differ among molecular subgroups (supplemental Figures 1 and 2). Consistent with a dual hit mechanism of inactivation, mutations of both TP53 and BIRC3 frequently cooccurred with deletion of the corresponding locus (P < .0001 and P = .0065, respectively; supplemental Figures 1 and 2).
Analysis of FISH abnormalities reproduced the previously described prognostic groups in this study cohort (supplemental Figure 3 and supplemental Table 3).3 Patients harboring del17p13 and TP53 mutations in the absence of del17p13 showed an identical outcome in the study cohort and therefore were combined for the analysis of outcome.13 Among new CLL lesions, survival analysis confirmed the independent prognostic value of NOTCH1, SF3B1, and BIRC3 abnormalities (supplemental Table 3). MYD88 mutations had no prognostic effect (P = .1728), although the study was adequately powered (90%) for detecting the impact of these low-frequency (approximately 4%) mutations on survival.
This preliminary assessment provided the rationale for including alterations of NOTCH1, SF3B1, and BIRC3 in addition to standard FISH lesions and TP53 mutations in the subsequent development of an integrated mutational and cytogenetic model.
Integrated mutational and cytogenetic model for CLL prognostication
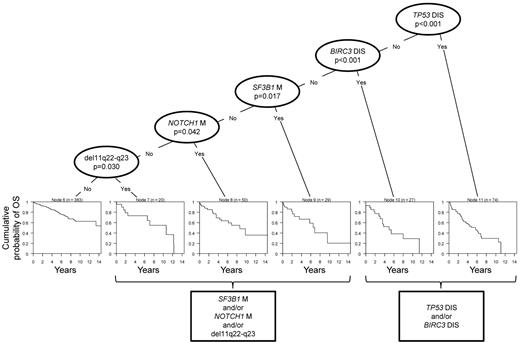
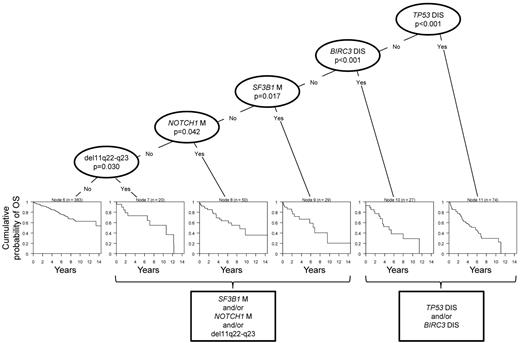
The hierarchical order of relevance of the genetic lesions in predicting CLL survival was established by recursive partitioning analysis of the training series (Figure 1).25,26 TP53 disruption was the most predictive genetic variable in the survival tree, followed by BIRC3 disruption, mutations of SF3B1 and NOTCH1, and the del11q22-q23 mutation (Figure 1). In CLL patients lacking these abnormalities, +12 and del13q14 further stratified outcome. Measurement of the variable importance validated the hierarchical order of relevance of the genetic lesions established by the recursive partitioning analysis and confirmed the stability of the decision tree (supplemental Table 4).26 Based on the application of the amalgamation algorithm to the terminal nodes,25 cases harboring TP53 abnormalities and cases harboring BIRC3 abnormalities were grouped into a single category, as well as cases harboring NOTCH1 mutations, SF3B1 mutations, or the del11q22-q23 mutation. This approach allowed us to establish an integrated mutational and cytogenetic model for classifying newly diagnosed CLL patients according to risk of death.
Decision tree resulting from recursive partitioning analysis and amalgamation in the training series. Disruption of TP53 and BIRC3, mutations of SF3B1 and NOTCH1, and del11q22-q23 were the factors selected by the algorithm to split the patient population in 6 terminal nodes. Presence or absence of the TP53 disruption independent of cooccurring genetic lesions was the most significant covariate for the entire study population. Among patients lacking TP53 abnormalities, the most significant covariate was BIRC3 disruption. Among patients lacking both TP53 and BIRC3 abnormalities, the most significant covariate was SF3B1 mutation status. Among patients lacking TP53, BIRC3, and SF3B1 lesions, the most significant covariate was NOTCH1 mutation status. Among patients lacking TP53, BIRC3, SF3B1, and NOTCH1 lesions, the most significant covariate was del11q22-q23. Based on the application of the amalgamation algorithm to the terminal nodes, patients harboring TP53 abnormalities and those harboring BIRC3 abnormalities were grouped into a single category, as well as patients harboring NOTCH1 mutations, SF3B1 mutations, or del11q22-q23. Genetic lesions are represented from right to left according to their hierarchical order of relevance in splitting the parent node into daughter nodes with significantly different survival probabilities. The P value corresponds to the log-rank test adjusted for multiple comparisons. The right branch of each split represents the presence of the lesion. The left branch of each split represents the absence of the lesion. The Kaplan-Meier curves estimate the OS of patients belonging to each terminal node. N indicates the number of patients in the node; M, mutation; and DIS, disruption.
Decision tree resulting from recursive partitioning analysis and amalgamation in the training series. Disruption of TP53 and BIRC3, mutations of SF3B1 and NOTCH1, and del11q22-q23 were the factors selected by the algorithm to split the patient population in 6 terminal nodes. Presence or absence of the TP53 disruption independent of cooccurring genetic lesions was the most significant covariate for the entire study population. Among patients lacking TP53 abnormalities, the most significant covariate was BIRC3 disruption. Among patients lacking both TP53 and BIRC3 abnormalities, the most significant covariate was SF3B1 mutation status. Among patients lacking TP53, BIRC3, and SF3B1 lesions, the most significant covariate was NOTCH1 mutation status. Among patients lacking TP53, BIRC3, SF3B1, and NOTCH1 lesions, the most significant covariate was del11q22-q23. Based on the application of the amalgamation algorithm to the terminal nodes, patients harboring TP53 abnormalities and those harboring BIRC3 abnormalities were grouped into a single category, as well as patients harboring NOTCH1 mutations, SF3B1 mutations, or del11q22-q23. Genetic lesions are represented from right to left according to their hierarchical order of relevance in splitting the parent node into daughter nodes with significantly different survival probabilities. The P value corresponds to the log-rank test adjusted for multiple comparisons. The right branch of each split represents the presence of the lesion. The left branch of each split represents the absence of the lesion. The Kaplan-Meier curves estimate the OS of patients belonging to each terminal node. N indicates the number of patients in the node; M, mutation; and DIS, disruption.
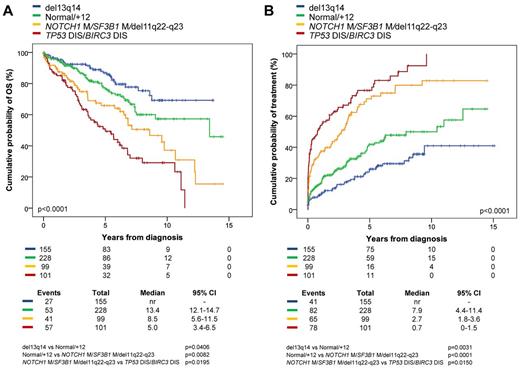
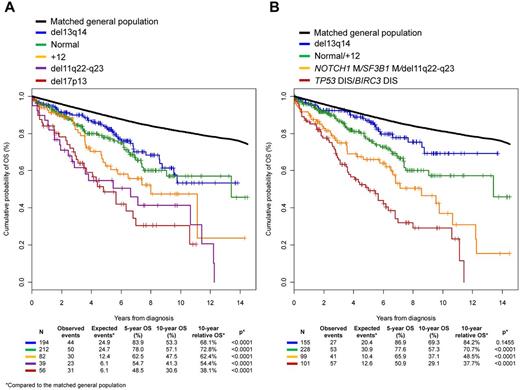
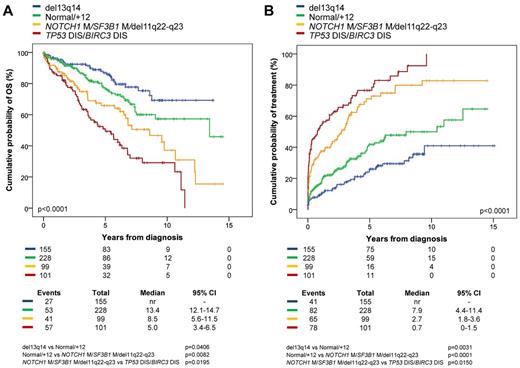
Four CLL subgroups were classified hierarchically (Figure 2). The high-risk category included patients harboring TP53 disruption and/or BIRC3 disruption independent of cooccurring lesions (5-year OS: 50.9%; 10-year OS: 29.1%; Figure 2A). When the demographic effects of age, sex, and year of diagnosis were compensated, the 10-year life expectancy of high-risk patients was only 37.7% of that expected in the matched general population (P < .0001; Figure 3B).
Kaplan-Meier estimates of OS and treatment-free survival according to the integrated mutational and cytogenetic model in the training series. (A) OS. (B) Probability of progressive disease requiring treatment according to IWCLL-NCI guidelines as indicated by treatment-free interval. Cases harboring TP53 and/or BIRC3 disruption (TP53 DIS/BIRC3 DIS) independent of cooccurring genetic lesions are represented by the red line. Patients harboring NOTCH1 mutations (NOTCH1 M) and/or SF3B1 mutations (SF3B1 M) and/or del11q22-q23 in the absence of TP53 and BIRC3 disruption are represented by the yellow line. Patients harboring +12 in the absence of the TP53 disruption, BIRC3 disruption, NOTCH1 mutations, SF3B1 mutations, and del11q22-q23 and patients wild-type for all genetic lesions (normal) are represented by the green line. Cases harboring del13q14 as the sole genetic lesion are represented by the blue line. nr indicates not reached.
Kaplan-Meier estimates of OS and treatment-free survival according to the integrated mutational and cytogenetic model in the training series. (A) OS. (B) Probability of progressive disease requiring treatment according to IWCLL-NCI guidelines as indicated by treatment-free interval. Cases harboring TP53 and/or BIRC3 disruption (TP53 DIS/BIRC3 DIS) independent of cooccurring genetic lesions are represented by the red line. Patients harboring NOTCH1 mutations (NOTCH1 M) and/or SF3B1 mutations (SF3B1 M) and/or del11q22-q23 in the absence of TP53 and BIRC3 disruption are represented by the yellow line. Patients harboring +12 in the absence of the TP53 disruption, BIRC3 disruption, NOTCH1 mutations, SF3B1 mutations, and del11q22-q23 and patients wild-type for all genetic lesions (normal) are represented by the green line. Cases harboring del13q14 as the sole genetic lesion are represented by the blue line. nr indicates not reached.
Observed OS in patients from the training series compared with the expected OS in the matched general population. OS in CLL patients stratified according to the FISH cytogenetic model (A) and the integrated mutational and cytogenetic model (B) relative to the expected OS in the age-, sex-, and calendar year of diagnosis–matched general population (black line). (A) Patients harboring del17p13 irrespective of cooccurring cytogenetic lesions are represented by the red line. Patients harboring del11q22-q23 in the absence of del17p13 are represented by the purple line. Patients harboring +12 in the absence of del17p13 and del11q22-q23 are represented by the yellow line. Patients harboring a normal FISH karyotype are represented by the green line. Patients harboring del13q14 deletion in the absence of other cytogenetic abnormalities are represented by the blue line. (B) Patients harboring TP53 and/or BIRC3 disruption (TP53 DIS/BIRC3 DIS) independent of cooccurring genetic lesions are represented by the red line. Patients harboring NOTCH1 mutations (NOTCH1 M) and/or SF3B1 mutations (SF3B1 M) and/or del11q22-q23 in the absence of TP53 and BIRC3 disruption are represented by the yellow line. Patients harboring +12 in the absence of TP53 disruption, BIRC3 disruption, NOTCH1 mutations, SF3B1 mutations, and del11q22-q23, and patients wild-type for all genetic lesions (normal) are represented by the green line. Patients harboring del13q14 as the sole genetic lesion are represented by the blue line.
Observed OS in patients from the training series compared with the expected OS in the matched general population. OS in CLL patients stratified according to the FISH cytogenetic model (A) and the integrated mutational and cytogenetic model (B) relative to the expected OS in the age-, sex-, and calendar year of diagnosis–matched general population (black line). (A) Patients harboring del17p13 irrespective of cooccurring cytogenetic lesions are represented by the red line. Patients harboring del11q22-q23 in the absence of del17p13 are represented by the purple line. Patients harboring +12 in the absence of del17p13 and del11q22-q23 are represented by the yellow line. Patients harboring a normal FISH karyotype are represented by the green line. Patients harboring del13q14 deletion in the absence of other cytogenetic abnormalities are represented by the blue line. (B) Patients harboring TP53 and/or BIRC3 disruption (TP53 DIS/BIRC3 DIS) independent of cooccurring genetic lesions are represented by the red line. Patients harboring NOTCH1 mutations (NOTCH1 M) and/or SF3B1 mutations (SF3B1 M) and/or del11q22-q23 in the absence of TP53 and BIRC3 disruption are represented by the yellow line. Patients harboring +12 in the absence of TP53 disruption, BIRC3 disruption, NOTCH1 mutations, SF3B1 mutations, and del11q22-q23, and patients wild-type for all genetic lesions (normal) are represented by the green line. Patients harboring del13q14 as the sole genetic lesion are represented by the blue line.
The intermediate-risk category included patients harboring NOTCH1 and/or SF3B1 mutations and/or del11q22-q23 in the absence of TP53 and BIRC3 abnormalities (5-year OS: 65.9%; 10-year OS 37.1%; Figure 2A). The 10-year life expectancy of intermediate-risk patients was only 48.5% of that expected in the matched general population (P < .0001; Figure 3B).
The low-risk category (5-year OS: 77.6%; 10-year OS: 57.3%) comprised both patients harboring +12 and patients wild-type for all genetic lesions (ie, healthy patients; Figure 2A). Despite experiencing an indolent behavior, the 10-year life expectancy of low-risk patients was 70.7% of that expected in the matched general population (P < .0001; Figure 3B).
The very low-risk category included patients harboring del13q14 as the sole genetic lesion (5-year OS: 86.9%; 10-year OS 69.3%; Figure 2A). The 10-year life expectancy of very low-risk patients was only slightly (84.2%) and was not significantly (P = .1455) lower than that expected in the matched general population (Figure 3B). Consistent with the small excess mortality experienced by very low-risk CLL patients compared with the matched general population, the cause of death in this subgroup was unrelated to CLL in many patients (16 of 27, 59.2%). In the remaining patients, the cause of death was second cancer (4 of 27, 14.8%), infection (4 of 27, 14.8%), and progressive CLL (3 of 27, 11.1%).
Differences in outcome among the 4 subgroups were consistent with differences in the prevalence of unfavorable clinical and biologic features at presentation (supplemental Table 5) and differences in disease progression as indicated by treatment-free survival (Figure 2B).
Because the higher-risk genetic groups contained more patients with advanced-stage disease, we also limited the survival analysis to Rai stage 0-I CLL. Consistent with the results obtained in the whole CLL population, the genetic model also stratified 4 genetic subgroups in early-stage CLL (supplemental Figure 4).
To provide a preliminary signal on the reproducibility of the prognostic model in patients treated with rituximab-containing regimens, we analyzed the impact of the model on: OS from presentation in patients from the training series who received the diagnosis in 2005 or afterward29 (in this time frame, 67.5% of cases requiring treatment received rituximab-based regimens) and OS from first treatment in a consecutive single-institution cohort of 62 patients who received fludarabine-cyclophosphamide-rituximab and were provided with tumor samples and clinical information prospectively collected at first progression. Consistent with the results obtained in the whole CLL population, the genetic model also stratified 4 genetic subgroups in these patients (supplemental Figure 5).
These data establish the hierarchical order of relevance of recurrent mutations and cytogenetic lesions in CLL and identify 4 distinct prognostic subgroups.
The integrated mutational and cytogenetic model is an independent and reproducible predictor of OS in CLL
Multivariate analysis selected the genetic model as an independent risk factor of OS in the training series (ptrend = 0.0010), along with age (P < .0001), Rai stage (ptrend < 0.0001), and unmutated IGHV genes (P = .0036; Table 1). Internal validation on 1000 bootstrap samples confirmed the stability of the genetic model as a prognostic factor for OS in the training series (Table 1).
Survival analysis in an independent external validation series of 370 newly diagnosed CLL patients confirmed: (1) the more general reproducibility of the genetic model in predicting OS (supplemental Figure 6), (2) its capacity of discriminating patient outcome (c-index in the validation series was 0.662 vs 0.642 in the training series), and (3) its independent prognostic value (ptrend = 0.0053) when adjusted for other confounding covariates (supplemental Table 6).
Based on these data, the genetic model represents one of the most important independent prognosticators of CLL survival in both the training and the validation cohorts.
Inclusion of mutations in addition to FISH abnormalities significantly improves the accuracy of CLL prognostication
Overall, approximately 20% (105 of 488) of lower risk patients according to the FISH cytogenetic model,3 including 20.1% (39 of 194) del13q14-only CLL, were reclassified into higher-risk subgroups by the integrated mutational and cytogenetic model because of the cooccurrence of NOTCH1, SF3B1, and TP53 mutations or BIRC3 disruption (supplemental Table 7). Consistently, the inclusion of TP53, NOTCH1, and SF3B1 mutations and of BIRC3 lesions in addition to FISH abnormalities significantly improved the accuracy of survival prediction (c-index: 0.617 vs 0.642; P < .0001; Figure 3).
Based on the sole FISH assessment, the life expectancy of del13q14-only CLL patients was significantly lower (68.1% at 10 years; P < .0001) than that expected in the matched general population (Figure 3A). Conversely, the genetic model segregated a subgroup of patients with del13q14 only who lacked other genetic alterations and showed an expected survival not significantly different from that of the matched general population (Figure 3B). This subgroup of del13q14-only CLL patients displayed a preferential usage of mutated IGHV genes (80.9% vs 42.1% in del13q14 CLL with cooccurring mutations).
We conclude that integrating mutations and cytogenetic lesions proves useful in refining the prognosis of CLL and helps to identify a subgroup of patients with extremely indolent disease.
Assessment of clonal evolution in CLL by integrated mutational and cytogenetic analysis
To clarify the evolution of NOTCH1, SF3B1, and BIRC3 lesions, we repeatedly analyzed CLL patients provided with > 2 sequential samples (n = 202) followed for at least 2 years after presentation (median interval between baseline and last sequential sample: 62.8 months; range, 24-150 months). FISH lesions and TP53 mutations were also investigated.
Overall, 36 (17.8%) of the sequentially investigated patients developed 59 new genetic lesions during disease course, mainly represented by TP53, NOTCH1, SF3B1, BIRC3, and del11q22-q23 abnormalities (54 of 59, 91.5%; supplemental Tables 8 and 9). The median time to clonal evolution was 3 years (95% confidence interval [CI], 1.9-4.0). The median follow-up of patients who developed clonal evolution was 6.1 years (95% CI, 4.9-7.4 years). The median follow-up of patients who did not develop clonal evolution was 5.3 years (95% CI, 4.8-5.7 years). No patient developed a new +12 or a new monoallelic del13q14, whereas development of biallelic del13q14 (ie, new del13q14 on the second chromosome after initially monoallelic del13q14) was restricted to 4 (1.9%) patients.
Among cases that were informative at presentation, TP53, NOTCH1, SF3B1, MYD88, and BIRC3 mutant allele frequency did not significantly change during disease course (supplemental Figure 7). Clonal fluctuation, defined as the disappearance of a mutated clone, occurred in only 3 patients; in all 3, the baseline mutated clone was substituted by a second clone harboring a new high-risk mutation (supplemental Figure 8 and supplemental Table 8).
These data document that, like TP53 abnormalities and del11q22-q23, also NOTCH1, SF3B1, and BIRC3 lesions may emerge during clonal evolution.
Baseline factors associated with high-risk clonal evolution
To investigate the dynamics of acquisition of high-risk genetic lesions during follow-up, we evaluated the time to clonal evolution and its modifications according to disease characteristics at diagnosis after adjusting for death as a competing risk.
At 10 years from diagnosis, 24.5% of CLL patients belonging to the very-low- and low-risk genetic subgroups had developed new TP53, NOTCH1, SF3B1, BIRC3, or del11q22-q23 lesions because of clonal evolution and therefore were switched to a higher-risk category in the genetic model. Clinical features at presentation predicting the development of new high-risk genetic lesions were age > 65 years (P = .0192), high LDH (P = .0093), and unmutated IGHV genes (P = .0087; Figure 4A-C).
Cumulative incidence of high-risk clonal evolution. Time to high-risk clonal evolution was defined as the time elapsed from diagnosis to the date of development of TP53 abnormalities, BIRC3 abnormalities, NOTCH1 mutations, SF3B1 mutations, or del1q22-q23 (events) or last follow-up or death (censoring). Analysis was performed using death as a competing risk. Only patients who did not present high-risk abnormalities at diagnosis were included in this analysis. (A-D) Cumulative incidence of clonal evolution according to age > 65 years (hazard ratio [HR] = 4.18; 95% CI, 1.26-13.8; 5-year risk: 17.1%, 10-year risk: 32.9%;), high LDH (HR = 3.15; 95% CI, 1.32-7.55; 5-year risk: 24.8%, 9-year risk: 62.8%), unmutated IGHV genes (HR = 2.89; 95% CI, 1.31-6.39; 5-year risk: 18.5%, 9-year risk: 50.8%), +12 or a normal genetics (HR = 2.29; 95% CI, 1.03-5.10; 5-year risk: 13.8%, 9-year risk: 34.5%).
Cumulative incidence of high-risk clonal evolution. Time to high-risk clonal evolution was defined as the time elapsed from diagnosis to the date of development of TP53 abnormalities, BIRC3 abnormalities, NOTCH1 mutations, SF3B1 mutations, or del1q22-q23 (events) or last follow-up or death (censoring). Analysis was performed using death as a competing risk. Only patients who did not present high-risk abnormalities at diagnosis were included in this analysis. (A-D) Cumulative incidence of clonal evolution according to age > 65 years (hazard ratio [HR] = 4.18; 95% CI, 1.26-13.8; 5-year risk: 17.1%, 10-year risk: 32.9%;), high LDH (HR = 3.15; 95% CI, 1.32-7.55; 5-year risk: 24.8%, 9-year risk: 62.8%), unmutated IGHV genes (HR = 2.89; 95% CI, 1.31-6.39; 5-year risk: 18.5%, 9-year risk: 50.8%), +12 or a normal genetics (HR = 2.29; 95% CI, 1.03-5.10; 5-year risk: 13.8%, 9-year risk: 34.5%).
Consistent with their inferior OS probability, patients belonging to the low-risk subgroup according to the genetic model (ie, those harboring +12 or normal genetics) showed a significantly higher probability of developing poor-risk genetic lesions and of being changed to the intermediate- or high-risk subgroups compared with very-low-risk CLL patients harboring del13q14 only (P = .0435; Figure 4D). The increased risk of clonal evolution in patients harboring +12 or a normal genotype may be explained by the higher prevalence of unmutated IGHV genes (supplemental Table 5) and the higher risk of treatment requirement (Figure 2) compared with del13q14-only CLL patients.
Impact of high-risk clonal evolution on CLL survival
In traditional Kaplan-Meier or Cox regression analysis, a risk factor measured at baseline is usually related to mortality thereafter. However, the development of poor-risk factors during disease course may substantially modify patient outcome and estimates of prognosis should improve if such time-dependent changes are taken into account. Therefore, we investigated whether the assessment of clonal evolution contributes to improve OS prediction using a time-dependent Cox regression analysis. This analysis included variables considered “fixed” in time (ie, sex and IGHV mutation status) and time-varying variables (ie, age, Rai stage, and status of the genetic lesions) that were repeatedly assessed at clinically relevant time points (ie, disease progression or last follow-up).
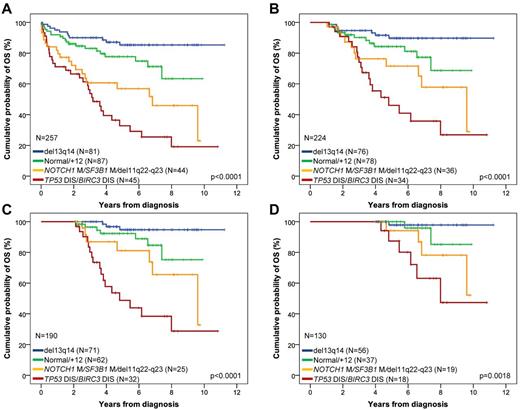
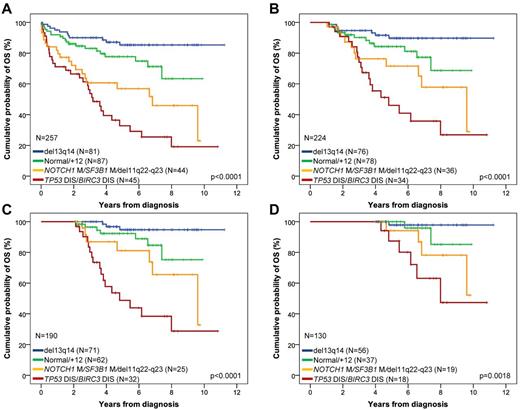
Time-varying genetic lesions associated with short OS were TP53 disruption (P < .0001), BIRC3 disruption (P = .0166), and NOTCH1 mutations (P = .0247). SF3B1 mutations were of borderline significance (P = .0766; supplemental Table 10). Dynamic changes of the genetic model due to clonal evolution retained a statistically significant impact on OS (ptrend = 0.0003) that was independent of modifications affecting other time-varying factors such as age and disease stage (supplemental Table 11). Consistently, the genetic model stratified CLL patient OS at 1, 2, and 4 years from diagnosis by landmark analysis (Figure 5).
Landmark analysis of the cumulative probability of OS according to the integrated mutational and cytogenetic model. (A) Diagnosis. (B) Landmark at 1 year. (C) Landmark at 2 years. (D) Landmark at 4 years. Patients harboring TP53 and/or BIRC3 disruption (TP53 DIS/BIRC3 DIS) independent of cooccurring genetic lesions are represented by the red line. Patients harboring NOTCH1 mutations (NOTCH1 M) and/or SF3B1 mutations (SF3B1 M) and/or del11q22-q23 in the absence of TP53 and BIRC3 disruption are represented by the yellow line. Patients harboring +12 in the absence of TP53 disruption, BIRC3 disruption, NOTCH1 mutations, SF3B1 mutations, and del11q22-q23 and patients wild-type for all genetic lesions (normal) are represented by the green line. Patients harboring del13q14 as the sole genetic lesion are represented by the blue line.
Landmark analysis of the cumulative probability of OS according to the integrated mutational and cytogenetic model. (A) Diagnosis. (B) Landmark at 1 year. (C) Landmark at 2 years. (D) Landmark at 4 years. Patients harboring TP53 and/or BIRC3 disruption (TP53 DIS/BIRC3 DIS) independent of cooccurring genetic lesions are represented by the red line. Patients harboring NOTCH1 mutations (NOTCH1 M) and/or SF3B1 mutations (SF3B1 M) and/or del11q22-q23 in the absence of TP53 and BIRC3 disruption are represented by the yellow line. Patients harboring +12 in the absence of TP53 disruption, BIRC3 disruption, NOTCH1 mutations, SF3B1 mutations, and del11q22-q23 and patients wild-type for all genetic lesions (normal) are represented by the green line. Patients harboring del13q14 as the sole genetic lesion are represented by the blue line.
These results document the prognostic relevance of developing high-risk genetic lesions during CLL course and show that the genetic model maintains its prognostic impact at any time from diagnosis.
Discussion
In the present study, we provide an integrated mutational and cytogenetic model for CLL prognostication that: (1) allows the segregation of 4 patient subgroups with distinct risks of death in a fashion that is reproducible and independent from other well-established prognosticators, (2) takes into account clonal evolution, and (3) maintains its independent prognostic relevance at any time point from diagnosis.
In terms of discriminating patient course, the integrated mutational and cytogenetic model significantly adds to the model based solely on FISH karyotype.3 Because of the cooccurrence of unfavorable mutations, approximately 20% of patients belonging to low-risk cytogenetic subgroups were reclassified into 1 of the 2 highest-risk genetic categories. This refinement allows the segregation of a subgroup of CLL patients harboring del13q14 only, which accounts for a relevant fraction (approximately 25%) of newly diagnosed patients and shows an expected survival only slightly, though not significantly, lower than that of the general population. The small residual excess mortality observed in this subgroup may be due to the inclusion in the case mixture of patients harboring poor-risk genetic lesions that are currently unknown and/or patients with a complex karyotype that was not captured by FISH approaches.30 The very favorable outcome of del13q14-only CLL may be explained by their slow progression rate (approximately 4% per year), documenting that del13q14-only CLL is a highly stable clinical entity. Notably, the progression rate of del13q14-only CLL is in the order of magnitude of that described in other conditions considered as premalignant.31,32
Recursive partitioning allowed us to determine that SF3B1 and NOTCH1 mutations are hierarchically classified after TP53 and BIRC3 lesions. Consistently, patients harboring NOTCH1 or SF3B1 mutations but purged of TP53 and BIRC3 abnormalities showed an intermediate-risk profile similar to del11q22-q23 CLL.3,33 TP53 abnormalities play a central role in our understanding of the poor prognosis of high-risk CLL patients, but fail to explain the molecular basis of a substantial fraction of high-risk patients.3,4,33 According to the model proposed in this study, BIRC3 abnormalities complement TP53 disruption in the identification of high-risk patients. This observation is consistent with the fact that BIRC3 abnormalities occur in approximately 40% of chemorefractory but TP53 wild-type CLL patients but are absent in chemosensitive cases.11
Even if they are absent at presentation, NOTCH1, SF3B1, and BIRC3 lesions may emerge during disease course, thus expanding the spectrum of genetic events currently associated with high-risk clonal evolution that were so far limited to TP53 abnormalities and del11q22-q23.12-22 Overall, the probability of developing new high-risk genetic lesions is substantial (approximately 25% at 10 years), and the acquisition of high-risk genetic lesions over time affects survival in a manner that is independent of modifications of other time-varying factors such as patient age and disease stage. On these bases, one additional goal of the present study was to establish a dynamic model accounting for all prognostically meaningful genetic lesions and their modifications during disease course because of clonal evolution. According to this dynamic approach, the integrated mutational and cytogenetic model retains its prognostic relevance at any time point during the clinical course, and the hazard of death increases any time a CLL patient shifts to a higher-risk category of the genetic model. These results point to the relevance of sequentially reassessing the parameters of the genetic model when an updated genetic status is required for redefining the precise prognosis of the patient.
The probability of undergoing clonal evolution is not uniform across CLL patients, but varies according to patient age and baseline features of the disease. Although IGHV mutation status has been already associated with clonal evolution in CLL,12,34 the relationship between aging and instability of the leukemic clone is an unexpected finding of the present study and may be related to a decline in genomic maintenance mechanisms in older patients or a greater propensity of elderly patients to positively select and expand clones harboring high-risk genetic lesions.35-37
Regarding the impact on clonal evolution of the baseline genetics of the clone, low-risk CLL patients harboring +12 or a normal genotype at diagnosis are characterized by a approximately 2-fold higher probability of developing poor-risk genetic lesions and of switching to the highest-risk genetic subgroups compared with very-low-risk CLL patients harboring del13q14 only. The relative instability of the leukemic clone in CLL with +12 or a normal genotype might explain why these patients experience a shorter survival compared with del13q14-only CLL.
Given the growing number of new targeted agents, the management of CLL will conceivably be revised and early intervention may also become an option.38,39 In this changing scenario,38,39 there is increasing interest in the use of prognostic markers that may guide the management of patients from the early phases of the disease. Our findings may have relevant implications for the design of clinical trials aimed at testing early intervention approaches. In fact, very-low-risk cases harboring del13q14 only may not gain any additional benefit from early treatment because of their indolent course, low risk of clonal evolution, and nearly normal life expectancy.
These data show that the integrated mutational and cytogenetic model can classify CLL patients into more precise subgroups, advance our understanding of the molecular heterogeneity of CLL, and improve current prognostic algorithms. Future challenges are to design rapid and affordable molecular assays and to define prospectively whether specific treatments may overcome the poor prognosis conferred by higher-risk lesions.
The online version of this article contains a data supplement.
The publication costs of this article were defrayed in part by page charge payment. Therefore, and solely to indicate this fact, this article is hereby marked “advertisement” in accordance with 18 USC section 1734.
Acknowledgments
This study was supported by the Associazione Italiana per la Ricerca sul Cancro Foundation, Special Program Molecular Clinical Oncology, 5 × 1000, number 10007, Milan, Italy (to G.G. and to R.F.); Progetto Futuro in Ricerca 2008 (to D.R.); Programmi di Ricerca di Rilevante Interesse Nazionale (PRIN) 2008 (to G.G. and R.M.); PRIN 2009 (to D.R.); Progetto Futuro in Ricerca 2012 (to D.R.); Ministero dell'Istruzione, dell'Università e della Ricerca, Rome, Italy; Progetto Giovani Ricercatori 2008 (to D.R.); Progetto Giovani Ricercatori 2010 (to D.R.); Ricerca Sanitaria Finalizzata 2008 (to G.G.); Ministero della Salute, Rome, Italy; Novara-AIL Onlus Foundation, Novara, Italy (to G.G. and D.R.); Compagnia di San Paolo, Turin, Italy (to R.F.); Helmut Horten Foundation and San Salvatore Foundation, Lugano, Switzerland (to F.B.); Nelia et Amadeo Barletta Foundation, Lausanne (to F.B.); National Institutes of Health grant PO1-CA092625 (to R.D.-F.); and a Specialized Center of Research grant from the Leukemia & Lymphoma Society (to R.D.-F.). S.M. and S.C. are supported by fellowships from the Novara-AIL Onlus Foundation, Novara, Italy. L.P. is on leave from the University of Perugia Medical School.
National Institutes of Health
Authorship
Contribution: D.R., L.P., R.R., R.F., R.D.-F., and G.G. designed the study, interpreted the data, and wrote the manuscript; S.R., V.S., A.B., C.C., and M.D.-B. performed the molecular analysis; S.M., C.D., and F.M.R. performed the FISH analysis; H.K., F.B., P.B., J.N., and V.G. interpreted the data; F.F., L.L., R.M., and G.D.P. provided well-characterized biologic samples and clinical data; and D.R. and R.S. performed the statistical analysis.
Conflict-of-interest disclosure: The authors declare no competing financial interests.
Correspondence: Davide Rossi, MD, PhD, Division of Hematology, Department of Translational Medicine, Amedeo Avogadro University of Eastern Piedmont, Via Solaroli 17, 28100 Novara, Italy; e-mail rossidav@med.unipmn.it.
References
Author notes
R.F, R.D.-F., and G.G. contributed equally to this work.

![Figure 4. Cumulative incidence of high-risk clonal evolution. Time to high-risk clonal evolution was defined as the time elapsed from diagnosis to the date of development of TP53 abnormalities, BIRC3 abnormalities, NOTCH1 mutations, SF3B1 mutations, or del1q22-q23 (events) or last follow-up or death (censoring). Analysis was performed using death as a competing risk. Only patients who did not present high-risk abnormalities at diagnosis were included in this analysis. (A-D) Cumulative incidence of clonal evolution according to age > 65 years (hazard ratio [HR] = 4.18; 95% CI, 1.26-13.8; 5-year risk: 17.1%, 10-year risk: 32.9%;), high LDH (HR = 3.15; 95% CI, 1.32-7.55; 5-year risk: 24.8%, 9-year risk: 62.8%), unmutated IGHV genes (HR = 2.89; 95% CI, 1.31-6.39; 5-year risk: 18.5%, 9-year risk: 50.8%), +12 or a normal genetics (HR = 2.29; 95% CI, 1.03-5.10; 5-year risk: 13.8%, 9-year risk: 34.5%).](https://ash.silverchair-cdn.com/ash/content_public/journal/blood/121/8/10.1182_blood-2012-09-458265/4/m_zh89991301980004.jpeg?Expires=1768197082&Signature=gWx130AUW6QrBtd3JyOHrakvNUf9UupAD~SAtWtuuZsqtGx5L68Jq3rjLm-nZV0oLIBDqtWhltjfUhR3KbxVYxU39CTXvn27CkwuzdFdc4nKWkgtc1feQoVMr~uNIjmkttiZmMmcLVCe~BVEUF~jERr0ITfEN4nvmpVcbUTIntSijOSksIklY5LUv5M4-1TfnCcfBRJvpyB15uClNYwadGrTXzO0mSUZXMObxBPb~gPMfHWJWW2v1drliCqKFvWA6ywWEmMV5wS4pzpailRLzYRziAqohlQ7uNoRgI5BabHIRIKu4ewMXRZi3h5COn6xuxzsOJHEVQxAGiAoZPsOCg__&Key-Pair-Id=APKAIE5G5CRDK6RD3PGA)


![Figure 4. Cumulative incidence of high-risk clonal evolution. Time to high-risk clonal evolution was defined as the time elapsed from diagnosis to the date of development of TP53 abnormalities, BIRC3 abnormalities, NOTCH1 mutations, SF3B1 mutations, or del1q22-q23 (events) or last follow-up or death (censoring). Analysis was performed using death as a competing risk. Only patients who did not present high-risk abnormalities at diagnosis were included in this analysis. (A-D) Cumulative incidence of clonal evolution according to age > 65 years (hazard ratio [HR] = 4.18; 95% CI, 1.26-13.8; 5-year risk: 17.1%, 10-year risk: 32.9%;), high LDH (HR = 3.15; 95% CI, 1.32-7.55; 5-year risk: 24.8%, 9-year risk: 62.8%), unmutated IGHV genes (HR = 2.89; 95% CI, 1.31-6.39; 5-year risk: 18.5%, 9-year risk: 50.8%), +12 or a normal genetics (HR = 2.29; 95% CI, 1.03-5.10; 5-year risk: 13.8%, 9-year risk: 34.5%).](https://ash.silverchair-cdn.com/ash/content_public/journal/blood/121/8/10.1182_blood-2012-09-458265/4/m_zh89991301980004.jpeg?Expires=1768550727&Signature=JKkDgAh8RZ3jySUtq4DcAWCwO2gPSxzxlXzvEVx8BqV399saEygkCxiPZCC0X48LVnF7szSsJeRPkgvYgh4ADOdKiIGcswRt-va-jNTJjSptYmOsq-59Rc1I0XBLRV4U-LDvujDOjCldc92TSPDxE1TGDEE-896wZRJsAzsKdg0r5-8ykbPelb3J68KFFclz3Sc2qfQPwK~YN2jIzWfMZ88Rb25vQ0NELIJU7bsCmdriHuN410nLYMveRRTPVa-347G~DDddP7NVs~060EkkDqBlfSqpca8wX~yC8~sqxDbODQ90yRUGMI3Osbyl5kqXmyRhl94Bz-mGW7vbPJWvPQ__&Key-Pair-Id=APKAIE5G5CRDK6RD3PGA)
