

Abstract
Ap3A is a platelet-dense granule component released into the extracellular space during the second wave of platelet aggregation on activation. Here, we identify an uncharacterized enzyme, nucleotide pyrophosphatase/phosphodiesterase-4 (NPP4), as a potent hydrolase of Ap3A capable of stimulating platelet aggregation and secretion. We demonstrate that NPP4 is present on the surface of vascular endothelium, where it hydrolyzes Ap3A into AMP and ADP, and Ap4A into AMP and ATP. Platelet aggregation assays with citrated platelet-rich plasma reveal that the primary and secondary waves of aggregation and dense granule release are strongly induced by nanomolar NPP4 in a concentration-dependent manner in the presence of Ap3A, while Ap3A alone initiates a primary wave of aggregation followed by rapid disaggregation. NPP2 and an active site NPP4 mutant, neither of which appreciably hydrolyzes Ap3A, have no effect on platelet aggregation and secretion. Finally, by using ADP receptor blockade we confirm that NPP4 mediates platelet aggregation via release of ADP from Ap3A and activation of ADP receptors. Collectively, these studies define the biologic and enzymatic basis for NPP4 and Ap3A activity in platelet aggregation in vitro and suggest that NPP4 promotes hemostasis in vivo by augmenting ADP-mediated platelet aggregation at the site of vascular injury.
Introduction
The formation of a platelet-rich thrombus stabilized by fibrin crosslinking is the final common pathway for arterial thrombosis, the most common disease process affecting adults in the United States. The first step in thrombus formation consists of platelet adhesion to the exposed subendothelial extracellular matrix at the site of vascular injury. Here, circulating blood platelets bind collagen via their GPVI receptors, and bind von Willebrand factor via GPIb, triggering inside-out activation of other surface integrins and the release of platelet granule contents into the extracellular space.1 The release of preformed molecules stored in platelet-dense granules such as ADP, serotonin, and ionized calcium, then amplifies the clotting reaction beyond the platelet monolayer bound on the collagen surface to circulating platelets in the immediate vicinity of the damaged endothelium. This amplification is further augmented by the secretion of thromboxane A2. ADP binding to purinergic receptors on the platelet surface (P2Y1 and P2Y12) induces rapid calcium influx and mobilization resulting in platelet shape change, activation, and partial degranulation thus promoting platelet aggregation. On granule release, local ADP concentrations are estimated to exceed 500μM, but ADP is quickly metabolized by ectoenzymes on the surface of endothelial cells (such as CD392,3 ) and soluble phosphohydrolyases in blood plasma which attenuate the prothrombotic response.4-7 To sustain the clotting reaction, a slow and steady source of ADP at the site of the growing thrombus is required. Another preformed chemical released by platelet-dense granules at high concentrations, diadenosine triphosphate (Ap3A), has an ill-defined role in thrombus formation but has been suggested to provide a source of long-lasting ADP at the site of vascular injury.
Ap3A is stored within platelet granules at high concentrations (∼20-30mM) and is released with ADP and ATP into the blood during thrombin-induced platelet aggregation at concentrations thought to range between 40 and 100μM8 (see supplemental Table 1 and additional references summarizing platelet-dense granule components and their concentrations before and after degranulation; available on the Blood Web site, see the Supplemental Materials link at the top of the online article). Turbidometric studies in citrated platelet-rich plasma (PRP) demonstrate that 10-20μM Ap3A induces weak platelet aggregation in a slow but persistent manner.9 The mechanism by which Ap3A promotes aggregation suggests that Ap3A is stored as a metabolically inactive or chemically masked molecule, which on release into the extracellular space is converted into a hemodynamically active form by an enzyme that liberates ADP from the dinucleotide. An enzyme capable of hydrolyzing Ap3A into AMP and ADP was partially characterized on the surface of intact porcine10 and bovine11 vascular endothelial cells more than 20 years ago. Before this, Luthje and Olgilvie linked weak Ap3A hydrolase activity in PRP to an extracellular glycoprotein, neither stored within nor released by platelets, with optimal enzymatic activity around pH 8.5 to 9.0, and a divalent cation dependence.12 The inability to further characterize and purify the enzyme impeded direct experimentation of the enzyme's effect on platelet activation and aggregation.
The human ectonucleotide pyrophosphatase/phosphodiesterase (ENPP or NPP) family consists of 7 extracellular, glycosylated proteins (NPP1-7) that hydrolyze phosphodiester bonds. NPPs are cell-surface enzymes, with the exception of NPP2, which is exported to the plasma membrane but cleaved by furin and released into the extracellular fluid.13 A subset of the family (NPP1-3) can recognize 5′ nucleotide-containing substrates and, approximately 10 years ago, was also reported to hydrolyze diadenosine polyphosphates, including Ap3A and Ap4A, into AMP and related products.14 In that study, the activity of NPP1 and NPP3 was measured by purifying membrane fractions of Chinese hamster ovary (CHO) cells stably transfected with the enzymes, while the soluble form of NPP2 was prepared from vaccinia virus lysate of BS-C-1 cells. The investigators reported that all NPPs tested hydrolyzed Ap3A with comparable rates and Michaelis constants (Km) in the low μM range.14
The effects of NPP enzymes on hemostasis and coagulation have never been directly demonstrated. In addition, the uncertainty regarding the precise role of NPPs in thrombosis has led to their inclusion alongside ADP-metabolizing enzymes (such as CD39) in some studies,15,16 giving the impression that their enzymatic activities are associated with antithrombotic effects resulting from ADP metabolism. While previous reports of enzymatic activity of NPP1-3 suggest that these enzyme isoforms are candidates for the intravascular hydrolysis of diadenosine polyphosphates, a review of the literature suggests that NPP2, NPP4, and NPP5 have the strongest evidence for an intravascular location.17 Homology modeling reveals the active sites of NPP4 and NPP1 to be quite similar, making NPP4 a prime candidate for Ap3A hydrolysis within blood vessels. Accordingly, NPP4 and NPP2 are reasonable starting points to investigate the role of the NPP family in hemostasis resulting from diadenosine polyphosphate metabolism. To define this role, we expressed and purified soluble, recombinant extracellular domains of human NPP2 and NPP4, characterized their enzymatic activities with substrates Ap3A and Ap4A (also released by dense granules), confirmed the intravascular location of NPP4 by immunofluorescence, and performed turbidometric analysis to directly determine the effects of NPPs on the aggregation of PRP. Our findings demonstrate that NPP4 is a prothrombotic intravascular enzyme stimulating platelet aggregation through the sustained hydrolysis of Ap3A into ADP at the site of the nascent thrombus.
Methods
Reagents
All reagents were the highest purity commercially available. Anti-NPP4 polyclonal antibody was obtained from Proteintech Group Inc. The DyLight 549 goat anti–rabbit fluorescent antibody was obtained from Vector Laboratories. Ap3A and Ap4A, p-nitrophenyl 5′-thymidine monophosphate (pNP-TMP), and the ADP receptor antagonists, MRS 2179 (P2Y1) and MRS 2395 (P2Y12) were obtained from Sigma-Aldrich. Substrates were freshly dissolved in assay buffers (absorbance assay: 50mM Tris pH 8.0, 140mM NaCl, 5mM KCl, 1mM MgCl2 and 1mM CaCl2; malachite green screening assay: 50mM Tris pH 8.0, 140mM NaCl, 5mM KCl, 1mM MgCl2 and 1mM CaCl2, 0.1mM ZnCl2; platelet aggregation assay: 50mM Tris pH 8.0, 140mM NaCl, 0.1mM MgCl2 and 0.1mM CaCl2, 0.1mM ZnCl2) immediately before use. MRS 2179 was dissolved in water and MRS 2395 was dissolved in DMSO. Both receptor antagonist solutions were stored at −20°C and thawed immediately before use in platelet aggregation assays.
Protein expression
The extracellular domains of human NPP4 (NCBI accession AAH18054.1, residues 1-407), NPP4-T70A (a threonine to alanine point mutation in residue 70), and full-length NPP2 (NCBI accession BC034961, residues 1-863) were cloned into a modified pFastbac HT vector possessing a TEV protease cleavage site followed by a C-terminus 9-HIS tag, and cloned and expressed in insect cells. Full-length NPP2 protein results in soluble, recombinant protein in the baculovirus cell-culture media secondary to cleavage of the extracellular domain by furin.13 Only the extracellular domain of NPP4 (residues 1-407) was cloned and expressed in identical conditions, resulting in soluble, recombinant protein. The proteins were purified with a Ni-NTA column followed by TEV cleavage of the His tag. The TEV protease also contained a His tag, allowing a second Ni-NTA column to remove the TEV and His fragment.18
Immunofluorescence
Histologically normal human brain tissue was obtained from autopsy and was fixed in formalin for 6 weeks and then paraffin embedded. Paraffin-embedded tissues were processed, sectioned, and stained with H&E by the Research Histology Laboratory at Yale University. For immunofluorescent staining, paraffin tissues were sectioned at 5μM, deparaffinized, rehydrated, and heat-induced epitope retrieval was performed in 1mM citrate buffer, pH = 6.0, for 20 minutes. Before staining, sections were washed with Tris-buffered saline (TBS) and blocked for 1 hour at room temperature (RT) with 1% BSA, 3% normal goat serum, and 0.3% Triton X-100 in PBS. Thin sections were incubated with rabbit anti-NPP4 (Proteintech Group Inc) for 1 hour at RT, followed by goat anti–rabbit IgG conjugated to Dylight-549 (Vector Laboratories) for 30 minutes. The resulting staining was directly compared with negative controls prepared identically except omitting the goat anti–rabbit anti-NPP4–conjugated antibody.
Enzymology
Substrate identification screening.
NPP4 nucleotide substrates were identified by directly detecting the free phosphate (Pi) product using malachite green (ADP substrate) or by a linked hydrolysis assay with alkaline phosphatase combined with malachite green (lipid substrates and nucleotide substrates without terminal Pi) to measure released Pi. A total of 50μM substrate Pi equivalents (eg, 25μM ADP) were treated with 50nM NPP4 for 1 hour 37 minutes (lipids) or 3 hours 15 minutes (all other substrates). For substrates without terminal phosphates, 10 U of calf intestinal alkaline phosphatase (M0290S, 10 000 units/mL; New England Biolabs) was added for a final reaction volume of 50 μL. One hundred microliters of malachite green (Biomol Green; Enzo Life Sciences) was added to quench the reactions. The amount of phosphate released was measured by absorbance at 620 nm by a Biotek Synergy Mx plate reader in 96-well plates (Corning) and compared against a phosphate standard curve. Reactions showing ≤ 6% phosphates released from the original substrate were considered to be inactive, while reactions showing 75% or more phosphates released from the original substrate were considered to be active. None of the reactions tested showed phosphate release between 6% and 75%.
Absorbance change assay for the steady-state Ap3A/Ap4A cleavage by NPP4.
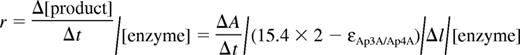
The kinetics of the steady-state Ap3A/Ap4A cleavage by NPP4 was measured from time courses of absorbance change at 259 nm using a UV spectrophotometer with a 0.1-cm optical path length cuvette or a stopped-flow device with a 0.2-cm optical path length cell. The enzymology reactions in 50mM Tris pH 8.0, 140mM NaCl, 5mM KCl, 1mM MgCl2, and 1mM CaCl2 were started by addition of 1μM NPP4 to varying concentrations of Ap3A/Ap4A (up to 800μM) solution (UV spectrophotometer) or by rapid mixing of NPP4 and Ap3A/Ap4A (stopped-flow). The substrate concentrations higher than 800μM have absorption too high to be measured by a UV spectrophotometer and stopped-flow, and were therefore measured by HPLC. HPLC assay indicates that the Ap3A hydrolysis products are AMP and ADP, while Ap4A hydrolysis products are AMP and ATP. Therefore, the rate of a product production or enzyme turnover measured by the absorption change assay can be calculated by the rate of absorption

ADP receptor inhibitor assay for NPP4 inhibition.
The activity of NPP4 in the presence of the ADP receptor inhibitors was determined from the cleavage rate of pNP-TMP (20mM) by NPP4 (5nM) and was measured at 405 nm in a UV spectrophotometer in the presence of 100μM of either of the 2 ADP receptor antagonists or their appropriate control solutions (water for MRS 2179 and 10% DMSO for MRS 2395). All experimental conditions were measured in triplicate. Time courses of absorbance change were fitted to a linear function and the rate of cleavage was obtained using a p-nitrophenylate molar extinction coefficient of 18.5mM−1 cm−1 as described.18
HPLC assay.
The HPLC protocol used to measure Ap3A/Ap4A cleavage by NPP4 and for product identification is modified from that of Stocchi et al.22 The reactions containing varying concentrations of Ap3A/Ap4A in the same buffer as in the absorbance change assay were started by addition of 0.2-1μM NPP4 and quenched at various time points by an equal volume of 3M formic acid, or 0.5 N KOH and reacidified by glacial acetic acid to pH 6. The quenched reaction solution was diluted systematically and loaded a HPLC system (Waters) and substrates and products were monitored by UV absorbance at 254 or 259 nm. Substrates and products were separated on a C18, 5 μm 250 × 4.6 mm HPLC column (Higgins Analytical), using 15mM ammonium acetate pH 6.0 solution, with a 0% to 10% (or 20%) methanol gradient. The products and substrate were quantified according to the integration of their correspondent peaks and the formula:

where [substrate]0 is the initial substrate concentration. The extinction coefficients of Ap3A, Ap4A, AMP, ADP, and ATP used in the formula were the same as those used in absorption change assay. If monitoring at 254 nm, substrate and product standards run on the same day as the reactions were used to convert integrated product/substrate peak areas to concentrations.
Preparation of human platelets for aggregometry
Whole blood from healthy voluntary donors was collected in accordance with an institutional review board–approved protocol into blue top vacutainer tubes containing 3.2% sodium citrate. Blood was centrifuged at 11.8g for 10 minutes at room temperature to collect PRP. PRP in the supernatant was then transferred to fresh tubes, and the remainder of the specimen was centrifuged at 1788.8g for 10 minutes to obtain platelet-poor plasma (PPP). PRP was adjusted to a final platelet count of 250 × 106 platelets/mL with autologous PPP for use in aggregation studies. Potential donors were excluded if there was a history of a bleeding disorder or current anticoagulant use and donors were instructed to avoid nonsteroidal anti-inflammatory agents (NSAIDs) for at least 7 days before donation. Approval for the human subjects involved in this research was sought and granted by the Committee for the Protection of Human Subjects, Dartmouth-Hitchcock Medical Center, where these studies were conducted in accordance with the Declaration of Helsinki.
Platelet aggregometry
Light transmission (ie, optical) and lumi aggregometry were performed on up to 4 samples from the same individual simultaneously with a Chrono-Log Model 700 Whole Blood/Optical Lumi Aggregometer (Chrono-Log Corporation) using procedures provided by the manufacturer that are briefly summarized here.
Light transmission aggregometry.
Platelet aggregation was determined by measuring the change in light transmittance of stirred PRP over time after addition of various agonists. Before each experiment, the aggregometer was standardized to reflect 100% and 0% light transmittance with PPP and PRP, respectively, from the donor whose platelets were used in each specific experiment. PRP (500 μL) was added to cuvettes containing a magnetic stir bar and allowed to prewarm to 37°C in the aggregometer wells for 3 minutes before initiating aggregation reactions which were then conducted at 37°C. Aggregation reactions were initiated by direct addition of agonists and/or enzymes to warmed, stirred PRP, and were monitored for an increase in light transmittance for 10 minutes. The increase in light transmittance is directly proportional to the amount of aggregation and is amplified and digitized into a computer (HP Compaq; Hewlett-Packard) with the AGGRO/LINK8 for Windows software (Chrono-Log Corporation) to generate aggregation curves. Aggregation curves originate from the top of the aggregation graphs and reflect the increase in the percentage of light transmittance (and hence aggregation) over time. The platelet aggregometry experiments for all concentrations of MRS 2395 (including the 0μM point) were conducted with the plasma adjusted to a final concentration of 10% DMSO to solubilize the inhibitor.
Lumi aggregometry.
In a subgroup of experiments, lumi aggregometry was used to assay the levels of extracellular ATP simultaneously with light transmission aggregometry (LTA). Lumi aggregometry measures ATP in the extracellular space over time using a sensitive luminescent assay using firefly luciferin-luciferase (CHRONO-LUME reagent; Chrono-Log Corporation). ATP binds to luciferin-luciferase and generates light that is then amplified by a high-gain photomultiplier tube in the lumi aggregometer and is measured simultaneously with the optical change in light transmittance caused by platelet aggregation. In experiments in which lumi aggregometry was performed, 450 μL of PRP was transferred to cuvettes containing magnetic stir bars and allowed to prewarm to 37°C in the aggregometer wells for 3 minutes. CHRONO-LUME reagent (50 μL) was added to each specimen and allowed to incubate for 2 additional minutes at 37°C. An ATP standard (Chrono-Log 387) is run for each individual test subject before adding agonists according to the instructions provided by the manufacturer. Reactions were initiated by the addition of agonists and/or enzymes to warmed PRP and CHRONO-LUME reagent and were monitored for light generation. Light generation with the luciferin-luciferase is proportional to the amount of extracellular ATP present. In cases where the ATP originates from platelet-dense granules, lumi aggregometry provides a method to assay the granule release reaction. Conversely, enzymatic reactions resulting in ATP can also be followed. Curves corresponding to light generation over time originate from the bottom of the aggregation graphs and reflect nM of ATP present in the extracellular space.
Results
NPP4 tissue localization by immunofluorescence
We hypothesize that NPP4 may represent the Ap3A hydrolase present on vascular endothelial cell surfaces described by various research groups.10,11 We therefore stained by immunofluorescence a highly vascular human organ (brain, which accepts ∼ 30% of cardiac output blood flow) for NPP4 (Figure 1). Immunofluorescence of NPP4 in brain reveals that NPP4 is enriched on blood vessel surfaces and localizes to vascular walls, as highlighted in numerous branched vessels in the brain parenchyma (Figure 1). Sections of brain immunostained with secondary antibody alone failed to highlight branched vascular tissue with red fluorescence (data not shown), confirming that polyclonal rabbit anti-NPP4 antibody was responsible for the localization of the red fluorescent probe to the vascular walls.

NPP4 is present on the vascular surfaces of human brain. To confirm the tissue localization of NPP4, we stained adult human brain with polyclonal rabbit anti-ENPP4 Ab (Proteintech Group), using Vector dylight 549 (red fluorescence Ab) to image. Strong staining was noted throughout the brain in all blood vessels, as demonstrated above in branched vessels, 2 examples of which are depicted in this figure. (Left column) Light contrast images of branched vessels. (Middle column) Red fluorescent channel of the identical field. (Right column) Overlay of DAPI channel (blue) with NPP4 protein (red). Note the strong highlighting of NPP4 in branched blood vessels and cross-sections of smaller vessels demonstrating NPP4 staining in the interior of the vessel.
NPP4 is present on the vascular surfaces of human brain. To confirm the tissue localization of NPP4, we stained adult human brain with polyclonal rabbit anti-ENPP4 Ab (Proteintech Group), using Vector dylight 549 (red fluorescence Ab) to image. Strong staining was noted throughout the brain in all blood vessels, as demonstrated above in branched vessels, 2 examples of which are depicted in this figure. (Left column) Light contrast images of branched vessels. (Middle column) Red fluorescent channel of the identical field. (Right column) Overlay of DAPI channel (blue) with NPP4 protein (red). Note the strong highlighting of NPP4 in branched blood vessels and cross-sections of smaller vessels demonstrating NPP4 staining in the interior of the vessel.
NPP4 hydrolysis of diadenosine polyphosphates
The extracellular domains of purified recombinant NPP4 and NPP2 were screened for substrate identification in enzyme assays using a linked assay in which alkaline phosphatase and either NPP4 or NPP2 were added to substrate, and free Pi was detected via malachite green. The linked assay detected cleavage of Ap3A and Ap4A substrates by NPP4, but not by NPP2. In contrast to previously published reports,14 we saw no evidence of diadenosine polyphosphate hydrolysis with NPP2, either in the linked assay screen, or using a real-time cleavage spectrophotometric assay (expanded on in “Discussion”).
To quantitate the steady-state kinetic parameters of NPP4, we measured time courses of Ap3A and Ap4A cleavage using 2 detection methods. The first is a chromatographic separation by HPLC over a C18 resin (Figure 2). The second is a spectrophotometric assay23 in which Ap3A hydrolysis is quantitated from changes in absorbance at 259 nm (Figure 3). Analysis of the reaction components at various time points by HPLC reveals a single cleavage site with both substrates, such that hydrolysis products are AMP and ADP with Ap3A substrate, and AMP and ATP with Ap4A substrate (Figure 2), consistent with a proposed mechanism of NPP cleavage based on alkaline phosphatase homology modeling.24 A mutant NPP4 in which the active site threonine, homologous to the catalytic threonine in NPP2, is replaced with alanine (NPP4-T70A) did not cleave diadenosine polyphosphates when assayed by either the linked assay, HPLC, or by absorbance, consistent with threonine 70 acting as the catalytic residue, and with previously published models of NPP catalytic mechanism.25,26

Identification of Ap3A cleavage products by HPLC. Elution profile of NPP4-Ap3A reaction components. (Top to bottom) Reaction samples quenched at 2, 15, and 30 minutes after mixing NPP4 with 800μM Ap3A. The AMP/ADP product ratio determined from the integrated peak areas is ∼ 1.1 always.
Identification of Ap3A cleavage products by HPLC. Elution profile of NPP4-Ap3A reaction components. (Top to bottom) Reaction samples quenched at 2, 15, and 30 minutes after mixing NPP4 with 800μM Ap3A. The AMP/ADP product ratio determined from the integrated peak areas is ∼ 1.1 always.
![Figure 3. Steady-state Ap3A cleavage by NPP4. (A) Time courses of Ap3A cleavage monitored by absorbance at 259 nm after mixing 200nM NPP4 with (bottom to top) 2, 44, 125, and 250μM Ap3A. (B) [AP3A]–dependent steady-state AP3A cleavage rate by NPP4 (200nM). The solid line through the data represents the best fit to a rectangular hyperbola.](/view-large/figure/7310814/zh89991299090003.jpeg)
Steady-state Ap3A cleavage by NPP4. (A) Time courses of Ap3A cleavage monitored by absorbance at 259 nm after mixing 200nM NPP4 with (bottom to top) 2, 44, 125, and 250μM Ap3A. (B) [AP3A]–dependent steady-state AP3A cleavage rate by NPP4 (200nM). The solid line through the data represents the best fit to a rectangular hyperbola.
Steady-state Ap3A cleavage by NPP4. (A) Time courses of Ap3A cleavage monitored by absorbance at 259 nm after mixing 200nM NPP4 with (bottom to top) 2, 44, 125, and 250μM Ap3A. (B) [AP3A]–dependent steady-state AP3A cleavage rate by NPP4 (200nM). The solid line through the data represents the best fit to a rectangular hyperbola.
Time courses of product formation are linear over short-time scales and yield substrate Michaelis constant (KM) values of ∼ 800μM for Ap3A (Figure 3B) and ∼ 200μM for Ap4A (Table 1). The maximum catalytic turnover rate (kcat) values are ∼ 4 seconds−1 for Ap3A (Figure 3B) and ∼ 1 second−1 for Ap4A (Table 1). Time courses of product formation display deviations from linearity over long-time scales because of substrate depletion, and possibly, product inhibition.27
Physiologic role of NPP4 in platelet aggregation
To determine the physiologic response of NPP4 catalytic activity, we measured platelet aggregation in PRP by LTA. Exposure of platelets to exogenous Ap3A alone at concentrations up to 160μM triggers a primary wave of aggregation without degranulation, followed by rapid disaggregation (Figure 4A). In the presence of 100nM NPP4, Ap3A induces both the primary and secondary waves of aggregation in a concentration-dependent fashion, with 70% maximum aggregation obtained with just 40μM Ap3A and with greater than 80% maximum aggregation obtained at Ap3A concentrations of 80μM or higher (Figure 4B). Platelet aggregation likewise demonstrated a concentration-dependent response to NPP4 at 80μM Ap3A, with 80% maximum aggregation occurring at 100nM NPP4 and 90% occurring at 200nM NPP4 (Figure 4C-D). Importantly, an inactive T70A mutant of NPP4, incapable of Ap3A hydrolysis, shows no effect on platelet aggregation in the presence of 80μM Ap3A (Figure 4D green tracing), establishing that the aggregatory effects of NPP4 are linked to the catalytic activity of the enzyme. Combined with the concentration-dependent response of Ap3A, these data strongly indicate that the proaggregatory effect of NPP4 is linked to ADP generation via Ap3A hydrolysis.

NPP4 promotes platelet aggregation in the presence of AP3A. Light transmission aggregometry was used to assess aggregation in response to agonists in platelet-rich plasma. Data are shown graphically as a percentage of light transmittance (y-axis) over time (x-axis). (A) Increasing concentrations of Ap3A demonstrate only a primary wave of aggregation followed by rapid platelet disaggregation. (B) Dose-dependent response of Ap3A in the presence of 100nM NPP4 demonstrates that low micromolar amounts of Ap3A are sufficient to induce robust platelet aggregation. (C-D) Dose dependence of NPP4 in the presence of 80μM Ap3A. Both the primary and secondary waves of platelet aggregation are dependent on NPP4 concentration, without evidence for disaggregation over the 10-minute time course of the experiments. In the absence of NPP4, 80μM AP3A elicits only a primary wave of aggregation followed by rapid disaggregation (blue curves, C-D). An inactive mutant form of NPP4 in which the catalytic threonine has been mutated to an alanine (T70A, green curve in panel D) fails to induce aggregation at the 100nM concentration.
NPP4 promotes platelet aggregation in the presence of AP3A. Light transmission aggregometry was used to assess aggregation in response to agonists in platelet-rich plasma. Data are shown graphically as a percentage of light transmittance (y-axis) over time (x-axis). (A) Increasing concentrations of Ap3A demonstrate only a primary wave of aggregation followed by rapid platelet disaggregation. (B) Dose-dependent response of Ap3A in the presence of 100nM NPP4 demonstrates that low micromolar amounts of Ap3A are sufficient to induce robust platelet aggregation. (C-D) Dose dependence of NPP4 in the presence of 80μM Ap3A. Both the primary and secondary waves of platelet aggregation are dependent on NPP4 concentration, without evidence for disaggregation over the 10-minute time course of the experiments. In the absence of NPP4, 80μM AP3A elicits only a primary wave of aggregation followed by rapid disaggregation (blue curves, C-D). An inactive mutant form of NPP4 in which the catalytic threonine has been mutated to an alanine (T70A, green curve in panel D) fails to induce aggregation at the 100nM concentration.
To confirm that the observed effect of NPP4 on platelet aggregation was because of generation of ADP by hydrolysis of Ap3A, we conducted experiments in the presence of ADP receptor blockade (Figure 5). The inclusion of the P2Y1 receptor antagonist, MRS 2179 with 50nM NPP4 and 80μM Ap3A showed concentration-dependent inhibition of platelet aggregation with MRS 2179 at concentrations ranging from 0 to 100μM (Figure 5A). Similarly, the P2Y12 receptor antagonist, MRS 2395 showed concentration-dependent inhibition of platelet aggregation with complete inhibition occurring at a final concentration of 200μM (Figure 5B green tracing). Neither ADP receptor antagonist demonstrated any significant inhibition of NPP4-mediated enzymatic activity in the colorimetric hydrolysis assay against the synthetic substrate pNP-TMP at concentrations an order of magnitude greater than those measured in the aggregation experiment (Figure 5C). Accordingly, the results of these experiments support our hypothesis that NPP4 mediates its effect on platelet aggregation via hydrolysis of Ap3A to ADP.

ADP receptor blockade inhibits NPP4/Ap3A-promoted platelet aggregation. The platelet ADP receptors, P2Y1 and P2Y12, were blocked using specific receptor antagonists (MRS 2179 and MRS 2395, respectively) in light transmission aggregometry experiments conducted in the presence of 50nM NPP4 and 80μM Ap3A. (A) Increasing concentrations of the P2Y1 receptor antagonist, MRS 2179, showed a dose-dependent inhibition of the platelet aggregation response in the presence of NPP4 and Ap3A. (B) Increasing concen-trations of the P2Y12 receptor antagonist, MRS 2395, showed a dose-dependent inhibition of the platelet aggregation response in the presence of NPP4 and Ap3A with complete inhibition by 200μM MRS 2395 (green curve). All experiments in this panel were conducted in the presence of 10% DMSO to ensure the solubility of MRS 2395. (C) ADP receptor inhibitors do not appreciably (≤ 4%) inhibit NPP4 enzymatic activity when added at 200-fold molar excess over NPP4 (100μM inhibitor to 5nM NPP4). All errors in measurement are less than 1% of the stated value.
ADP receptor blockade inhibits NPP4/Ap3A-promoted platelet aggregation. The platelet ADP receptors, P2Y1 and P2Y12, were blocked using specific receptor antagonists (MRS 2179 and MRS 2395, respectively) in light transmission aggregometry experiments conducted in the presence of 50nM NPP4 and 80μM Ap3A. (A) Increasing concentrations of the P2Y1 receptor antagonist, MRS 2179, showed a dose-dependent inhibition of the platelet aggregation response in the presence of NPP4 and Ap3A. (B) Increasing concen-trations of the P2Y12 receptor antagonist, MRS 2395, showed a dose-dependent inhibition of the platelet aggregation response in the presence of NPP4 and Ap3A with complete inhibition by 200μM MRS 2395 (green curve). All experiments in this panel were conducted in the presence of 10% DMSO to ensure the solubility of MRS 2395. (C) ADP receptor inhibitors do not appreciably (≤ 4%) inhibit NPP4 enzymatic activity when added at 200-fold molar excess over NPP4 (100μM inhibitor to 5nM NPP4). All errors in measurement are less than 1% of the stated value.
To test the effects of Ap4A hydrolysis by NPP4 on platelet aggregation, we measured the platelet aggregation induced by various concentrations of Ap4A and NPP4 by LTA. Ap4A at 80μM, either alone or in the presence of 100nM NPP4, has no apparent positive effect on aggregation (Figure 6A black and green tracings) in marked contrast to NPP4 in the presence of 80μM Ap3A (Figure 6A red tracing). However, Ap4A in the presence of Ap3A blunts the proaggregatory effects of Ap3A and NPP4 on platelet aggregation. As seen in Figure 6B, platelet aggregation in the presence of 100nM NPP4 and both 80μM Ap3A and 80μM Ap4A (Figure 6B green tracing) is roughly half of the aggregation induced by 100nM NPP4 and 80μM Ap3A without Ap4A present (Figure 6B black tracing). These findings are consistent with previous published studies demonstrating that Ap4A inhibits the effects of ADP on platelet aggregation via antagonism of P2Y1 and P2Y12 receptors,28 and further support the idea that NPP4 induces aggregation via the generation of ADP from Ap3A hydrolysis. In addition, Ap4A competes with Ap3A for the NPP4 active site.

Ap4A and NPP2 fail to elicit platelet aggregation. (A) Light transmission aggregometry demonstrates the lack of effect of Ap4A alone or in conjunction with NPP4 on triggering platelet aggregation. Ap3A (80μM) in the absence of NPP4 (blue curve) triggers a primary wave of aggregation, which is followed by rapid disaggregation, while in the presence of 100nM NPP4 (red curve) strong primary and secondary aggregation waves are observed. Conversely, 80μM Ap4A either in the presence (green curve) or absence (black curve) of 100nM NPP4 does not trigger even a primary wave of aggregation. (B) Ap4A has an inhibitory effect on Ap3A-induced platelet aggregation in the presence of NPP4. NPP4 (100nM) alone (blue curve) or in the presence of 80μM Ap4A (red curve) does not trigger platelet aggregation, while 100nM NPP4 in the presence of 80μM Ap3A triggers platelet aggregation (black curve). Addition of 80μM Ap4A to 100nM NPP4 and 80μM Ap3A results in an intermediate degree of platelet aggregation compared with 100nM NPP4 and 80μM Ap3A alone, suggesting that Ap4A may compete with Ap3A for the active site of NPP4. Ap4A and its product ATP are also known to inhibit the P2Y12 receptor. (C) NPP2 has no effect on platelet aggregation in the presence of Ap3A. Ap3A (80μM) in the absence of NPP2 (blue curve) triggers a primary wave of aggregation, which is followed by rapid disaggregation. Nearly identical responses are observed with the addition of 100nM (black curve) and 200nM (red curve) NPP2, suggesting that NPP2 lacks the ability to hydrolyze Ap3A to form ADP. Strong platelet aggregation is observed in the presence of 80μM Ap3A and 50nM NPP4 (green curve). (D) Light transmission and lumi aggregometry performed simultaneously demonstrate strong platelet aggregation and dense granule release, respectively, when platelets are exposed to 100nM NPP4 and 40μM Ap3A. LTA curves are shown originating from the top. The corresponding lumi aggregometry curves, generated by bioluminescent determination of ATP, which reacts with firefly luciferin and luciferase, are shown on the bottom. Addition of 40μM Ap3A alone (blue curves) to PRP results in a primary wave of aggregation, followed by rapid disaggregation and a corresponding lumi aggregometry curve that has an initial small spike at mixing followed by steady decay. A similar pattern is observed when 100nM inactive T70A mutant of NPP4 is mixed with 40μM Ap3A (red-orange lines). In contrast, mixing 100nM NPP4 with 40μM Ap3A (black lines) results in the enzymatic production of ADP causing a primary wave of platelet aggregation to occur, leading to granule release after ∼1.5 minutes, detected as a strong surge of luminescence corresponding to the ATP liberated from the dense granules. The secondary wave results in a stable aggregate. Mixing 100nM NPP4 with 40μM Ap4A (green lines) looks quite different. Because no ADP is produced, there is no platelet aggregation and no granule release. Instead, the luminescence detects the slow and steady enzymatic production of ATP from the moment of mixing.
Ap4A and NPP2 fail to elicit platelet aggregation. (A) Light transmission aggregometry demonstrates the lack of effect of Ap4A alone or in conjunction with NPP4 on triggering platelet aggregation. Ap3A (80μM) in the absence of NPP4 (blue curve) triggers a primary wave of aggregation, which is followed by rapid disaggregation, while in the presence of 100nM NPP4 (red curve) strong primary and secondary aggregation waves are observed. Conversely, 80μM Ap4A either in the presence (green curve) or absence (black curve) of 100nM NPP4 does not trigger even a primary wave of aggregation. (B) Ap4A has an inhibitory effect on Ap3A-induced platelet aggregation in the presence of NPP4. NPP4 (100nM) alone (blue curve) or in the presence of 80μM Ap4A (red curve) does not trigger platelet aggregation, while 100nM NPP4 in the presence of 80μM Ap3A triggers platelet aggregation (black curve). Addition of 80μM Ap4A to 100nM NPP4 and 80μM Ap3A results in an intermediate degree of platelet aggregation compared with 100nM NPP4 and 80μM Ap3A alone, suggesting that Ap4A may compete with Ap3A for the active site of NPP4. Ap4A and its product ATP are also known to inhibit the P2Y12 receptor. (C) NPP2 has no effect on platelet aggregation in the presence of Ap3A. Ap3A (80μM) in the absence of NPP2 (blue curve) triggers a primary wave of aggregation, which is followed by rapid disaggregation. Nearly identical responses are observed with the addition of 100nM (black curve) and 200nM (red curve) NPP2, suggesting that NPP2 lacks the ability to hydrolyze Ap3A to form ADP. Strong platelet aggregation is observed in the presence of 80μM Ap3A and 50nM NPP4 (green curve). (D) Light transmission and lumi aggregometry performed simultaneously demonstrate strong platelet aggregation and dense granule release, respectively, when platelets are exposed to 100nM NPP4 and 40μM Ap3A. LTA curves are shown originating from the top. The corresponding lumi aggregometry curves, generated by bioluminescent determination of ATP, which reacts with firefly luciferin and luciferase, are shown on the bottom. Addition of 40μM Ap3A alone (blue curves) to PRP results in a primary wave of aggregation, followed by rapid disaggregation and a corresponding lumi aggregometry curve that has an initial small spike at mixing followed by steady decay. A similar pattern is observed when 100nM inactive T70A mutant of NPP4 is mixed with 40μM Ap3A (red-orange lines). In contrast, mixing 100nM NPP4 with 40μM Ap3A (black lines) results in the enzymatic production of ADP causing a primary wave of platelet aggregation to occur, leading to granule release after ∼1.5 minutes, detected as a strong surge of luminescence corresponding to the ATP liberated from the dense granules. The secondary wave results in a stable aggregate. Mixing 100nM NPP4 with 40μM Ap4A (green lines) looks quite different. Because no ADP is produced, there is no platelet aggregation and no granule release. Instead, the luminescence detects the slow and steady enzymatic production of ATP from the moment of mixing.
We next confirmed that NPP2, which had no measurable effect on Ap3A hydrolysis in our enzymatic studies (data not shown), also had no effect on platelet aggregation. In the presence of 80μM Ap3A, NPP2 at concentrations up to 200nM had no measureable effects on platelet aggregation, in marked contrast to NPP4 (Figure 6C). To directly link the physiologic effects of Ap3A hydrolysis by NPP4 to platelet degranulation, we performed lumi aggregometry to follow platelet aggregation and dense granule release simultaneously with LTA as described in “Lumi aggregometry.” ATP release and platelet aggregation were simultaneously seen only in samples containing both NPP4 and Ap3A (Figure 6D black tracings), where the sharp sigmoidal increase in luminescence indicates a sudden burst of ATP in the extracellular compartment via platelet degranulation. NPP4 hydrolysis of Ap3A yields AMP and ADP, not ATP. In marked contrast, samples containing NPP4 and Ap4A (Figure 6D green tracings) exhibit no measurable platelet aggregation, and only a gradual parabolic rise of luminescence, indicating that the dense granule contents are not released, and that the observed rise results instead from NPP4 hydrolysis of Ap4A to AMP and ATP. These studies establish that Ap3A hydrolysis by NPP4 induces platelet degranulation and the second wave of platelet activation, resulting in irreversible platelet aggregation characteristic of thrombus formation (Figure 7).

Proposed model of the role of NPP4 in primary hemostasis. In the setting of vascular injury, for example, because of fracture of a cholesterol plaque, platelets are localized to the site of injury. Binding of platelets to subendothelial collagen leads to platelet shape change, activation, and granule release with secretion of calcium ions, ADP, and Ap3A into the local area. ADP is metabolized by ectoenzymes (CD39) on the vascular endothelial surface and soluble phosphohydrolyases (blue Pac-Man), reducing the concentrations of ADP in the thrombotic microenvironment. NPP4 bound on the surface of endothelial cells metabolizes Ap3A released by platelets during the second wave of aggregation into ADP, thus increasing the concentration of ADP at the site of the injury. The prolonged release of low-level ADP perpetuates platelet activation and aggregation, resulting in formation of a platelet plug on which secondary hemostasis reactions occur to form a solid thrombus.
Proposed model of the role of NPP4 in primary hemostasis. In the setting of vascular injury, for example, because of fracture of a cholesterol plaque, platelets are localized to the site of injury. Binding of platelets to subendothelial collagen leads to platelet shape change, activation, and granule release with secretion of calcium ions, ADP, and Ap3A into the local area. ADP is metabolized by ectoenzymes (CD39) on the vascular endothelial surface and soluble phosphohydrolyases (blue Pac-Man), reducing the concentrations of ADP in the thrombotic microenvironment. NPP4 bound on the surface of endothelial cells metabolizes Ap3A released by platelets during the second wave of aggregation into ADP, thus increasing the concentration of ADP at the site of the injury. The prolonged release of low-level ADP perpetuates platelet activation and aggregation, resulting in formation of a platelet plug on which secondary hemostasis reactions occur to form a solid thrombus.
Discussion
Here, we demonstrate that NPP4, a previously uncharacterized member of the ectonucleotide pyrophosphatase/phosphodiesterase family, is localized on the vascular walls of blood vessels within the brain and activates platelet degranulation and aggregation at nM concentrations through the liberation of ADP from Ap3A. Ap3A is a chemical stored in abundance in platelet-dense granules that achieves ≈ 100μM extracellular concentrations in the vicinity of platelet activation on platelet degranulation. Our identification of NPP4 as a slow hydrolyzing Ap3A enzyme comes many years after the presence of such an entity in the circulatory system was first hypothesized by Luthje and Olgilvie.9 The researchers subsequently detected an enzyme with Ap3A and Ap4A hydrolytic activity on the surface of bovine vascular endothelium11 contemporaneously with a second group who discovered an Ap3A hydrolase on porcine vascular endothelium.10 Our search of the NCBI-GEO database also revealed NPP4 gene expression in a variety of human vascular endothelial cells.
Diadenosine polyphosphates have been identified as potential substrates for the NPP family of enzymes.14 A collaborative group of researchers partially purified membrane fractions of CHO cells stably transfected with NPP1, NPP2, or NPP3 to probe their activity with Ap3A, and all were observed to hydrolyze Ap3A with Kms in the low μM range. Our studies investigated NPP family members suggested by the literature to be present in vascular cells17,29 —NPP2 and NPP4—and used a baculovirus expression system to produce soluble, easily purified proteins. In contrast to previous reports, we have seen no evidence that NPP2 is capable of hydrolyzing Ap3A either by steady state enzymatic studies (data not shown) or biologic assays with PRP (Figure 5C). In addition, our Michaelis constant of NPP4 binding to Ap3A is much weaker than previously reported for NPP1 and NPP3, 800μM compared with 5-50μM. Some of the discrepancies may be attributable to differences in protein purity between recombinant soluble enzymes and CHO cell membrane preparations, different solution conditions, or the rapid enzymatic removal of NPP4 reaction products on cellular surfaces reducing the effects of product inhibition. However, the differences in the Km's between NPP4 and NPP1/NPP3 may reflect true intrinsic differences in the affinity of NPP family members for dinucleotide polyphosphate substrates. Our results indicate that NPP4 is an intravascular enzyme with a physiologic role in hemostasis while NPP2 has no discernable role in platelet aggregation or Ap3A metabolism. In light of our findings, we believe that despite high-sequence homologies with NPP4, additional experiments are necessary before implicating NPP1 and NPP3 in hemostasis and Ap3A metabolism.
The hydrolysis of Ap3A in the blood has been noted to occur slowly relative to that of ADP.10,11,30,31 ADP released during platelet degranulation stimulates further platelet aggregation and release, and thus the process is autocatalytic. To prevent unregulated thrombus formation, ADP is rapidly degraded—1μM ADP is degraded in whole blood within 3.2 minutes, and may be even faster in vivo because of ectoenzymes present on cell surfaces.6,31 The degradation of diadenosine polyphosphates by bovine endothelium is noted to be at least an order of magnitude slower than the degradation of ADP, and because of product inhibition of the Ap3A hydrolase, the effect is expected to be even more pronounced at high nucleotide concentrations.11 In light of the kinetics of NPP4 hydrolysis, Ap3A would provide a sustained source of low-level ADP in the microenvironment of platelet degranulation, which would extend the half-life of platelet activation and thereby promote thrombus formation. It is noteworthy that just ≈ 2μM ADP will trigger platelet aggregation and granule release.
Our observation that NPP4 augments the platelet aggregation response to Ap3A suggests that generation of ADP via hydrolysis of Ap3A is the mechanism by which this occurs. In addition, we demonstrate that NPP4/Ap3A-induced platelet aggregation is markedly inhibited by inclusion of an ADP receptor blockade (Figure 5A-B), providing further evidence for an ADP-dependent mechanism. Importantly, we show that these ADP-receptor inhibitors do not significantly impact NPP4 activity (Figure 5C).
ADP stimulates platelet shape change, aggregation, and secretion via activation of platelet surface receptors P2Y1 and P2Y12 that are coupled to intracellular G proteins through which their signals are mediated. P2Y1 couples to Gq and mediates influx of Ca2+, platelet shape change and transient aggregation, while P2Y12 receptors couple to Gi family members and mediate inhibition of adenyl cyclase activity and augmentation of platelet aggregation. Optimal platelet aggregation requires activation of both ADP receptors (reviewed in Offermanns,32 Gachet,33 and Kahner et al34 ). One consequence of exposure to ADP is the release of arachidonic acid (AA) from platelet membrane phospholipids. AA is subsequently converted to TXA2 via a pathway involving cyclooxygenase-1 (COX-1) and requiring the activation of both ADP receptors.35 This pathway is inhibited by aspirin, an effective antiplatelet agent, especially in the setting of cardiovascular disease. Our studies herein demonstrate that NPP4 augments ADP-mediated pathways of platelet aggregation, raising the possibility that NPP4 may be able to overcome some of the effects of COX-1 inhibition of platelet aggregation. We are pursing aggregometry studies on platelets from patients treated with aspirin in the presence and absence of NPP4 to test this hypothesis.
Our findings may have relevant clinical implications for both improving hemostasis and inhibiting thrombosis. First, NPP4 may represent a novel target for antithrombotic therapy as an adjunct to antiplatelet agents. Second, NPP4 enzyme replacement therapy to augment prolonged low-level ADP production and platelet aggregation at the site of vascular injury might provide an alternative to platelet transfusions in bleeding patients with qualitative platelet dysfunction (eg, because of NSAIDs or congenital storage pool disorders) by improving platelet function. Finally, the demonstration that NPP4 is a vascular endothelial cell ectoenzyme with proaggregatory effects invites the hypothesis that mutant forms or deficiencies of the enzyme may exist that could be responsible for a mild bleeding diathesis in individuals with mucosal platelet-type bleeding manifestations for which no platelet or von Willebrand factor abnormalities can be identified. Although speculative, it will be of interest to determine whether individuals with such disorders carry mutations in the gene encoding NPP4 or produce NPP4 that becomes detached from the membrane. If so, techniques to assay for these possibilities could potentially be exploited for clinical laboratory test development.
The online version of this article contains a data supplement.
The publication costs of this article were defrayed in part by page charge payment. Therefore, and solely to indicate this fact, this article is hereby marked “advertisement” in accordance with 18 USC section 1734.
Acknowledgments
The authors are indebted to Dr Joe Madri for help with the tissue localization of NPP4 and useful discussions, and to Dr Jon Morrow for his enthusiastic support and encouragement throughout the course of this investigation.
Authorship
Contribution: R.A.A., D.L.O., E.M.D.L.C., and D.T.B. designed research; R.A.A., W.C.C., D.R., W.C., L.L., and M.E.R. performed research; R.A.A., W.C.C., D.L.O., W.C., L.L., E.M.D.L.C., and D.T.B. analyzed data; and R.A.A., D.L.O., E.M.D.L.C., and D.T.B. wrote the manuscript.
Conflict-of-interest disclosure: The authors declare no competing financial interests.
Correspondence: Demetrios T. Braddock, Department of Pathology, Yale University School of Medicine, 310 Cedar St, New Haven, CT 06510; e-mail: demetrios.braddock@yale.edu.

