Abstract
The immunodeficiency disorder Wiskott-Aldrich syndrome (WAS) leads to life-threatening hematopoietic cell dysfunction. We used WAS protein (WASp)–deficient mice to analyze the in vivo efficacy of lentiviral (LV) vectors using either a viral-derived promoter, MND, or the human proximal WAS promoter (WS1.6) for human WASp expression. Transplantation of stem cells transduced with MND-huWASp LV resulted in sustained, endogenous levels of WASp in all hematopoietic lineages, progressive selection for WASp+ T, natural killer T and B cells, rescue of T-cell proliferation and cytokine production, and substantial restoration of marginal zone (MZ) B cells. In contrast, WS1.6-huWASp LV recipients exhibited subendogenous WASp expression in all cell types with only partial selection of WASp+ T cells and limited correction in MZ B-cell numbers. In parallel, WS1.6-huWASp LV recipients exhibited an altered B-cell compartment, including higher numbers of λ-light-chain+ naive B cells, development of self-reactive CD11c+FAS+ B cells, and evidence for spontaneous germinal center (GC) responses. These observations correlated with B-cell hyperactivity and increased titers of immunoglobulin (Ig)G2c autoantibodies, suggesting that partial gene correction may predispose toward autoimmunity. Our findings identify the advantages and disadvantages associated with each vector and suggest further clinical development of the MND-huWASp LV for a future clinical trial for WAS.
Introduction
Viral vector-based gene therapy has shown significant benefit in preclinical and clinical trials for the treatment of immune disorders.1-3 Wiskott-Aldrich syndrome (WAS) is a primary immunodeficiency disorder characterized by defective immune development, thrombocytopenia, eczema, autoimmunity, and increased incidence of cancer.4 In the absence of bone marrow (BM) transplantation, WAS patients usually succumb to disease-related complications within the first 2 decades of life.4 This monogenic disease stems from mutations of the Wiskott-Aldrich syndrome (WAS) gene. The success of BM transplantation combined with strong in vivo selective advantage of WASp+ cells identified WAS as a key candidate gene therapy target.4 However, although successful, the initial retroviral-based gene therapy trial of WAS also exhibited the development of leukemia in 2 patients.5,6 Thus, despite this important advance and information derived from multiple preclinical studies,7-10 it remains unclear which vector design will provide the greatest likelihood for safe and effective gene replacement therapy in this complex disorder.
Successful treatment of WAS is complicated by a unique set of challenges, including broad expression pattern11 and high risk of transplant-related autoimmunity.12-14 WASp is expressed in all hematopoietic lineages and WASp-deficient cells exhibit a broad array of functional defects.11 Accordingly, full correction of WAS requires the restoration of WASp expression in nearly all hematopoietic lineages. Previous studies demonstrated a strong selective advantage for WASp+ cells in both mouse1,15-18 and human15,19,20 cells. These observations imply that transduction of a limited number of hematopoietic stem cells (HSCs) should result in progressive outgrowth of WASp+ cells in multiple lineages. However, because most studies examined selective advantage with cells expressing wild-type (WT) levels of WASp, it remains uncertain whether a subendogenous level of protein will also result in an equivalent rate of selection in various affected lineages.
With the advent of self-inactivating (SIN) lentiviral (LV) vectors, attaining sufficient transgene expression depends primarily on the choice of the internal promoter. A weak promoter may result in insufficient protein expression and limited functional rescue, whereas a strong promoter may lead to overexpression and/or increased risk of toxicity or insertional mutagenesis.21 Several previous reports used LV vectors and various promoters to correct functional defects in WASp-deficient mice, with various degrees of success. One approach used the proximal WAS promoter (WS1.6)22 to drive WASp expression in WASp-deficient murine stem cells, resulting in detectable WASp expression in T cells and partial functional rescue of T cells and myeloid cells.1,7,8,23-25 Alternatively, Blundell and colleagues used the elongation factor 1a (EF1α) promoter to correct the B-cell migration defect and partially restore B-cell development in WASp-deficient mice.26 However, each approach analyzed only a subset of hematologic defects and no single vector was previously shown to correct all affected lineages in vivo.
We used WASp-deficient mice to directly compare 2 key candidate viral vectors for clinical treatment of WAS. Specifically, we used SIN-LV vectors containing either a gammaretrovirus-derived promoter (MPSV LTR, NCR deleted, and d/587 PBS; MND)27 or the human proximal WASp endogenous promoter (WS1.6). The MND promoter is highly and constitutively active in the hematopoietic system and has been engineered to resist transcriptional silencing.27,28 It has recently been used in a successful gene therapy clinical trial for adrenoleukodystrophy.29 The WS1.6 LV is currently being used for the first LV gene therapy trial for WAS.30 We evaluated the relative effectiveness and utility of these elements for correction of WAS-associated hematologic defects in vivo. Our findings indicate that the WS1.6 promoter is less effective in rescuing WASp-dependent defects in vivo and, further, that use of this vector may potentially lead to aggravated autoimmune manifestations. In contrast, we show substantial correction of the WAS phenotype using the MND promoter, suggesting further exploration of the MND promoter for transition into clinical trials.
Methods
Mice
Mouse colonies for CD45.1+ (C57/SJL), CD45.2+ (C57/Bl6), WASp−/−,31 and NOD-severe combined immunodeficiency (SCID)–common γ chain deficient (NSG)32 mice were maintained in the SPF facility of the Seattle Children's Research Institute mouse colony. All studies were performed according to the guidelines of the Seattle Children's Research Institute Animal Care and Use Committee.
Tissue isolation
Isolation, transduction, and transplantation of human CD34+ cells33 and murine lineage negative (Linneg)34 cells was performed as previously described. For murine stem cell transplantation, we used a split-dose conditioning dose to deliver a total of 9 Gy irradiation over a 24-hour period unless noted otherwise. The first dose (4.5 Gy) was given 12 to 24 hours before transplant and second dose (4.5 Gy) was given immediately before transplantation.
For tissue analysis, animals were killed using CO2 inhalation, and then the thymus, BM, and spleen were extracted using standard surgical procedures. Single-cell suspensions of thymus and spleen were obtained by dissociating tissues with frosted glass slides. For BM isolation, femurs and tibias were flushed out using a 25-G needle and broken into a single-cell suspension with a 22-G needle. Erythrocytes were lysed with ammonium chloride potassium phosphate (ACK) buffer. The cells were filtered through a 40 μm mesh and used for phenotypic and functional assays.
Cloning and viral production
The MND promoter35 and the WS1.6 promoter22,36 were previously described. LV vectors were produced as previously described.34
Additional methodology is detailed in supplemental Methods (available on the Blood Web site; see the Supplemental Materials link at the top of the online article).
Results
MND-huWASp LV transduced cells outcompete WS1.6-huWAS LV transduced cells in vivo
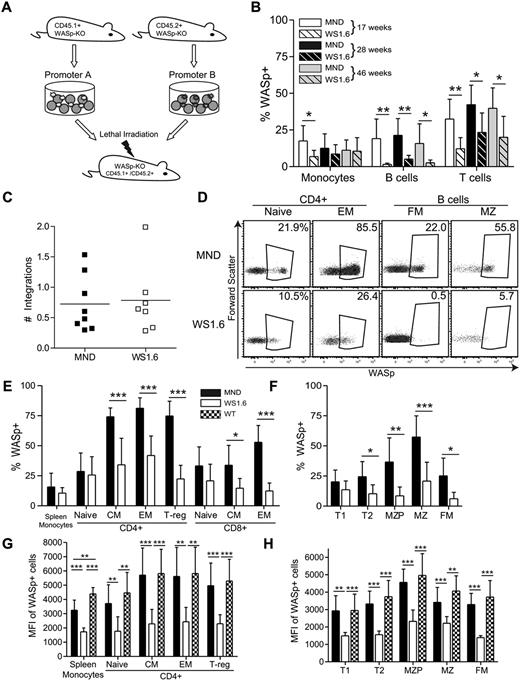
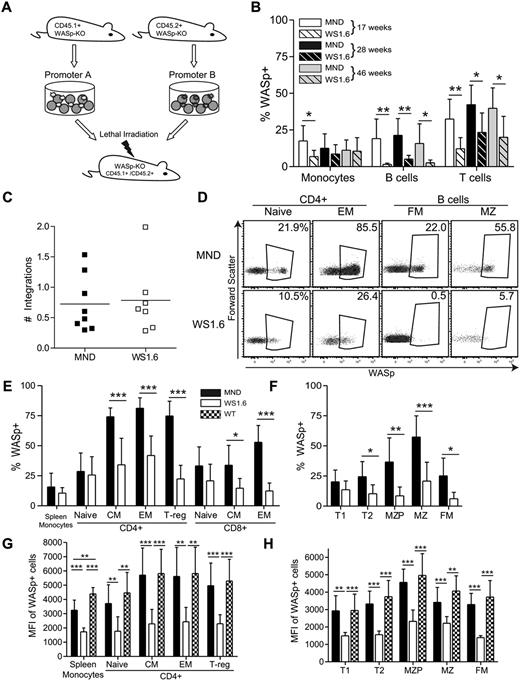
The proximal promoter region of the WAS gene was previously characterized.36 This region drives hematopoietic gene expression in vitro36 and LV vectors combing this region for hWASp cDNA expression were previously evaluated in vitro and in vivo.23,24,37 We used an in vivo murine competitive repopulation model to compare SIN-LVs containing either the WAS1.6 element (WS1.6-huWASp) or the MND promoter (MND-huWASp) in an identical animal host. Congenic WASp−/−CD45.1+ or WASp−/−CD45.2+ lineage-depleted (linneg) HSCs were isolated and transduced with alternative LVersus Equal cell numbers were mixed and transplanted into conditioned CD45.1+CD45.2+ WASp−/− recipients (Figure 1A). We observed an equivalent percentage of WASp+ peripheral blood (PB) myeloid cells derived from MND or WS1.6-treated stem cells (average marking 11% WASp+ at 40 weeks); similar marking levels persisted at all times, reflecting minimal selective advantage of WASp+ myeloid cells.15,17,18 However, there was significant selection for WASp+ T cells (40%) and B cells (16%) in the MND-transduced compartment, but only a limited selection of WASp+ T cells in the WS1.6-transduced compartment (20%). Surprisingly, we could not detect WASp expression in PB B cells derived from WS1.6-LV transduced HSCs, suggesting limited promoter activity in B cells (Figure 1B). As these results might be skewed by differences in relative viral marking, we sorted CD45.1+ or CD45.2 + CD11b+ BM monocytes 11 months after transplant for qPCR viral copy analysis. Only those samples that exhibited an equivalent range of viral marking (0.3-2.0 viral integrations per cell; Figure 1C) were included.
WS1.6 promoter results in limited selection of WASp+ cells in vivo. (A) Experimental design for in vivo promoter comparison studies. WASp−/− congenically marked HSC were transduced with either MND or WS1.6-containing LV and cotransplanted into lethally irradiated WASp−/− CD45.1+CD45.2+ recipients. (B) WASp expression in peripheral blood mononuclear subsets was examined by intracellular staining at different time points; monocytes (CD11b+GR1low); B cells (B220+CD3−); and T cells (B220−CD3+). (C) Viral copy numbers in sorted CD45.1+ or CD45.2+ BM CD11b+ monocytes were analyzed by qPCR. (D) Representative WASp staining in splenic T-and B-cell subsets, with the summary WASp expression data shown for T cells (E) and for B cells (F). To quantify WASp expression in different subsets, we analyzed MFI of WASp+ cells within the T- (G) and B-cell (H) lineages. Data represent 2 unique experiments with error bars showing standard deviation (SD), n = 8 for MND and 7 for WS1.6 (*P < .05; **P < .01; ***P < .001).
WS1.6 promoter results in limited selection of WASp+ cells in vivo. (A) Experimental design for in vivo promoter comparison studies. WASp−/− congenically marked HSC were transduced with either MND or WS1.6-containing LV and cotransplanted into lethally irradiated WASp−/− CD45.1+CD45.2+ recipients. (B) WASp expression in peripheral blood mononuclear subsets was examined by intracellular staining at different time points; monocytes (CD11b+GR1low); B cells (B220+CD3−); and T cells (B220−CD3+). (C) Viral copy numbers in sorted CD45.1+ or CD45.2+ BM CD11b+ monocytes were analyzed by qPCR. (D) Representative WASp staining in splenic T-and B-cell subsets, with the summary WASp expression data shown for T cells (E) and for B cells (F). To quantify WASp expression in different subsets, we analyzed MFI of WASp+ cells within the T- (G) and B-cell (H) lineages. Data represent 2 unique experiments with error bars showing standard deviation (SD), n = 8 for MND and 7 for WS1.6 (*P < .05; **P < .01; ***P < .001).
We used flow cytometry to analyze selection for WASp+ cells in splenic subsets 40 weeks after transplant (gating shown in supplemental Figure 1C). WASp-expressing cells comprised ∼ 15% of splenic CD11b+ monocyte compartment in MND-treated cells, a level that probably represents viral transduction of long-lived stem cells. In comparison, memory and regulatory CD4+ and CD8+ T cells derived from the MND-treated stem cells demonstrated strong selection for WASp+ cells (∼ 75% WASp+ in CD4+ memory, 75% in FoxP3+ T-regulatory compartment, and 50% WASp+ in CD8+ memory compartment). In contrast, the WS1.6-huWASp LV vector led to limited selection for WASp+ CD4+ cells and no obvious selection in CD8+ subsets (Figure 1D-E; 35% percent in CD4+ Memory versus 11% myeloid). These data suggest that the WS1.6 promoter is significantly less effective than the MND element at driving selection of WASp+ T cells.
We observed even greater differences in MND versus WS1.6 activity in B cells. The MND vector resulted in significant selection for WASp+ cells in the FM (25%) and MZ B-cell (57%) compartments. However, the WS1.6 promoter was minimally active in B cells and resulted in a limited selection of WASp+ B-cell subsets (FM: 6%; MZ: 20%; Figure 1D-F). Combined with the peripheral blood expression analyses, these observations suggest poor functionality of the WS1.6 promoter in murine B cells.
The reduced selection of WASp+ cells in the WS1.6-LV versus MND-LV treated compartments correlated with relative promoter activity. We compared median fluorescence intensity (MFI) solely within the WASp+ gate for each hematopoietic cell populations. WASp+ cells from WT or MND transplants exhibited equivalent levels of WASp expression, whereas the WS1.6 promoter consistently exhibited 2 to 3-fold lower MFI compared with either WT or MND (Figure 1G-H). Overall, these in vivo competition experiments reveal significant differences in WASp expression with alternative promoters.
The WS1.6 promoter is less active in primary human cells compared with MND
We reasoned that transcriptional differences between human and murine cells might limit effective transcription of the human-derived WS1.6 promoter.7,37 We therefore analyzed vector activity in cells derived from human primary CD34+ cells. We transplanted NOD-SCID–common γ-chain–deficient (NSG) recipient mice32 with human CD34+ cells transduced with LV vectors containing green fluorescent protein (GFP) under the control of either the MND or WS1.6 promoter. Only animals with an equivalent percentage of GFP+ human-derived cells were included in the analysis (supplemental Figure 2A). Compared with WS1.6, MND-transduced cells exhibited significantly higher levels of GFP expression in all lineages, including myeloid, B and T cells (supplemental Figure 2B-C). Combined with our murine competitive repopulation analysis, these findings suggest that the WS1.6 promoter is significantly less active than the MND element in multiple human and murine hematopoietic lineages.
MND-huWASp LV results in stable pan-hematopoietic cell marking in vivo
Based on its greater activity in our initial studies, we analyzed the efficacy and safety of the MND-huWASp LV vector in multiple independent cohorts. Controls included identical transplants using either mock transduced WT or WASp−/− linneg cells (WT mock, WTM; knockout mock KOM, respectively); and unmanipulated, age-matched WT, and WASp−/− animals. We killed recipients at 10 months after transplant for detailed analysis and transplanted total BM into secondary recipients for additional analysis. MND-treated recipients demonstrated stable WASp expression in the PB myeloid compartment, with approximately 25% of CD11b+ monocyte cells expressing WASp at all time-points (supplemental Figure 3A-B). Consistent with initial observations, we detected strong selection for WASp+ T cells, with proportion of WASp+CD3+ T cells increasing progressively and plateauing at ∼ 50% at 30 weeks (supplemental Figure 3B).
Correcting thrombocytopenia is crucial to successful application of gene therapy for WAS. Gene therapy treatment resulted in significant selection of WASp+ platelets (supplemental Figure 3B). However, although MND recipients tended to exhibit higher platelet numbers compared with KOM recipients, these data did not reach statistical significance (supplemental Figure 3C). Combined, gene therapy with MND vector resulted in stable myeloid expression and progressive selection for WASp+ T cells and platelets within the peripheral blood.
MND-huWASp LV promotes peripheral T-cell selection
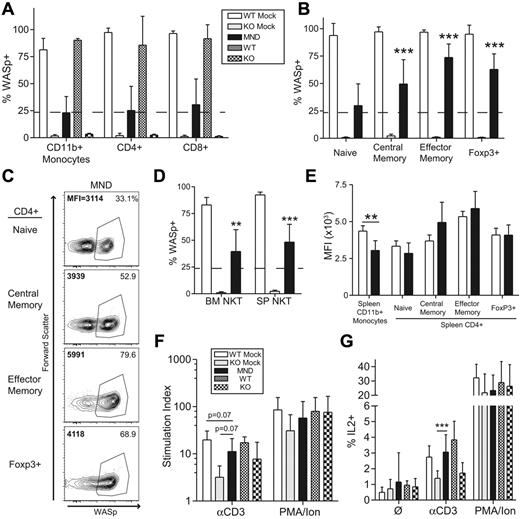
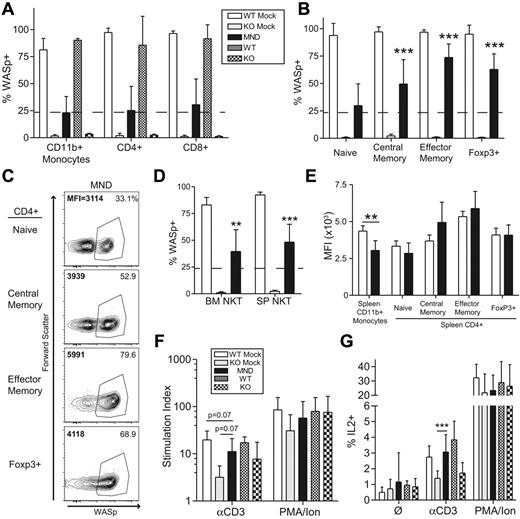
Phenotypic analysis at 10 months after transplantation revealed strong selection of WASp+ T cells in the thymus and the spleen of MND LV-treated mice. Because the myeloid compartment lacks selective advantage for WASp+ cells,15,17,18 we established the splenic CD11b+ monocyte compartment (∼ 25% WASp+) as a selection threshold. Compared with monocytes, there was minimal selection of WASp+ cells at the thymic CD4+ or CD8+ single-positive stage (Figure 2A). In contrast, we observed strong selection for WASp+ splenic T cells. In CD4+ T cells, there was strong selection of WASp+ cells in the regulatory T cell (∼ 70% WASp+), effector memory (75%), and central memory (50%) compartments (Figure 2B-C). A similar selection pattern was observed for effector memory CD8+ T cells (55%); however, there was no selection within the CD8+ central memory subset (supplemental Figure 4A). In addition to canonical T-cell subsets, WASp also regulates function and homeostasis of noncanonical natural killer (NK)T cells.16,38 We observed significant selection of WASp+ NK1.1+CD3+NKT cells in both the BM and the spleen (BM: ∼ 40%; SP: ∼ 45%; Figure 2D). Taken together, our results demonstrate significant selection of WASp+ T cells and NKT cells after treatment with the MND LV vector.
The MND-WASp LV mediates selection of WASp+ T cells and restoration of T-cell functionality. (A) WASp expression in the splenic CD11b+ monocyte and thymic single-positive T-cell compartment. The dotted line represents WASp expression within splenic monocyte compartment, whereas stars identify significant deviations from monocyte marking. (B) Cumulative data showing the percentage WASp+ cells in distinct CD4+ splenic T-cell subsets. (C) Representative flow cytometry data for CD4+ splenic subsets. The proportion of WASp+ cells is listed in the top right corner, whereas MFI of WASp+ cells is shown in the top left corner. (D) WASp expression in the BM and splenic CD3+NK1.1+ NKT compartment. (E) MFI values were obtained from WASp+ cells. The aggregate MFI values for splenic monocytes and CD4+ T cells are shown. (F) Total splenocytes were stimulated with αCD3 or PMA/Ionomycin and proliferation was quantified using thymidine incorporation. Stimulation index (SI) is the ratio of stimulated compared with unstimulated samples. (G) Total splenocytes were stimulated with αCD3 or PMA/Ionomycin for 6 hours and percent of IL2+CD4+ cells quantified by flow cytometry. With the exception of the MFI data, these findings represent 4 unique experiments with error bars indicative of SD (n = 7 for WTM, 6 for KOM, and 19 for MND). The MFI analysis is derived from 2 unique experiments, n = 4 for WTM mice and 8 for MND animals. Unless specifically indicated, stars indicate significant differences in WASp expression compared with splenic CD11b+ monocytes (*P < .05; **P < .01; ***P < .001).
The MND-WASp LV mediates selection of WASp+ T cells and restoration of T-cell functionality. (A) WASp expression in the splenic CD11b+ monocyte and thymic single-positive T-cell compartment. The dotted line represents WASp expression within splenic monocyte compartment, whereas stars identify significant deviations from monocyte marking. (B) Cumulative data showing the percentage WASp+ cells in distinct CD4+ splenic T-cell subsets. (C) Representative flow cytometry data for CD4+ splenic subsets. The proportion of WASp+ cells is listed in the top right corner, whereas MFI of WASp+ cells is shown in the top left corner. (D) WASp expression in the BM and splenic CD3+NK1.1+ NKT compartment. (E) MFI values were obtained from WASp+ cells. The aggregate MFI values for splenic monocytes and CD4+ T cells are shown. (F) Total splenocytes were stimulated with αCD3 or PMA/Ionomycin and proliferation was quantified using thymidine incorporation. Stimulation index (SI) is the ratio of stimulated compared with unstimulated samples. (G) Total splenocytes were stimulated with αCD3 or PMA/Ionomycin for 6 hours and percent of IL2+CD4+ cells quantified by flow cytometry. With the exception of the MFI data, these findings represent 4 unique experiments with error bars indicative of SD (n = 7 for WTM, 6 for KOM, and 19 for MND). The MFI analysis is derived from 2 unique experiments, n = 4 for WTM mice and 8 for MND animals. Unless specifically indicated, stars indicate significant differences in WASp expression compared with splenic CD11b+ monocytes (*P < .05; **P < .01; ***P < .001).
Consistent with these findings we observed no significant differences in WASp expression in WASp+ T cells derived from WT recipients (WTM) or MND LV-treated animals (Figure 2E, supplemental Figure 4B). These combined observations indicate that the MND promoter restores endogenous level WASp expression in all T-cell developmental subsets.
MND-huWASp LV therapy reconstitutes T-cell receptor signaling
We next determined whether MND-mediated WASp expression rescued T-cell functionality in vitro. We used αCD3 ligation to directly analyze the functional consequences of gene therapy treatment. As expected, splenocytes from KOM recipients exhibited significantly reduced proliferation and IL2 production after αCD3 stimulation compared with WTM controls; however both groups exhibited equivalent responsiveness to phorbol myristate acetate (PMA)/ionomycin stimulation (Figure 2F-G). Splenocytes isolated from MND recipients exhibited nearly complete correction of αCD3-induced proliferation and IL2 production (Figure 2F-G). We also determined whether WASp expression directly correlated with normalized IL2 production on a per cell basis. Splenocytes from WTM, KOM, and MND secondary recipients were stimulated with αCD3 for 6 hours and stained for αIL2 in conjunction with αCD4 and αWASp antibodies. We detected IL2 production solely within the CD4+WASp+ population (supplemental Figure 4C). Further, the level of IL2 production was equivalent in WT and MND LV-treated CD4+WASp+ T cells, demonstrating the complete correction of T-cell WASp-deficiency through LV-mediated provision of WAS protein. Overall, these data demonstrate successful gene therapy-mediated correction of T-cell functionality at a single cell resolution.
MND-WASp LV therapy improves B-cell lymphopoiesis and MZ B-cell numbers
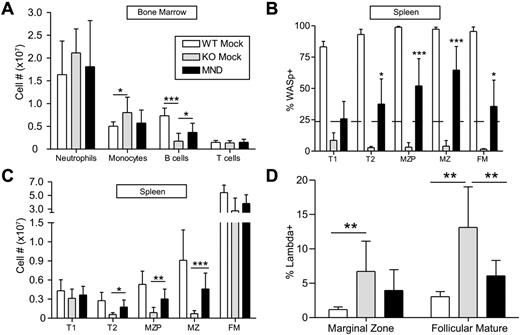
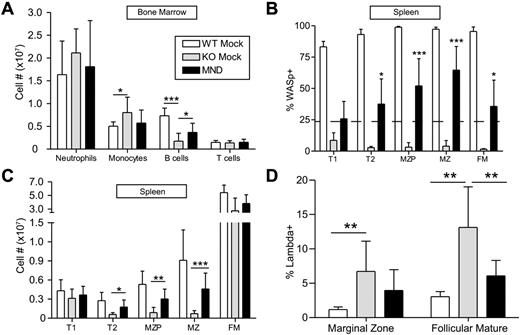
In addition to T-cell function, WASp is crucial for the development and maintenance of mature B cells.17,18,39 WASp-deficient mice transplanted with knockout stem cells exhibited neutrophilia and decreased BM B-cell numbers compared with either WTM or MND recipients (Figure 3A). In the spleen, WASp regulates the homeostasis of MZ B cells.17,18 Spleens isolated from MND LV-treated mice revealed significant selection of WASp+ B cells, especially within the MZ subset (Figure 3B). There was also selection of WASp+ cells within the follicular mature compartment; however, consistent with previous data,17,18 it was not as dramatic as within the MZ subset. Consistent with the selection data, WASp-deficiency resulted in negligible numbers of MZ precursors (MZP) and MZ B cells. MND LV-treated mice, on the other hand, exhibited a 6-fold increase in the number of MZP and MZ B cells compared with KOM controls (Figure 3C). Based on these observations, we conclude that treatment with the MND LV significantly restores the development of MZ B cells.
The MND-huWASp LV restores B-cell development and selection. (A) Numbers of BM CD11b+GR1hi neutrophils, CD11b+GR1low monocytes, CD11b−B220+ B cells, and CD11b−CD3+ T cells at 40 weeks after transplant. (B) WASp expression in splenic B-cell subsets. As in Figure 2, the dotted line represents WASp expression within splenic monocytes, whereas stars identify significant deviations from monocyte marking. (C) Absolute numbers in splenic B-cell compartments. These data are from 4 independent experiments with error bars indicative of SD (n = 7 for WTM, 6 for KOM, and 19 for MND). (D) Proportion of λ+ cells within the splenic B-cell subsets. Error bars represent SD based on 3 unique experiments; n = 6 for WTM, 4 for KOM, and 13 for MND. Unless specifically indicated, stars indicate significant differences in WASp expression compared with splenic CD11b+ monocytes (*P < .05; **P < .01; ***P < .001).
The MND-huWASp LV restores B-cell development and selection. (A) Numbers of BM CD11b+GR1hi neutrophils, CD11b+GR1low monocytes, CD11b−B220+ B cells, and CD11b−CD3+ T cells at 40 weeks after transplant. (B) WASp expression in splenic B-cell subsets. As in Figure 2, the dotted line represents WASp expression within splenic monocytes, whereas stars identify significant deviations from monocyte marking. (C) Absolute numbers in splenic B-cell compartments. These data are from 4 independent experiments with error bars indicative of SD (n = 7 for WTM, 6 for KOM, and 19 for MND). (D) Proportion of λ+ cells within the splenic B-cell subsets. Error bars represent SD based on 3 unique experiments; n = 6 for WTM, 4 for KOM, and 13 for MND. Unless specifically indicated, stars indicate significant differences in WASp expression compared with splenic CD11b+ monocytes (*P < .05; **P < .01; ***P < .001).
Partial correction of altered B-cell selection with MND-huWASp LV therapy
The development of B-cell mediated autoimmunity is a major potential concern for successful implementation of WAS gene therapy. Elevated λ light chain (λ LC) is a useful surrogate for potential autoreactivity within the naive B-cell compartment, presumably because of enrichment for self-reactive cells that have undergone receptor editing.40 Compared with the WTM controls, KOM recipients exhibited an elevated proportion of λ+ cells within both MZ and FM compartments. In contrast, MND LV-treated recipients demonstrated a significantly reduced proportion of λ+ cells in the FM subset; and a similar trend in the MZ subset (Figure 3D). In addition to defective B-cell selection, WASp-deficient mice also generate high titers of autoreactive anti–double-stranded DNA (αDNA) antibodies.15,41 KOM recipients had high levels of αDNA antibody production compared with WTM controls. Surprisingly, MND recipients exhibited equivalent levels of αDNA antibody production as KOM recipients at all times after transplant (see below). These data suggest that MND-LV partially corrects B-cell selection defects.
MND-huWASp LV efficiently targets long-term repopulating hematopoietic cells
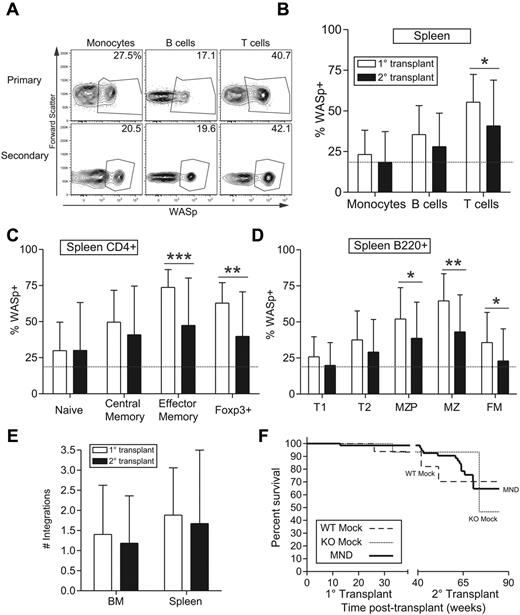
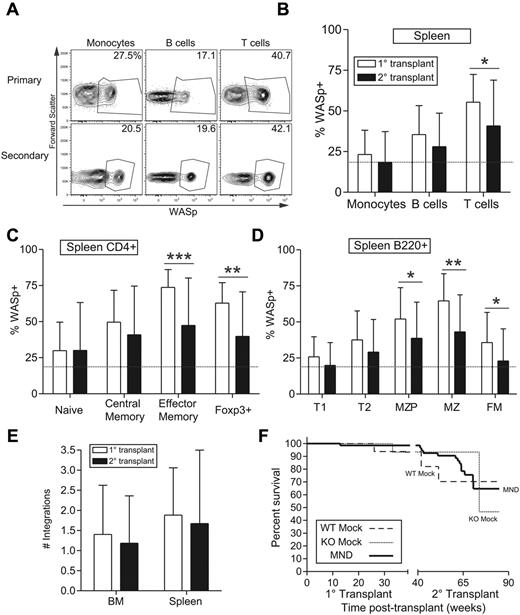
We used secondary transplantation to determine stem cell transduction. Total BM from primary donors at 10 months after transplantation was transplanted into conditioned secondary recipients and these recipients were analyzed at 20 to 30 weeks after transplant. Consistent with stem cell transduction, secondary recipients exhibited WASp expression in both short-lived myeloid cells and longer-lived lymphocytes (Figure 4A-B). Similar to primary recipients, we observed selection of WASp+ cells within the splenic B-cell and CD4+ T-cell populations (Figure 4C-D, compare dotted line with black bars). However, compared with primary transplants selection rate was somewhat reduced for all lymphoid subsets, especially for CD4+ effector memory and MZ B-cell compartments (Figure 4C-D, compare white with black bars). It is unclear whether reduced selection reflects limited HSC transduction or partial silencing of the LV vector.
The MND-huWASp LV transduces long-lived hematopoietic stem cells. (A) Representative flow cytometric WASp expression in PB leukocytes from primary or secondary recipients. The primary recipient in top panel was used to reconstitute secondary recipient in the bottom panel. (B-D) Summary of WASp expression in primary versus secondary recipients for splenic total hematopoietic populations (B); T-cell (C) and B-cell (D) subsets. The dotted line represents proportion of WASp+ monocytes in secondary recipients. (E) Number of viral integrations within total spleen or BM was calculated using real-time PCR. (F) Kaplan-Meier curves were generated on the basis of overall animal survival during the nearly 2-year follow-up period including both primary and secondary recipients. Error bars represent SD based on 19 primary and 34 secondary recipients (*P < .05; **P < .01; ***P < .001).
The MND-huWASp LV transduces long-lived hematopoietic stem cells. (A) Representative flow cytometric WASp expression in PB leukocytes from primary or secondary recipients. The primary recipient in top panel was used to reconstitute secondary recipient in the bottom panel. (B-D) Summary of WASp expression in primary versus secondary recipients for splenic total hematopoietic populations (B); T-cell (C) and B-cell (D) subsets. The dotted line represents proportion of WASp+ monocytes in secondary recipients. (E) Number of viral integrations within total spleen or BM was calculated using real-time PCR. (F) Kaplan-Meier curves were generated on the basis of overall animal survival during the nearly 2-year follow-up period including both primary and secondary recipients. Error bars represent SD based on 19 primary and 34 secondary recipients (*P < .05; **P < .01; ***P < .001).
The number of viral integrations impacts transgene expression as well as the risk of insertional mutagenesis. We used quantitative polymerase chain reaction (qPCR) to analyze the average number of viral integrations in BM and splenic cells derived from primary and secondary recipients. The average number of viral integrations in primary recipients was 1.5 and 2 viral copies in BM and spleen, respectively (Figure 4E). Because these numbers represent bulk cell populations, the actual number of viral integrations in transduced cells is higher, probably ranging from 2 to 5 viral copies per transduced cell. Consistent with WASp staining, secondary recipients exhibited a lower number of viral integrations in both BM and spleen. To determine whether viral transduction negatively impacted survival, we performed a Kaplan-Meier survival analysis based on 9 months follow-up for both primary and secondary recipients. Although secondary recipient mice demonstrated an impaired lifespan compared with primary recipients, overall survival was equivalent between WTM, KOM, and MND recipients in both settings (Figure 4F). These experiments suggest that the MND LV vector stably transduced long-lived HSCs with approximately 2 to 5 viral copies per transduced WASp+ BM-derived cell.
Development of myeloid clonal expansion in a single MND LV-treated mouse
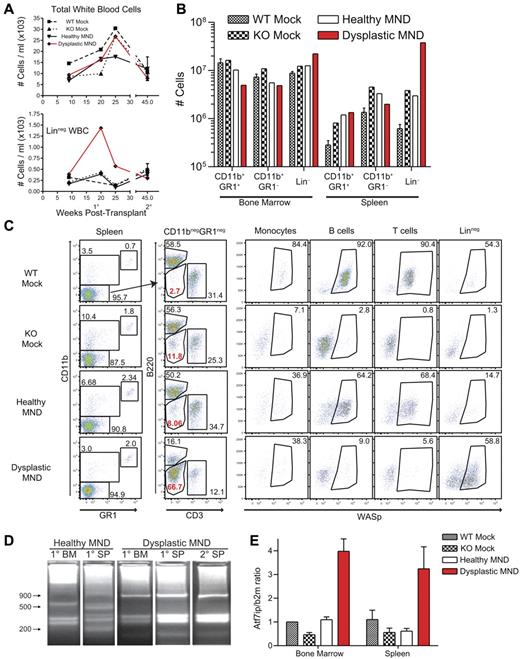
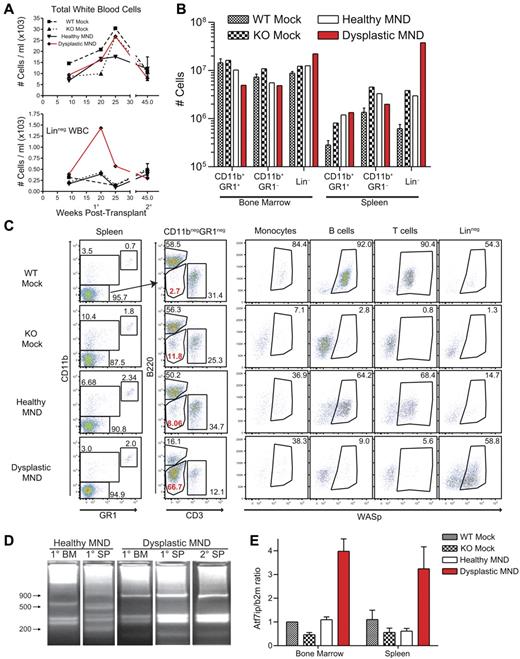
Although we did not observe evidence for toxicity or survival deficits in MND-treated animals, one MND LV-treated mouse presented with potential viral-mediated clonal expansion. This animal was transplanted with WASp−/− HSCs transduced with MND LV (after a single-dose [10.5 Gy] irradiation conditioning regimen). Peripheral blood analysis revealed possible myelodysplastic features, including proportion expansion of a linneg(CD11b−GR1−B220−CD3−) population. The size of this population peaked at 20 weeks after transplant and decreased afterward (Figure 5A bottom panel). This animal did not exhibit altered activity or other evidence of illness and was killed at 27 weeks after transplant. The expanded linneg population was present in both BM and spleen (Figure 5B). Strikingly, approximately 60% of linneg cells expressed WASp (Figure 5C bottom right), suggesting viral association with the expansion. The proportion of WASp+ cells was similar in linneg and CD11b+ myeloid cells; and substantially greater than the proportion of WASp+ lymphoid cells (Figure 5C). As myeloid cells lack selective advantage for WASp+ expression, this discrepancy in lymphoid versus myeloid WASp expression was puzzling. Secondary recipients derived from this donor, however, exhibited high-level WASp expression in all lineages, suggesting that the WASp expression pattern in the primary recipient was because of expansion of an early multipotent progenitor that reconstituted all hematopoietic lineages on secondary transplantation (data not shown).
Development of myeloid clonal expansion in a single MND-huWASp LV recipient. (A) Total white blood cell numbers (top) and number of peripheral blood linneg cells (bottom) at various times after transplant. (B) Absolute numbers of hematopoietic subsets in the spleen and the BM 28 weeks after transplant. (C) WASp staining within distinct splenic hematopoietic subsets. (D) LAM-PCR analysis of total splenocytes and total BM from primary and secondary recipients. (E) Atf7ip mRNA expression in BM and spleen isolated from primary recipients. Error bars represent SD based on 3 separate PCR experiments.
Development of myeloid clonal expansion in a single MND-huWASp LV recipient. (A) Total white blood cell numbers (top) and number of peripheral blood linneg cells (bottom) at various times after transplant. (B) Absolute numbers of hematopoietic subsets in the spleen and the BM 28 weeks after transplant. (C) WASp staining within distinct splenic hematopoietic subsets. (D) LAM-PCR analysis of total splenocytes and total BM from primary and secondary recipients. (E) Atf7ip mRNA expression in BM and spleen isolated from primary recipients. Error bars represent SD based on 3 separate PCR experiments.
We used linear amplification-mediated PCR (LAM-PCR)42 to analyze vector insertion sites in expanded cells. Although an unaffected (“healthy”) MND recipient exhibited a polyclonal integration pattern, the affected mouse presented with an oligoclonal integration profile in both BM and spleen (Figure 5D). We identified 4 unique integration sites in the affected animal and secondary recipients, including an integration site located in intron 4 of the previously described proto-oncogene Atf7ip.43,44 Semiquantitative qPCR identified increased Atf7ip expression in BM and splenocytes from the affected animal (Figure 5E). However, despite clonal expansion, neither the primary nor the secondary recipients exhibited signs of overt leukemia or disease progression (data not shown). PB, spleen, BM, and thymus cellularity remained similar to other MND transplants and histologic analysis did not reveal alterations in BM or spleen cytospin preparations (data not shown). Overall, these findings are most consistent with the development of clonal dominance in a single animal treated with a high-dose conditioning regimen; and although these events may potentially be related to LV integration, they did not result in overt disease or tissue damage.
WS1.6-huWASp LV mediates limited WASp expression in vivo
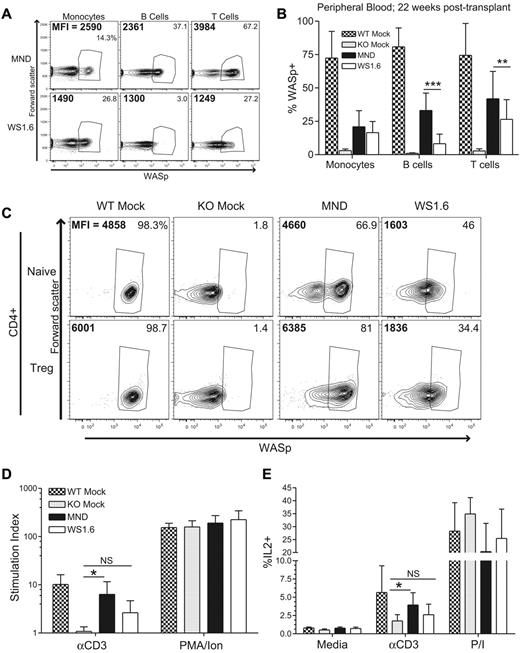
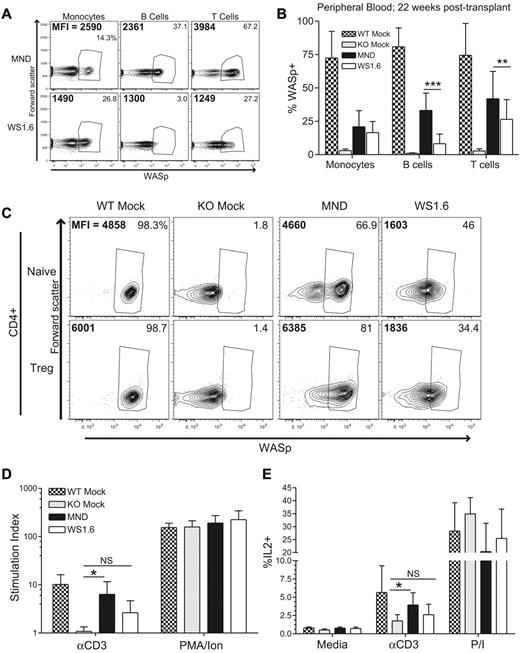
These latter observations underscore the potential risk of insertional mutagenesis inherent with viral vector therapy. Mammalian promoters may be a safer alternative compared with virally derived LTRs.21 Although the WS1.6 promoter performed less effectively in our initial experiments (Figure 1), we reasoned that this difference might have been exaggerated in the setting of competitive repopulation. Therefore, we compared WS1.6-huWASp versus MND-huWASp in rescuing WAS-associated hematologic defects in a noncompetitive setting. Isolated WASp−/− Linneg cells were transduced with either MND or WS1.6-huWASp LVs and transplanted into conditioned recipients. As seen previously, MND recipients exhibited endogenous levels of WASp in all PB subsets and robust selection for WASp+ T cells (Figure 6A-B). In contrast, despite equivalent myeloid marking, WS1.6 recipients exhibited subendogenous WASp expression in both myeloid cells and T cells, correlating with more limited T-cell selection compared with MND recipients (Figure 6A).
The WS1.6-huWASp LV partially restores WASp expression and functionality in T cells. WASp expression was analyzed 20 weeks after transplant in MND- versus WS 1.6-huWASp LV recipients. (A) Representative flow cytometry plots showing WASp expression within different PB subsets. Percent WASp+ cells in each subset is shown in the top right corner and the MFI of WASp+ cells is shown in the top left corner. Pooled PB data are shown in panel B. (C) Representative flow cytometry analysis showing WASp expression in CD4+ splenic T-cell subsets. For T-cell functional assays, total splenocytes were stimulated with αCD3 or PMA/ionomycin and proliferation (D) and IL2 production (E) were analyzed as described in Figure 2. As the proliferation and IL2 production were similar for mock treated and nontransplanted controls, these 2 groups were combined for panels D and E to improve statistical power. Except for panel B, the data represent 2 unique experiments, n = 5 for WTM, 5 for KOM, and 8 each for MND and WS1.6. Data shown in panel B represents 5 unique experiments, n = 11 for WTM, 11 for KOM, 20 for MND, and 21 for WS1.6. Error bars represent SD (*P < .05; **P < .01; ***P < .001).
The WS1.6-huWASp LV partially restores WASp expression and functionality in T cells. WASp expression was analyzed 20 weeks after transplant in MND- versus WS 1.6-huWASp LV recipients. (A) Representative flow cytometry plots showing WASp expression within different PB subsets. Percent WASp+ cells in each subset is shown in the top right corner and the MFI of WASp+ cells is shown in the top left corner. Pooled PB data are shown in panel B. (C) Representative flow cytometry analysis showing WASp expression in CD4+ splenic T-cell subsets. For T-cell functional assays, total splenocytes were stimulated with αCD3 or PMA/ionomycin and proliferation (D) and IL2 production (E) were analyzed as described in Figure 2. As the proliferation and IL2 production were similar for mock treated and nontransplanted controls, these 2 groups were combined for panels D and E to improve statistical power. Except for panel B, the data represent 2 unique experiments, n = 5 for WTM, 5 for KOM, and 8 each for MND and WS1.6. Data shown in panel B represents 5 unique experiments, n = 11 for WTM, 11 for KOM, 20 for MND, and 21 for WS1.6. Error bars represent SD (*P < .05; **P < .01; ***P < .001).
Reduced WASp expression in WS1.6 recipients resulted in inefficient selection and functional correction of the mature splenic T-cell compartment. Whereas analysis of MND recipients revealed selection of WASp+ cells in CD4+ and CD8+ T-cell subsets at 24 weeks after transplant, WS1.6 recipients had reduced rates of T-cell selection in all subsets; and this correlated with lower WASp expression levels (Figure 6C, supplemental Figure 5A-B). WASp+ splenic T cells in MND recipients displayed endogenous-level WASp expression, whereas identical subsets in WS1.6 recipients had a 2- to 3-fold lower expression (Figure 6C, supplemental Figure 5C). Further, whereas the MND recipients exhibited significantly increased αCD3-induced proliferation and IL2 production in comparison with KO controls, the WS1.6 recipients had only elevated (but not statistically significant) increases in T-cell responsiveness compared with KO (Figure 6D-E). We also analyzed IL2 production in WASp+ versus WASp− cells to investigate IL2 production specifically in vector-marked cells. Stimulation of total splenocytes with αCD3 antibody resulted in IL2 production specifically in the WASp +CD4+ T-cell lineage. Interestingly, we observed equivalent IL2 production in WASp+ cells from WT, MND, or WS1.6 recipients (supplemental Figure 6A-B).
Limited correction of B-cell development with WS1.6-huWASp LV
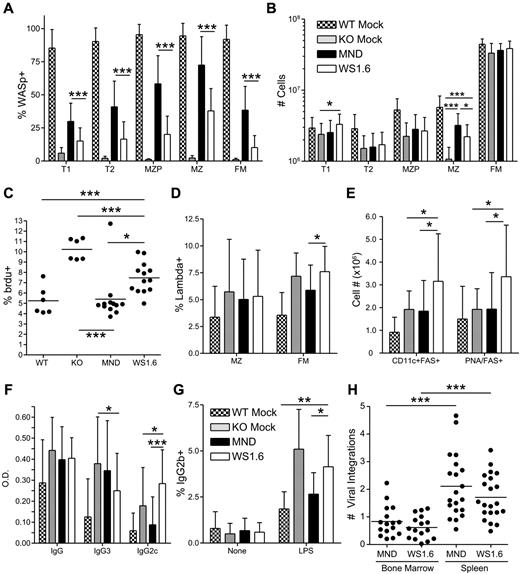
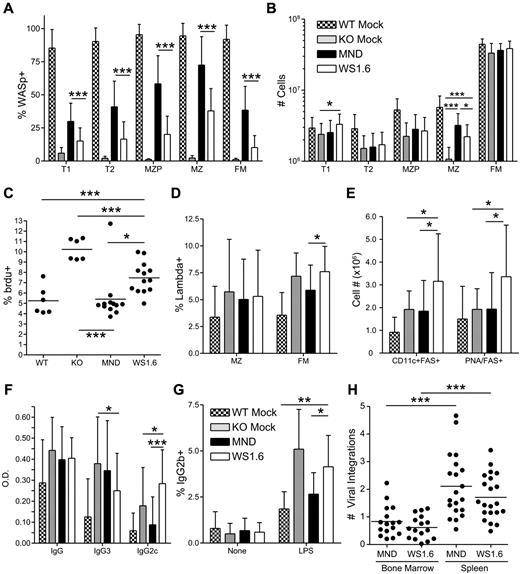
Compared with MND recipients, WS1.6-huWASp LV was less effective in rescuing B-cell development. WS1.6-mediated WASp expression was minimally detectable in B cells from peripheral blood and BM (Figure 6A-B, data not shown). Further, whereas WASp expression was detected within splenic B cells (supplemental Figure 5E), both selection and relative WASp expression was significantly lower compared with MND transplant recipients (Figure 7A, supplemental Figure 5D-E). Whereas WS1.6 treated mice exhibited partial numerical rescue of the MZ B-cell subset, MND recipients had substantially improved MZ cellularity compared with both KO and WS1.6 recipients (Figure 7B). We also analyzed the turnover of MZ cells in LV recipients using in vivo bromodeoxyuridine (BrdU) labeling. Similar to our previous findings showing increased turnover of WASp−/− MZ B cells,18 KO recipients had a significantly elevated proportion of BrdU+ MZ B cells. Consistent with the rescue of MZ B-cell numbers, MND recipients exhibited BrdU uptake at levels equivalent to WT recipients. In contrast, WS1.6 recipients had significantly higher MZ BrdU uptake compared with either WT or MND recipients (Figure 7C).
The WS1.6-huWASp LV results in minimal B-cell correction. Analysis of WASp expression, B-cell development and function in B cells from MND versus WS1.6 recipients. (A) Pooled flow cytometry data showing WASp expression for different splenic B-cell subsets. (B) Absolute numbers of splenic B-cell subsets in different recipients. (C) BrdU uptake in splenic MZ B cells from different recipients. (D) Analysis of λ LC usage within the splenic FM and MZ B-cell subsets. (E) Absolute numbers of spontaneous GC B cells (FAS+PNA+) and autoimmune prone B cells (CD11c+FAS+) within the spleen. (F) The titers of anti–double-stranded (ds) DNA antibodies were analyzed ∼ 22 weeks after transplant at a 1:200 dilution. (G) For in vitro isotype switching, B cells were isolated and stimulated with LPS for 5 days. The numbers shown reflect percent of IgG2b+ B cells after dead cell exclusion. (H) Number of viral integrations within total spleen or BM was calculated using real-time PCR. Data shown in panels A, B, D, and E are based on 5 unique experiments, (n = 11 for WTM, 11 for KOM, 20 for MND and 21 for WS1.6). Anti-DNA ELISA data in panel F are based on 8 unique experiments (n = 17 for WTM, 16 for KOM, 40 for MND, and 21 for WS1.6). Data in panels C and G are based on 3 experiments, n = 6 for WTM, 6 for KOM, 12 for MND, and 13 for WS1.6. Error bars represent SD (*P < .05; **P < .01; ***P < .001).
The WS1.6-huWASp LV results in minimal B-cell correction. Analysis of WASp expression, B-cell development and function in B cells from MND versus WS1.6 recipients. (A) Pooled flow cytometry data showing WASp expression for different splenic B-cell subsets. (B) Absolute numbers of splenic B-cell subsets in different recipients. (C) BrdU uptake in splenic MZ B cells from different recipients. (D) Analysis of λ LC usage within the splenic FM and MZ B-cell subsets. (E) Absolute numbers of spontaneous GC B cells (FAS+PNA+) and autoimmune prone B cells (CD11c+FAS+) within the spleen. (F) The titers of anti–double-stranded (ds) DNA antibodies were analyzed ∼ 22 weeks after transplant at a 1:200 dilution. (G) For in vitro isotype switching, B cells were isolated and stimulated with LPS for 5 days. The numbers shown reflect percent of IgG2b+ B cells after dead cell exclusion. (H) Number of viral integrations within total spleen or BM was calculated using real-time PCR. Data shown in panels A, B, D, and E are based on 5 unique experiments, (n = 11 for WTM, 11 for KOM, 20 for MND and 21 for WS1.6). Anti-DNA ELISA data in panel F are based on 8 unique experiments (n = 17 for WTM, 16 for KOM, 40 for MND, and 21 for WS1.6). Data in panels C and G are based on 3 experiments, n = 6 for WTM, 6 for KOM, 12 for MND, and 13 for WS1.6. Error bars represent SD (*P < .05; **P < .01; ***P < .001).
Increased B-cell hyperactivity in WS1.6 LV recipients
In addition to limited B-cell selection, WS1.6 recipients exhibited increased generation of potential autoimmune-prone B cells (Figure 7D-E). Although we observed a trend for a reduction in λ+ FM B cells in WT and MND treated animals compared with KO recipients (Figure 7D), these findings were not as striking as in Figure 3D (probably reflecting earlier posttransplant analysis, eg, 24 versus 40 weeks). However, WS1.6 recipients exhibited a significant increase in λ+ FM B cells compared with all other cohorts (Figure 7D). Strikingly, WS1.6 recipients also exhibited an increase in the number of PNA+FAS+ germinal center (GC) B cells, suggesting ongoing spontaneous GC formation (Figure 7E). Further, both female and male WS1.6 recipients developed an increase in the number of autoimmune-prone, CD11c+FAS+ B cells45 (Figure 7E), suggesting an increased risk for autoimmune manifestations in these recipients.
Spontaneous generation of high titer IgG3 DNA-binding autoantibodies is a consistent feature of WASp−/− deficient mice.14,15 Importantly, using a BM chimeric model wherein only the B-cell lineage is WASp deficient, we recently demonstrated that WASp−/− B cells become activated in the presence of WT T cells leading to generation of class-switched, pathogenic IgG2c autoantibodies and severe autoimmunity.14 Strikingly, the WS1.6 recipients demonstrated a similar pattern, with significantly decreased titers of IgG3 isotype autoantibodies and a concomitant increase in pathogenic IgG2c autoantibodies relative to KO recipients (Figure 7F). Notably, this finding was not present in MND treated animals despite the robust T-cell rescue achieved using this vector, an observation that strongly supports the idea that an imbalance in WASp expression in T versus B cells accounts for this finding in WS1.6 recipients.
We used enzyme-linked immunospot (ELISpot) analysis to directly quantify the number of antibody secreting cells in LV recipients. Isolated splenic B cells were cultured for 24 hours without mitogens and antibody secretion was evaluated using anti-IgM or anti-IgG antibodies. Compared with WT recipients, WS1.6 recipients had significantly higher levels of IgM and IgG producing antibody-secreting cells (ASCs; supplemental Figure 6C). In contrast, although MND recipients exhibited higher than WT levels of IgM-secreting cells, this increase was significantly less than WS1.6 recipients and MND treated mice exhibited similar levels of IgG-secreting ASCs compared with WT recipients. Combined, these enzyme-linked immunosorbent assay (ELISA) and ELISpot data demonstrate elevated production of autoreactive antibodies by B cells from WS1.6 recipients.
Hyper-responsiveness of WASp−/− B cells to Toll-like receptor (TLR) and anti-CD40 stimulation has been associated with increased production of antibodies.14,39 We used lipopolysaccharide (LPS) and αCD40 antibodies to stimulate splenic B cells isolated from LV-transduced recipients. Consistent with previous work,39 KO recipients exhibited increased proportion of IgG1+, IgG2b+, and IgG3+ cells after αCD40 or LPS stimulation (Figure 7G, supplemental Figure 6D-E). The hyper-response defects were fully (IgG1+, IgG2b+) or partially (IgG3+) rescued in B cells from MND recipients. In contrast, LPS or αCD40 treatment of WS1.6 B cells resulted in isotype switching at levels indistinguishable from KO B cells and significantly higher than either WT or MND recipients. In summary, B cells isolated from WS1.6 recipients were hyperreactive to mitogenic stimuli, resulting in higher levels of isotype switching in vitro and greater spontaneous antibody production in vivo.
In our previous study, enhanced autoantibody production in chimera mice with B-cell intrinsic WASp deficiency was associated evidence for significant renal histopathology.14 This prompted us to perform histologic examination of kidneys isolated from gene therapy treated recipients. We quantified mesangioproliferative and/or mesangial changes in animals from 5 independent gene transfer experiments. We observed minimal abnormalities in kidneys from WT mock recipients (supplemental Figure 7A-B). Consistent with the increase in autoantibodies compared with WT mock, both KOM and MND recipients exhibited moderate glomerular injury. Notably, consistent with higher autoantibody production and B-cell hyperresponsiveness, WS1.6 recipients exhibited significantly more glomerular alterations compared with all other groups (supplemental Figure 7A-B). Taken together, our findings suggest that unbalanced WASp expression in B- versus T-cell compartments may increase the risk of developing renal injury.
Similar number of viral integration in MND-LV versus WS1.6-LV recipients
The observed differences in MND versus WS1.6-mediated gene correction did not result from differences in LV transduction, as equivalent viral integration numbers were detected in BM and spleen samples isolated from WS1.6 versus MND recipients (Figure 7H). Together, these data suggest that the WS1.6 vector lacks sufficient activity for efficient in vivo rescue of T- and B-cell selection, development, and function despite clinically relevant levels of LV vector marking. These observations identify the weak transcriptional activity of WS1.6 promoter as a potential risk for autoimmunity and a barrier to successful clinical application of this vector.
Discussion
In this report, we identified the transcriptional activity necessary for successful gene therapy correction in a murine model of WAS. We selected 2 clinically relevant promoters for in vivo testing. The retroviral-derived MND promoter was used successfully in a recent gene therapy trial for adrenoleukodystrophy.29 The minimal WAS promoter (WS1.6) promoter has been evaluated in murine and human cellular models,1,7,8,23-25 and is now in use in the first LV clinical gene therapy trial for WAS.30 Using multiple systems, we identified fundamental constraints of the WS1.6 promoter in correcting WASp-deficiency in vivo. The WS1.6 LV mediated subendogenous levels of WASp in all lineages, provided only partial improvement in MZ B-cell numbers, and failed to limit B-cell hyperactivity. In contrast, the MND LV led to nearly complete correction of B- and T-cell function, efficient selection, and endogenous level WASp expression in all hematopoietic subsets. Our findings support continued clinical development of the MND-WASp LV and identify the WASp expression threshold necessary for correction of WAS-associated hematologic defects.
A range of alternative approaches for gene therapy treatment of WAS was previously reported.9,23,26,46 Initial research used γ-retroviral vectors to correct T-cell proliferation and regulatory T-cell function in WASp-deficient mice.9,46 However, γ-retroviral vectors are associated with increased risk of insertional mutagenesis and are currently considered a less optimal choice for clinical application. More recently, several groups have evaluated LV vectors using a series of promoters to regulate WASp expression. Two groups published initial studies in WASp−/− mice describing partial correction of T-cell and myeloid defects, respectively, using LV vectors containing elements derived from the endogenous WAS promoter (WS1.6 and WS0.5).23,24,37 Of note, T-cell proliferation and IL2 production in WS1.6 treated animals remained substantially lower compared with WT transplants. A subsequent long-term follow up of WS1.6-treated mice demonstrated significantly better selection for WASp+ cells within the T-cell lineage and substantially better T-cell proliferation and IL2 production after LV gene therapy.7 An additional study from the same group (published during the review of this paper) demonstrated that WS1.6 LV recipients exhibited selection of WASp+ B cells in BM and the spleen and that these findings correlated with partial correction of MZ B-cell development.47 In addition, WS1.6 recipients exhibited a reduction in the level of total IgG anti-DNA antibodies and increased antibody responses to pneumococcal antigens. Although the authors draw different conclusions regarding the clinical utility of the WS1.6 promoter, our data and the B-cell data presented in that report are largely equivalent, showing that the WS1.6 promoter drives sub-WT levels of WASp expression resulting in partial restoration of B-cell functionality. Overall, previous reports identify subendogenous WASp expression as sufficient for partial rescue of T-cell and myeloid functionality in vivo. Unfortunately, as shown here using the MND LV, full restoration of B-cell functionality requires consistently higher WASp expression levels. The WS1.6 promoter does not effectively meet this threshold; and this raises concerns regarding its capacity to correct the full spectrum of WAS-associated hematologic defects.
Failure to achieve lineage appropriate WASp expression may lead to unanticipated risks for WAS gene therapy. Low-level WASp expression in all lineages, as commonly observed in individuals with X-linked thrombocytopenia, does not appear to significantly increase the risk for autoimmunity.48 However, our recent work strongly suggests that failure to rescue WASp expression specifically within the B-cell compartment significantly increases the risk for autoimmune manifestations.14 By generating animals wherein only the B-cell compartment is WASp-deficient, we demonstrated that WASp−/− B cells exhibit intrinsic defects leading to spontaneous GC formation, production of pathogenic autoantibodies and early mortality. These findings are consistent with increased autoimmune sequelae in transplanted WAS patients presenting with mixed chimerism.12,49 Our previous data also demonstrate that WT T cells are required for full disease manifestation in this setting. Consistent with these ideas, we observed an increased proportion of lambda+ B naive follicular B cells, accumulation of autoimmune-prone, CD11c+FAS+ B cells, and evidence for spontaneous GC formation and elevated levels of kidney damage in WS1.6 LV-treated mice. These observations correlated with increased serum levels of IgG2c autoantibodies and enhanced reactivity to mitogens in B cells derived from WS1.6, but not MND treated mice. Thus, WS1.6 mediated correction of T- but not B-cell deficits might facilitate altered tolerance and increased risk of autoimmune complications.
Insertional mutagenesis represents an additional potential risk for viral gene therapy in WAS. Enhancer-mediated insertional mutagenesis stems from excessive enhancer and/or transcriptional activity of the integrated viral vector.50 Insertional mutagenesis has now been reported for 2 patients treated within the first WAS gammaretroviral-based clinical trial.5,6 This trial used a vector containing the highly active, myeloproliferative sarcoma virus long terminal repeat9 and resulted in significant clinical improvements, including increased platelet numbers and selection of WASp+ T cells, B cells, platelets, and NK cells.5 Unfortunately, 2 patients in the latter phase of the trial developed a T-cell leukemia potentially because of insertional mutagenesis within the protooncogene, LMO2.6 SIN vectors reduce the risk of insertional mutagenesis50 ; however, viral-mediated activation of neighboring genes and clonal expansion remains a significant potential concern.51 Consistent with other gammaretrovirus-derived enhancer/promoter elements, MND may exhibit transactivation potential when used as an internal LV promoter. In accord with this idea, we observed clonal dominance in one animal treated with MND-LV. The clonally expanded population contained 4 viral integrations including a unique integration site in intron 4 of the Atf7ip proto-oncogene; and clonal expansion correlated with increased expression of Atf7ip mRNA. Although the causative role of LV integration in clonal expansion remains uncertain, these observations identify a potential risk for insertional mutagenesis with SIN-LVs incorporating the MND promoter. However, it should be noted that the MND promoter was recently used in a successful clinical trial for gene therapy treatment of adrenoleukodystrophy29 without any adverse events or evidence for clonal dominance with a > 4 year follow-up. We are currently evaluating LV vectors that incorporate insulator elements designed to reduce the transactivation potential of the MND promoter.
In summary, our studies demonstrate the challenges of identifying an optimal promoter element for gene therapy treatment of WAS. Our findings clearly demonstrate near complete functional correction in multiple hematopoietic cell lineages with MND-huWASp LV gene transfer. However, the clonal expansion and transcriptional dysregulation observed in one MND-treated animal highlights a potential risk for this enhancer/promoter in vivo. In contrast, although the WS1.6 promoter has been shown to exhibit a relatively low risk of insertional mutagenesis in vitro,21 this element is unable to fully rescue WAS-associated hematologic defects and may predispose to autoimmune complications. To succeed, gene therapy for WAS will require an appropriate balance between the competing risks of insertional mutagenesis and reduced clinical efficacy associated with insufficient promoter activity.
The online version of this article contains a data supplement.
The publication costs of this article were defrayed in part by page charge payment. Therefore, and solely to indicate this fact, this article is hereby marked “advertisement” in accordance with 18 USC section 1734.
Acknowledgments
The authors thank Mikhail Garibov and Michelle Brault for helping to prepare LV vectors, Brigid Stirling for technical assistance with real-time PCR analysis, Sara A. Mamman for assistance with animal work, Michael Harkey for assistance with LAM-PCR analysis, and Kelly Hudkins and Charles Alpers for renal pathology analysis. They also thank Hannah Kerns, Shaun Jackson, and the rest of the Rawlings laboratory for valuable suggestions and discussions.
This work was supported by the National Institutes of Health (RO1 award AI071163, D.J.R.). A.A. was the recipient of the cellular and molecular biology training grant T32 GM07270.
National Institutes of Health
Authorship
Contribution: A.A., B.D.S, and S.S. performed experiments and analyzed the results; B.Y.R. directed LV production and LV cloning; S.K. helped with mouse transplants; S.H.B., C.H.M., and H.D.O. provided significant technical and intellectual contributions; and A.A. and D.J.R. designed the research and wrote the paper.
Conflict-of-interest disclosure: The authors declare no competing financial interests.
The current affiliation for A.A. is Pregenen Inc, Seattle, WA.
Correspondence: David J. Rawlings, Center for Immunity and Immunotherapies, Seattle Children's Research Institute, 1900 9th Ave, Seattle, WA 98101; e-mail: drawling@u.washington.edu.

