Abstract
In this study, we used the rhesus macaque model to determine the impact that AMD3100 has on lymphocyte mobilization, both alone and in combination with G-CSF. Our results indicate that, unlike G-CSF, AMD3100 substantially mobilizes both B and T lymphocytes into the peripheral blood. This led to significant increases in the peripheral blood content of both effector and regulatory T-cell populations, which translated into greater accumulation of these cells in the resulting leukapheresis products. Notably, CD4+/CD25high/CD127low/FoxP3+ Tregs were efficiently mobilized with AMD3100-containing regimens, with as much as a 4.0-fold enrichment in the leukapheresis product compared with G-CSF alone. CD8+ T cells were mobilized to a greater extent than CD4+ T cells, with accumulation of 3.7 ± 0.4-fold more total CD8+ T cells and 6.2 ± 0.4-fold more CD8+ effector memory T cells in the leukapheresis product compared with G-CSF alone. Given that effector memory T-cell subpopulations may mediate less GVHD compared with other effector T-cell populations and that Tregs are protective against GVHD, our results indicate that AMD3100 may mobilize a GVHD-protective T-cell repertoire, which would be of benefit in allogeneic hematopoietic stem cell transplantation.
Introduction
The widespread use of cytokine-mediated mobilization has had a major impact on hematopoietic stem cell transplantation (HSCT). For auto-HSCT, peripheral blood–derived stem cell (PBSC) transplantation is associated with more rapid hematopoietic reconstitution and better outcomes compared with bone marrow transplantation.1-5 For allo-HSCT, the choice is more complex. A meta-analysis showed that PBSC transplants in adults resulted in more rapid hematopoietic reconstitution, decreased relapse, and increased disease-free survival compared with bone marrow transplantation6 but did not lead to an overall survival advantage compared with bone marrow, except in patients with late-stage disease.6 This was probably because of the higher T-cell content of PBSC grafts (10- to 50-fold more than bone marrow–derived allografts),7-9 leading to a significantly greater risk of GVHD.6 In pediatrics, this increased risk of GVHD and transplant-related mortality shifted the risk/benefit balance, favoring bone marrow over PBSCs.10 These dichotomous results between pediatric and adult patients suggest that a narrow therapeutic window exists for infused lymphocytes.
With the FDA approval of AMD3100 (Plerixafor or Mozobil),11 mobilization can now occur by multiple regimens, including G-CSF alone, AMD3100 alone, or G-CSF plus AMD3100. Therefore, the risks and benefits of each of these mobilization strategies must be understood and compared with those associated with bone marrow transplantation. AMD3100 is US Food and Drug Administration (FDA)–approved for auto-HSCT, and the combination of G-CSF and AMD3100 was shown to be superior to G-CSF for stem cell mobilization.12-14 Furthermore, there was accelerated lymphocyte recovery in rhesus macaques transplanted with CD34+ cells derived from G-CSF plus AMD3100-mobilized PBSCs compared with G-CSF plus SCF-mobilized CD34+ cells.15 For allo-HSCT, the issues are more complex, given the risk of GVHD.6,10 To date, there have been no published comparisons of allo-HSCT outcomes comparing AMD3100 with G-CSF or with bone marrow. In the only study published concerning AMD3100 and allo-HSCT, Devine et al described the results of a single-arm, single-institution study of AMD3100-mobilized allo-HSCT, which analyzed engraftment, immune reconstitution, and GVHD in 20 patients compared with historical controls.16 Perhaps surprisingly, the rates of GVHD in patients receiving AMD3100-mobilized transplants were similar to G-CSF-mobilized historical controls, despite the higher numbers of lymphocytes mobilized with AMD3100.16 Although Devine et al16 did not compare the mobilization of lymphocyte subsets between patients receiving, G-CSF, AMD3100, or G-CSF plus AMD3100, a subset underwent single-time point analysis of peripheral blood T-cell counts after AMD3100, as well as an analysis of the total (unfractionated) T-cell and NK-cell content of AMD3100 versus G-CSF-mobilized apheresis products. This analysis demonstrated that significant numbers of CD3+ T cells were mobilized to the peripheral blood by AMD3100 but that there was no skewing of the T-cell subpopulation balance. The authors also reported a higher total T-cell content of the allograft, although this was not further phenotyped. The determination of the T-cell subpopulation balance induced by AMD3100 is clearly of high importance, given the suggestion from a preliminary study17 that AMD3100-mobilized T cells may be less alloreactive than those not exposed to AMD3100, and from the pilot transplant series16 that rates of GVHD were not increased after AMD3100-mobilized transplants. Although this observation leads to the provocative implication that AMD3100 may promote a pro-regulatory allograft lymphocyte profile, a detailed comparison of the impact of mobilization with G-CSF, AMD3100, or G-CSF plus AMD3100 on the lymphocyte content of the peripheral blood and the harvested apheresis product has not been reported. These studies are challenging to perform in patients, given the difficulties in performing sequential mobilization and time-course studies on healthy donors. Thus, we have undertaken a study using the well-established rhesus macaque model of mobilization and leukapheresis.15,18-23 Our results document rapid and significant mobilization of all conventional T-cell populations after exposure to AMD3100 as well as enhanced mobilization of Tregs and effector memory T-cell populations. These results suggest that AMD3100-based mobilization may promote a GVHD-protective lymphocyte content and are therefore significant both for allo-HSCT as well as for strategies designed to mobilize both effector and regulatory lymphocyte populations for adoptive cellular therapies.
Methods
Experimental animals
Specific pathogen-free juvenile to young adult (age 3-10 years) rhesus macaques were used for this study. They were housed and handled in accordance with the guidelines set by the Committee on Care and Use of Laboratory Animals (DHHS publication no. NIH 85-23). The protocol was approved by the Animal Care and Use Committees of the National Heart, Lung, and Blood Institute and Emory University.
Mobilization regimen
G-CSF mobilization involved the administration of 10 μg/kg G-CSF (filgrastim, Amgen) subcutaneously daily for 5 days. For AMD3100 mobilization, a single dose of 1 mg/kg (Sigma-Aldrich) was given subcutaneously after reconstitution of 5-mg vial in 0.5 mL sterile water. The 1-mg/kg dose of AMD3100 used in rhesus macaques represents a similar per millimeter square dose compared with the FDA-approved dose of 0.24 mg/kg used in humans and is efficacious in the rhesus model.18,24 When both G-CSF and AMD3100 were given, 10 μg/kg of G-CSF was administered subcutaneously for 5 days and 1 mg/kg of AMD3100 was given on the fifth day subcutaneously. Leukapheresis products were collected approximately 2 hours after the last dose of G-CSF or AMD3100 using a CS3000-Plus blood cell separator (Baxter Healthcare) as previously described.18,19,24 An autologous blood volume of 110 mL citrated peripheral blood was collected over a 1-month period before leukapheresis and was used to prime the cell separator. Leukapheresis was performed for 2 hours, at a flow rate of approximately 11.5 mL/minute, resulting in the processing of approximately 1.5 to 3 blood volumes per procedure. Leukapheresis products were processed to remove contaminating RBCs and granulocytes using Ficoll-Paque (GE Healthcare) gradient separation. CD34+ cells were isolated by immunomagnetic separation as previously described.20 The CD34-depleted leukapheresis product was then stored at −80°C until analysis. Timed blood samples were collected in EDTA for complete blood counts, lymphocyte, monocyte, and CD34+ cell quantification, or in cell preparation tubes (CPT) with sodium heparin (Vacutainer BD Biosciences) for T- and B-cell quantification. Blood was drawn at baseline for all animals, 2 to 5 weeks before their being treated with any of the 3 mobilization regimens. Subsequent blood collections were timed as follows: For animals receiving G-CSF alone, blood was drawn at 2, 4, and 6 hours after the fifth G-CSF dose. For animals receiving AMD3100 alone, blood was drawn at 2, 4, and 6 hours after the AMD3100 dose. For animals receiving G-CSF plus AMD3100, blood was drawn at 2, 4, and 6 hours after the fifth G-CSF dose and the AMD3100 dose, which were given together.
Flow cytometric analysis
Multicolor flow cytometry panels were used to determine the following cell subpopulations: CD34+ cells, CD34+/CD45+; T cells, CD3+/CD20−; B cells, CD20+/CD3−; IgM+ B cells, CD20+/CD3−/IgM+/IgG−; IgG+ B cells, CD20+/CD3−/IgM−/IgG+; NK cells, CD3−/CD20−/CD8+; myeloid dendritic cells (mDCs), CD3−/CD20−/CD8−/HLA-DR+/CD11c+/CD123−; plasmacytoid dendritic cells (pDCs), CD3−/CD20−/CD8−/HLA-DR+/CD11c−/CD123+; CD4+ T cells, CD4+/CD3+/CD8−/CD20−; CD8+ T cells, CD8+/CD3+/CD4−/CD20−; naive T cells (Tn), CD28+/CD95− cells in either the CD4 or CD8 T-cell subsets. Central memory T cells (Tcm), CD28+/CD95+ cells in either the CD4 or CD8 T-cell subsets. Effector/effector memory T cells, CD28−/CD95+ cells in either the CD4 or CD8 T-cell subsets.25 Tregs, CD3+/CD4+/CD25high/CD127low/FoxP3+. In addition to identifying each of these lymphocyte populations, the expression of CXCR4 on each was also determined. The antibody sources and clones used for the enumeration of CD34+ cells, B cells, and effector T-cell populations were as follows: From BD Biosciences, CD3 (clone SP34-2); CD8 (clone RPA-T8); CXCR4 (clone12G5); CD34 (clone 563); CD45 (clone D058-1283); IgM (clone G20-127): IgG (clone G18-145). From eBioscience, CD4 (clone OKT4); CD20 (clone 2H7); CD28 (clone CD28.2); CD95 (clone DX2). For enumeration of Tregs, the sources and clones used were as follows: From BD Biosciences, CD3 (clone SP34-2); CD4 (clone L200); CXCR4 (clone 12G5). From eBioscience, CD127 (clone ebioRDR5). From Miltenyi, CD25 (clone 4E3). From BioLegend, FoxP3 (clone 206D). PBMCs were prepared for cell-surface and intracellular flow cytometry by purification from CPT tubes (BD Biosciences, for FoxP3 staining) and then lysing remaining RBCs using high-yield lyse buffer (Invitrogen). Antibodies were then added at the manufacturer's recommended concentration, and the manufacturers' recommendations for either cell-surface or intracellular staining were followed. To enumerate lymphocyte populations from leukapheresis products, the CD34− fraction was stained for all cell populations directly. Flow cytometry was performed using an LSRII flow cytometer (BD Biosciences), and data were analyzed using FlowJo Version 9.3.1 analysis software (TreeStar). Absolute numbers for each cell population were determined using complete blood counts and differentials.
Isolation and expansion of CD4+CD25highCD127low regulatory T cells
Purified PBMCs were enriched for CD4+ cells by magnetic column-based negative selection (CD4+ T-cell isolation kit, Miltenyi Biotec) and stained for CD4 (clone SK3, BD Biosciences), CD25 (clone 4E3, Miltenyi Biotec), and CD127 (clone eBioRDR5, eBioscience). CD4+/CD25high/CD127low (putative Treg) and CD4+/CD25low/CD127high (putative non-Treg) cells were sorted using a BD Biosciences FACSAria cell sorter. The purity of sorted Tregs and non-Tregs was assessed by staining for CD4, CD25, CD127, and intracellular FoxP3 (clone PCH101, eBioscience). Flow-sorted Tregs were expanded for 21 days by stimulating with anti–rhesus-CD3 and anti–human CD28 coated microbeads as previously described.26 To assess Treg suppressive function, a CFSE MLR assay was performed21-23,26 by incubating 2 × 10⁵ CFSE-labeled responder PBMCs with 4 × 10⁵ irradiated allogeneic PBMCs in the absence or presence of responder-specific Tregs or control, unpurified PBMCs (1:1 ratio) for 5 days at 37°C in X-Vivo-15 media (Lonza Walkersville) supplemented with 10% human serum (Irvine Scientific), penicillin-streptomycin and gentamycin (Sigma-Aldrich). On day 5, the cells were stained for CD3 (clone SP34-2, BD Biosciences), CD4 (clone SK3), and CD8 (clone RPA-T8, BD Biosciences), and the proliferation of the responder T cells was assessed flow cytometrically by the corresponding dilution of the CFSE dye.21-23,26 The ability of Tregs to suppress CD4 and CD8 responder cell proliferation was assessed by comparing the proliferation of responder T cells in cultures with and without added Tregs using FlowJo Version 9.3.1 software.
Statistical analysis
For all treatments, the data were approximately log-normally distributed. Accordingly, all analyses used log-transformed values. One-way ANOVA with posthoc Tukey Honest Significant Differences testing, as well as 2-tailed paired and unpaired t tests were then performed using the statistics package R.27 P values of < .1 were reported in this study according to a screening trial statistical design,28 in which a larger potential α error is included in studies that are designed to screen new therapies in preparation for larger trials.
Results
CXCR4 is highly expressed on B and T cells
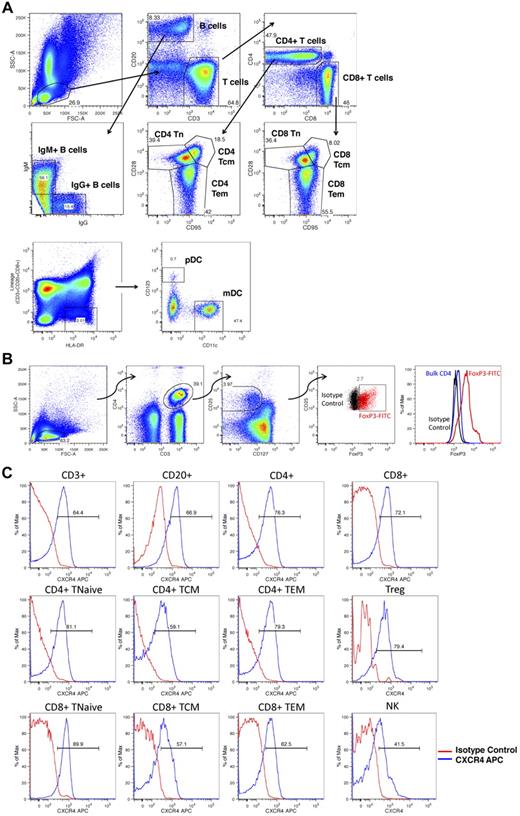
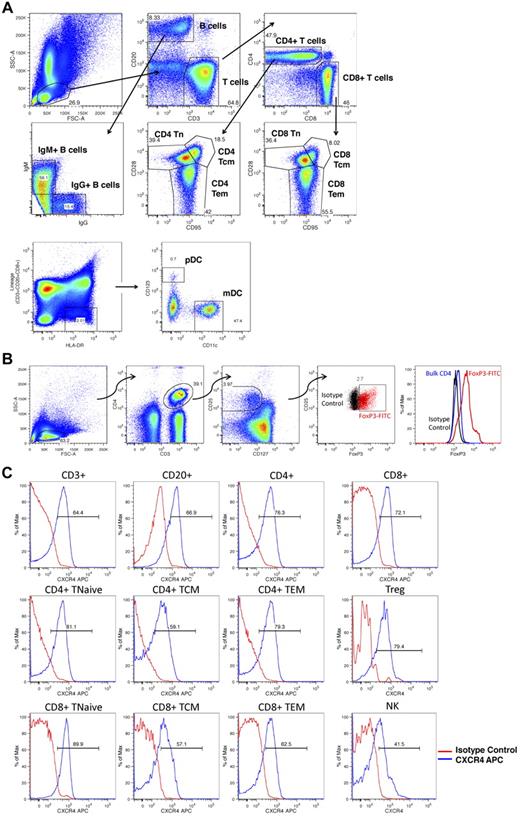
Figure 1 shows the gating strategies used to identify rhesus macaque lymphocyte subsets and to query the expression levels of CXCR4 on these cells. Multiple lymphocyte subsets were identified (Figure 1A-B), including total T cells (CD3+/CD20−), total B cells (CD20+/CD3−), total NK cells (CD3−/CD20−/CD8+), IgM+ and IgG+ B cells (CD20+/CD3− lymphocytes expressing either IgM or IgG), mDCs (CD3−/CD20−/CD8−/HLA-DR+/CD11c+/CD123−), and pDCs (CD3−/CD20−/CD8−/HLA-DR+/CD11c−/CD123+), as well as multiple T-cell subpopulations, including total CD4+ T cells (CD20−/CD3+/CD4+/CD8−), total CD8+ T cells (CD20−/CD3+/CD4−/CD8+), naive T cells (Tn, CD28+/CD95− CD4 or CD8 T cells), central memory T cells (Tcm, CD28+/CD95+ CD4 or CD8 T cells), effector memory T cells (Tem, CD28−/CD95+ CD4 or CD8 T cells), as well as CD4+ Tregs (CD3+/CD4+/CD25high/CD127low/FoxP3+ cells). Figure 1C documents that, as has been previously reported,29-31 significant CXCR4 expression was observed in each of these populations.
Flow cytometric analysis of lymphocyte subsets. (A) Peripheral blood and leukapheresis products were prepared for flow cytometry as detailed in “Flow cytometric analysis” and lymphocyte subpopulations were identified as follows: Total B cells, CD20+, CD3−; total T cells, CD3+, CD20−; NK cells, CD3−,CD20−, CD8+; mDCs, CD3−, CD20−, CD8−, HLA-DR+, CD11c+, CD123−; pDC: CD3−, CD20−, CD8−, HLA-DR+, CD11c−, CD123+; IgG+ B cells, CD3−, CD20+, IgG+,IgM−; IgM+ B cells, CD3−, CD20+, IgG−, IgM+; CD4+ T cells, CD20−, CD3+, CD4+,CD8−; CD8+ T cells, CD20−, CD3+, CD4−,CD8+; naive T cells, Tn, CD28+,CD95− CD4 or CD8 T cells; central memory T cells, Tcm, CD28+,CD95+ CD4 or CD8 T cells; effector memory T cells, Tem, CD28−,CD95+ CD4 or CD8 T cells. Shown is a representative example of the following: First row: Lymphocyte gating based on forward- and side-scatter characteristics (left panel), subsequent CD3 versus CD20 gating (middle panel), subsequent CD4 versus CD8 gating (right panel). Second row: Subsequent IgG versus IgM gating (left panel) and subsequent CD95 versus CD28 gating (middle and right panels). Third row: mDC and pDC gating based on CD123 and CD11c. (B) Peripheral blood and leukapheresis products were prepared for flow cytometry. CD4+ Tregs were identified as CD3+,CD4+, CD25high, CD127low, FoxP3+ cells. Shown is a representative example of lymphocyte gating based on forward- and side-scatter characteristics (far left panel), subsequent identification of CD3+,CD4+ cells (second panel from the left), subsequent identification of CD25high, CD127low cells (third panel from the left), subsequent labeling with FoxP3 (red cells represent CD3+,CD4+, CD25high, CD127low cells labeled with FoxP3; and black cells, CD3+,CD4+, CD25high, CD127low cells labeled with the corresponding isotype control). The far right panel shows histogram analysis of FoxP3 fluorescence comparing FoxP3 labeling of putative Tregs (red), bulk CD4 cells (blue), or putative Treg cells labeled with the FoxP3 isotype control antibody (black). (C) Peripheral blood and leukapheresis products were prepared for flow cytometry as detailed in “Flow cytometric analysis,” and CXCR4 expression was determined for each subpopulation. Shown are representative histograms showing CXCR4 fluorescence for the individual cell populations (blue traces) compared with these cells labeled with the CXCR4 isotype control antibody (red traces).
Flow cytometric analysis of lymphocyte subsets. (A) Peripheral blood and leukapheresis products were prepared for flow cytometry as detailed in “Flow cytometric analysis” and lymphocyte subpopulations were identified as follows: Total B cells, CD20+, CD3−; total T cells, CD3+, CD20−; NK cells, CD3−,CD20−, CD8+; mDCs, CD3−, CD20−, CD8−, HLA-DR+, CD11c+, CD123−; pDC: CD3−, CD20−, CD8−, HLA-DR+, CD11c−, CD123+; IgG+ B cells, CD3−, CD20+, IgG+,IgM−; IgM+ B cells, CD3−, CD20+, IgG−, IgM+; CD4+ T cells, CD20−, CD3+, CD4+,CD8−; CD8+ T cells, CD20−, CD3+, CD4−,CD8+; naive T cells, Tn, CD28+,CD95− CD4 or CD8 T cells; central memory T cells, Tcm, CD28+,CD95+ CD4 or CD8 T cells; effector memory T cells, Tem, CD28−,CD95+ CD4 or CD8 T cells. Shown is a representative example of the following: First row: Lymphocyte gating based on forward- and side-scatter characteristics (left panel), subsequent CD3 versus CD20 gating (middle panel), subsequent CD4 versus CD8 gating (right panel). Second row: Subsequent IgG versus IgM gating (left panel) and subsequent CD95 versus CD28 gating (middle and right panels). Third row: mDC and pDC gating based on CD123 and CD11c. (B) Peripheral blood and leukapheresis products were prepared for flow cytometry. CD4+ Tregs were identified as CD3+,CD4+, CD25high, CD127low, FoxP3+ cells. Shown is a representative example of lymphocyte gating based on forward- and side-scatter characteristics (far left panel), subsequent identification of CD3+,CD4+ cells (second panel from the left), subsequent identification of CD25high, CD127low cells (third panel from the left), subsequent labeling with FoxP3 (red cells represent CD3+,CD4+, CD25high, CD127low cells labeled with FoxP3; and black cells, CD3+,CD4+, CD25high, CD127low cells labeled with the corresponding isotype control). The far right panel shows histogram analysis of FoxP3 fluorescence comparing FoxP3 labeling of putative Tregs (red), bulk CD4 cells (blue), or putative Treg cells labeled with the FoxP3 isotype control antibody (black). (C) Peripheral blood and leukapheresis products were prepared for flow cytometry as detailed in “Flow cytometric analysis,” and CXCR4 expression was determined for each subpopulation. Shown are representative histograms showing CXCR4 fluorescence for the individual cell populations (blue traces) compared with these cells labeled with the CXCR4 isotype control antibody (red traces).
Significant lymphocyte mobilization occurred only with AMD3100
To determine the impact of treatment with G-CSF, AMD3100, or G-CSF plus AMD3100, 9 animals were studied in 2 separate experiments. In each experiment, the animals were divided into 3 cohorts. Animals in cohort 1 (n = 3) were mobilized with G-CSF alone, animals in cohort 2 (n = 3) were mobilized with AMD3100 alone, and animals in cohort 3 (n = 3) were mobilized with G-CSF plus AMD3100. Blood was drawn both at baseline (2-5 weeks before cytokine treatment) and at 2, 4, and 6 hours after treatment with either the fifth dose of G-CSF or the single dose of AMD3100, as described in “Mobilization reqimen.” For animals treated with both G-CSF and AMD3100, blood was drawn at 2, 4, and 6 hours after both the fifth dose of G-CSF and the single dose of AMD3100, which were given together. Complete blood count and flow cytometric analysis were then performed by investigators who were blinded to the treatment group assignments. In the second independent experiment (n = 9), the animals in each cohort were shuffled to facilitate intra-animal experiments that controlled for animal-to-animal variability and to augment the statistical power of the study (see Figure 5).
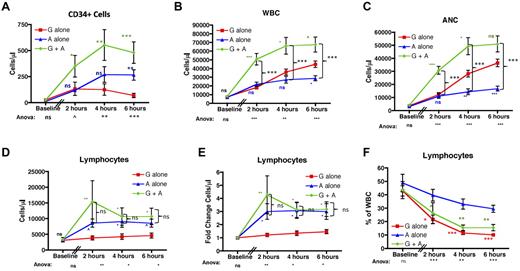
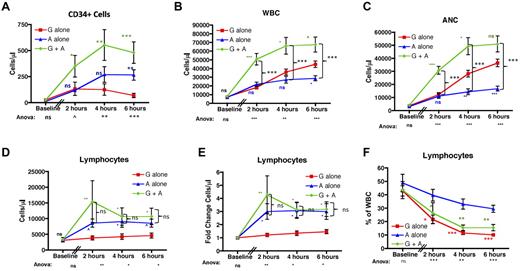
As expected12-14 and shown in Figure 2A, both G-CSF alone and AMD3100 alone caused significant mobilization of CD34+ cells into the peripheral blood. The combination of G-CSF plus AMD3100 (green traces) led to optimal mobilization, resulting in more CD34+ cells in the peripheral blood compared with G-CSF alone (red traces) or AMD3100 alone (blue traces) at all time points tested (P < .05 vs G-CSF alone at all time points). CD34+ mobilization with AMD3100 alone was significantly greater than in the G-CSF alone cohort only at 6 hours after AMD3100 treatment (P = not significant at 2 and 4 hours, and P < .01 at 6 hours after AMD3100, statistics shown in blue symbols). This result is similar to what was observed by Liles et al,32 in which a direct comparison of CD34+ mobilization with G-CSF or AMD3100 was performed, but differs from a comparison of 2 independent, noncontemporaneous studies33,34 in which the comparative results suggested that, in some situations, treatment with G-CSF alone34 may be more efficient at CD34+ mobilization than AMD3100 alone.33
AMD3100 leads to significant lymphocyte mobilization into the peripheral blood. (A) CD34 cells were quantified based on the number of CD45-FITC lymphocytes expressing CD34-PE per microliter of blood before (n = 3) and 2, 4, and 6 hours after mobilization (n = 6 for each time point). (B-F) The total peripheral blood WBC (B), ANC (C), lymphocyte count (D), fold change in the lymphocyte count (E), and the percentage of the whole blood accounted for by lymphocytes (F). (B-F) Data were collected at baseline and at 2, 4, and 6 hours after treatment with AMD3100 (n = 6 for each time point). Red squares represent mobilization with G-CSF alone; blue triangles, mobilization with AMD3100 alone; and green circles, mobilization with G-CSF + AMD3100. Error bars represent SEM. Statistical analysis was performed by pooling the data from 2 separate experiments in which groups of 3 animals each were treated with either G-CSF alone, AMD3100 alone, or G-CSF + AMD3100. Values obtained with AMD3100 alone, G-CSF alone, or G-CSF + AMD3100 at baseline and at 2, 4, and 6 hours after mobilization were log-transformed and then subjected to ANOVA and posthoc Tukey testing. ANOVA statistics comparing all 3 treatment groups are shown below the x-axis. (A-E) Posthoc Tukey statistics comparing AMD3100 alone with G-CSF alone (blue symbols), G-CSF + AMD3100 alone with G-CSF alone (green symbols), or G-CSF + AMD3100 with AMD3100 (black brackets) are shown. (F) Posthoc Tukey statistics comparing AMD3100 alone with G-CSF alone or AMD3100 alone with G-CSF + AMD3100 are shown in red or green symbols, respectively. ns indicates not significant (P > .1). ^P < .1. *P < .05. **P < .01. ***P < .001.
AMD3100 leads to significant lymphocyte mobilization into the peripheral blood. (A) CD34 cells were quantified based on the number of CD45-FITC lymphocytes expressing CD34-PE per microliter of blood before (n = 3) and 2, 4, and 6 hours after mobilization (n = 6 for each time point). (B-F) The total peripheral blood WBC (B), ANC (C), lymphocyte count (D), fold change in the lymphocyte count (E), and the percentage of the whole blood accounted for by lymphocytes (F). (B-F) Data were collected at baseline and at 2, 4, and 6 hours after treatment with AMD3100 (n = 6 for each time point). Red squares represent mobilization with G-CSF alone; blue triangles, mobilization with AMD3100 alone; and green circles, mobilization with G-CSF + AMD3100. Error bars represent SEM. Statistical analysis was performed by pooling the data from 2 separate experiments in which groups of 3 animals each were treated with either G-CSF alone, AMD3100 alone, or G-CSF + AMD3100. Values obtained with AMD3100 alone, G-CSF alone, or G-CSF + AMD3100 at baseline and at 2, 4, and 6 hours after mobilization were log-transformed and then subjected to ANOVA and posthoc Tukey testing. ANOVA statistics comparing all 3 treatment groups are shown below the x-axis. (A-E) Posthoc Tukey statistics comparing AMD3100 alone with G-CSF alone (blue symbols), G-CSF + AMD3100 alone with G-CSF alone (green symbols), or G-CSF + AMD3100 with AMD3100 (black brackets) are shown. (F) Posthoc Tukey statistics comparing AMD3100 alone with G-CSF alone or AMD3100 alone with G-CSF + AMD3100 are shown in red or green symbols, respectively. ns indicates not significant (P > .1). ^P < .1. *P < .05. **P < .01. ***P < .001.
Figure 2B through F demonstrates the divergent roles of G-CSF and AMD3100 with respect to WBC and granulocyte (absolute neutrophil count [ANC]) mobilization versus lymphocyte mobilization. As shown in Figure 2B and C, although treatment with either G-CSF alone or AMD3100 alone led to increases in total peripheral blood WBC (Figure 2B) and ANC (Figure 2C), the combination of both G-CSF plus AMD3100 led to even greater increases in WBC (up to 13-fold compared with baseline) and ANC (up to 43-fold compared with baseline). Figure 2B and C also documents that, similar to what has been observed in humans,32 there was a measurable increase in both ANC and (consequently) WBC within the first 6 hours after the fifth daily dose of G-CSF. Although G-CSF alone induced a more substantial increase in the ANC than AMD3100 alone (Figure 2C blue statistics symbols), combining G-CSF plus AMD3100 led to even greater increases in ANC than G-CSF alone (statistics shown in green symbols), suggesting that both cytokines were capable of efficiently mobilizing neutrophils.
In striking contrast, only AMD3100 demonstrated lymphocyte-mobilization activity. Thus, as shown in Figure 2D and E, G-CSF alone induced little or no mobilization of lymphocytes (with a mean fold increase of 1.5 ± 0.2-fold compared with baseline, Figure 2E). In contrast, both AMD3100 alone and G-CSF plus AMD3100 led to significant lymphocyte mobilization, which occurred within 2 hours of AMD3100 dosing, yielding a maximal fold increase in the absolute lymphocyte count of 11.2-fold and a mean of 3.6 ± 0.8-fold compared with baseline. Even using stringent posthoc statistical penalties for multiplexed analyses, lymphocyte mobilization was significantly greater with AMD3100 than with G-CSF alone at all time points analyzed (Figure 2E; P < .05 for both G-CSF plus AMD3100 and AMD3100 alone compared with G-CSF alone). Lymphocyte mobilization was AMD3100-specific: as shown in Figure 2D and E, combining G-CSF plus AMD3100 did not lead to statistically significant increases in lymphocyte mobilization compared with treatment with AMD3100 alone. Thus, the overarching effect of AMD3100 alone was (1) to significantly increase the peripheral blood WBC and (2) to significantly increase the peripheral blood ALC, with a less-pronounced effect on the ANC. The overarching effect of G-CSF plus AMD3100, on the other hand, was (1) to highly increase both the peripheral blood WBC and ANC (leading to statistically significant increases in both compared with AMD3100 alone; P < .001 for WBC and ANC for all time points tested) and (2) to significantly increase the ALC. Importantly, in contrast to the WBC and ANC, the increase in the ALC was not different when mobilization with AMD3100 alone was compared with mobilization with G-CSF plus AMD3100 (Figure 2D-E). The unique ability of AMD3100 to mobilize lymphocytes is underscored in Figure 2F. This figure compares the contribution of lymphocytes with the total WBC for all 3 treatment regimens. This figure highlights the significant drop in the proportion of lymphocytes in the WBC that occurred when G-CSF was included as a mobilization agent either alone (red traces) or in combination with AMD3100 (green traces). In contrast, animals treated with AMD3100 alone demonstrated a significantly more stable lymphocyte composition compared with both G-CSF alone (statistics shown in red symbols) and G-CSF plus AMD3100 (statistics shown in green symbols). AMD3100 had a similar effect on the proportion of total CD3+ and CD20+ in the peripheral blood, leading to a more stable CD3+ and CD20+ composition of the peripheral blood after mobilization (shown in supplemental Figure 1, available on the Blood Web site; see the Supplemental Materials link at the top of the online article).
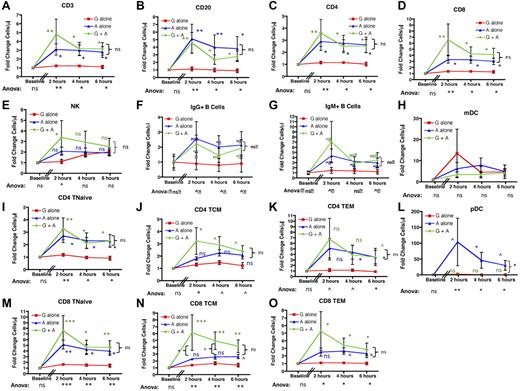
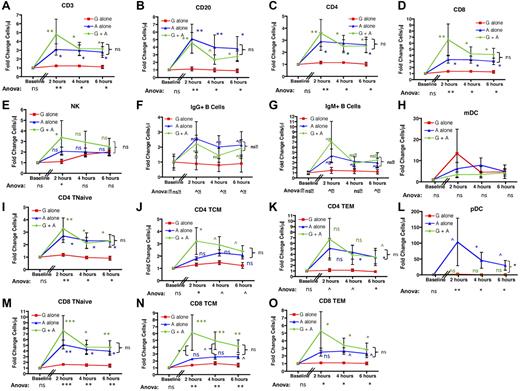
AMD3100-mediated mobilization of lymphocytes leads to pan-mobilization of B, T, and NK cells. When either absolute cell numbers were measured (not shown) or their fold increase over baseline was calculated (Figure 3), AMD3100 treatment led to mobilization of B-, T-, and NK-cell subpopulations into the peripheral blood. Thus, using ANOVA with posthoc Tukey testing to account for multiple simultaneous longitudinal analyses, significant differences were observed for the mobilization of total CD3+ T cells, total CD20+ B cells, total CD4+ T cells, and total CD8+ T cells between the 3 treatment regimens at all time points tested (Figure 3A-D). G-CSF plus AMD3100 also increased the peripheral blood content of NK cells, but this only reached statistical significance at the 2-hour time point (Figure 3E). As shown in the figure, all variance was accounted for by differences between AMD3100 alone versus G-CSF alone (blue statistics symbols) and G-CSF plus AMD3100 versus G-CSF alone (green statistics symbols) with no significant differences in T- and B-cell mobilization when AMD3100 alone was compared with G-CSF plus AMD3100 (P = not significant, bracketed black statistics). The mobilization of T, B, and NK cells was rapid, peaking at 2 hours after AMD3100 treatment, with T and B cells remaining elevated at both 4 and 6 hours after treatment. AMD3100 also led to mobilization of CD123+ pDCs. Thus, although the absolute numbers of these cells were too low to permit accurate statistical analysis of their absolute values (3.3 ± 1.4 cells/μL at 2 hours after AMD3100 treatment, not shown), fold change analysis was feasible and showed significant enrichment for pDCs in the peripheral blood, which peaked at 2 hours after cytokine exposure and remained elevated at both 4 and 6 hours (Figure 3L). This mobilization was not observed for mDCs (Figure 3H).
AMD3100 leads to rapid and significant mobilization of B- and T-cell subpopulations as well as NKs and pDCs into the peripheral blood. Data were collected at baseline (before mobilization) and 2, 4, and 6 hours after treatment with AMD3100 and are expressed as the fold change in cell number in the peripheral blood compared with baseline. Red squares represent mobilization with G-CSF alone (n = 6); blue triangles, mobilization with AMD3100 alone (n = 6); and green circles, mobilization with G-CSF + AMD3100 (n = 6). Error bars represent SEM. The data were pooled from 2 separate experiments. In each experiment, groups of 3 animals each were treated with AMD3100, G-CSF, or G-CSF + AMD3100, and data at baseline and at 2, 4, and 6 hours after mobilization were log-transformed and then subjected to ANOVA and posthoc Tukey testing. ANOVA statistics comparing all 3 treatment groups are shown below the x-axis. Posthoc Tukey statistics comparing AMD3100 with G-CSF (blue symbols), G-CSF + AMD3100 with G-CSF alone (green symbols), or G-CSF + AMD3100 with AMD3100 (black brackets) are shown for each time point. ns indicates not significant (P > .1). ^P < .1. *P < .05. **P < .01. ***P < .001.
AMD3100 leads to rapid and significant mobilization of B- and T-cell subpopulations as well as NKs and pDCs into the peripheral blood. Data were collected at baseline (before mobilization) and 2, 4, and 6 hours after treatment with AMD3100 and are expressed as the fold change in cell number in the peripheral blood compared with baseline. Red squares represent mobilization with G-CSF alone (n = 6); blue triangles, mobilization with AMD3100 alone (n = 6); and green circles, mobilization with G-CSF + AMD3100 (n = 6). Error bars represent SEM. The data were pooled from 2 separate experiments. In each experiment, groups of 3 animals each were treated with AMD3100, G-CSF, or G-CSF + AMD3100, and data at baseline and at 2, 4, and 6 hours after mobilization were log-transformed and then subjected to ANOVA and posthoc Tukey testing. ANOVA statistics comparing all 3 treatment groups are shown below the x-axis. Posthoc Tukey statistics comparing AMD3100 with G-CSF (blue symbols), G-CSF + AMD3100 with G-CSF alone (green symbols), or G-CSF + AMD3100 with AMD3100 (black brackets) are shown for each time point. ns indicates not significant (P > .1). ^P < .1. *P < .05. **P < .01. ***P < .001.
Further characterization of IgM+ and IgG+ B-cell subsets and CD4 and CD8 T-cell subpopulations demonstrated broad lymphocyte mobilization with AMD3100 (Figure 3F-G,I-K,M-O). Thus, although no enrichment of individual naïve or memory subpopulations relative to total T cells occurred after cytokine treatment (supplemental Figure 1), our analysis indicated AMD3100-mediated pan-mobilization of all T- and B-cell subpopulations. ANOVA documented statistically significant differences between the 3 mobilization regimens, and individual comparisons indicated that the variance was entirely accounted for by differences between AMD3100 alone versus G-CSF alone or by G-CSF plus AMD3100 versus G-CSF alone, with the greatest differences observed when G-CSF plus AMD3100 was compared with G-CSF alone (Figure 3F-G,I-K,M-O). Although AMD3100 alone also led to increased mobilization of T and B subpopulations, the differences between AMD3100 alone and G-CSF alone were most prominent (and statistically significant) for CD4 Tn, CD4 Tem, and CD8 Tn. It should be noted that, as corroborated by the paired analysis (see Figure 5), there was likely a biologic difference between AMD3100 alone and G-CSF alone for all lymphocyte populations tested, despite the fact that for some subpopulations there was inadequate power to attain statistical significance using posthoc Tukey tests.
AMD3100 leads to mobilization of Tregs into the peripheral blood
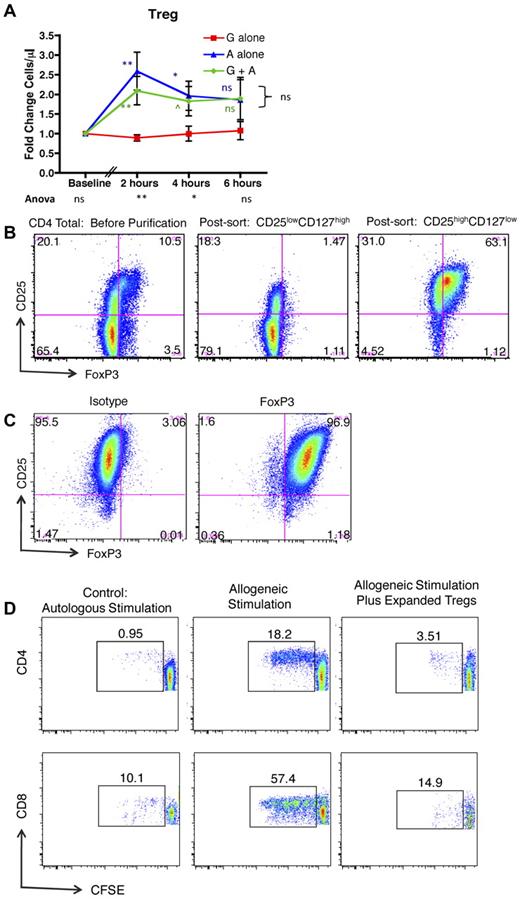
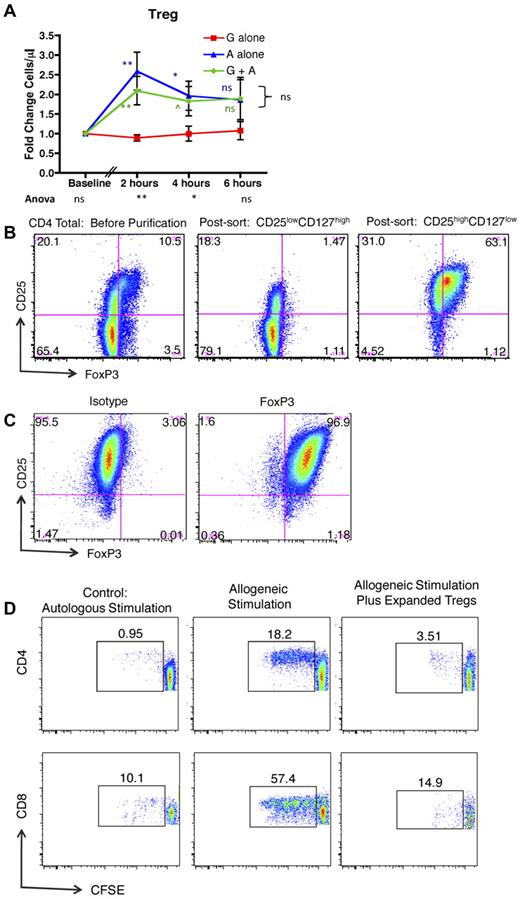
Figure 4A shows that, in addition to mobilizing conventional T cells, exposure to AMD3100 alone or G-CSF plus AMD3100 led to significantly more mobilization of CD4+/CD25high/CD127low/FoxP3+ Tregs compared with G-CSF alone. Mobilization of these cells peaked early after exposure to AMD3100, which led to statistically significantly increases in peripheral blood Treg numbers compared with recipients treated with G-CSF alone at 2 hours and 4 hours, but not 6 hours after treatment (green and blue statistics symbols). The mobilized Tregs were functionally suppressive. Thus, when the mobilized CD4+/CD25high/CD127low cells were purified (Figure 4B) and expanded in vitro (Figure 4C), they were capable of suppressing alloproliferation as measured by an established CFSE MLR assay26 (Figure 4D).
AMD3100 leads to rapid and significant mobilization of Tregs into the peripheral blood. (A) Fold change in Tregs in the peripheral blood compared with baseline in animals treated with G-CSF, AMD3100, or G-CSF + AMD3100. Data were collected at baseline (before mobilization) and 2, 4, and 6 hours after treatment with AMD3100. Red squares represent G-CSF alone (n = 6); blue triangles, AMD3100 alone (n = 6); and green circles, G-CSF + AMD3100 (n = 6). Error bars represent SEM. The statistical analysis was performed as described in Figure 3. ns indicates not significant (P > .1). ^P < .1. *P < .05. **P < .01. ***P < .001. (B) Column-purified CD4+ T cells (left panel), flow-sorted putative non-Tregs (CD4+, CD25low, CD127high, middle panel), and flow-sorted putative Tregs (CD4+, CD25high, CD127low, right panel) were stained for CD4, CD25, and intracellular FoxP3, documenting that the putative Treg population (right panel) stained highly positive for FoxP3. (C) Expanded Tregs were stained for CD4, CD25, and either FoxP3 (right) or its corresponding isotype control (left). (D) CFSE MLR assay gated on either CD4+ T cells (top row) or CD8+ T cells (bottom row) in which the percentage of CFSE-labeled responder cells that have undergone at least one round of proliferation was quantified using FlowJo Version 9.3.1 flow cytometric analysis software. Left column: Responder PBMCs plus irradiated autologous PBMC stimulator cells. Middle column: Responder PBMCs plus irradiated allogeneic PBMC stimulator cells. Right column: Responder PBMCs plus irradiated allogeneic PBMC stimulator cells, plus CD3+, CD4+, CD25high, CD127low, FoxP3+ Tregs.
AMD3100 leads to rapid and significant mobilization of Tregs into the peripheral blood. (A) Fold change in Tregs in the peripheral blood compared with baseline in animals treated with G-CSF, AMD3100, or G-CSF + AMD3100. Data were collected at baseline (before mobilization) and 2, 4, and 6 hours after treatment with AMD3100. Red squares represent G-CSF alone (n = 6); blue triangles, AMD3100 alone (n = 6); and green circles, G-CSF + AMD3100 (n = 6). Error bars represent SEM. The statistical analysis was performed as described in Figure 3. ns indicates not significant (P > .1). ^P < .1. *P < .05. **P < .01. ***P < .001. (B) Column-purified CD4+ T cells (left panel), flow-sorted putative non-Tregs (CD4+, CD25low, CD127high, middle panel), and flow-sorted putative Tregs (CD4+, CD25high, CD127low, right panel) were stained for CD4, CD25, and intracellular FoxP3, documenting that the putative Treg population (right panel) stained highly positive for FoxP3. (C) Expanded Tregs were stained for CD4, CD25, and either FoxP3 (right) or its corresponding isotype control (left). (D) CFSE MLR assay gated on either CD4+ T cells (top row) or CD8+ T cells (bottom row) in which the percentage of CFSE-labeled responder cells that have undergone at least one round of proliferation was quantified using FlowJo Version 9.3.1 flow cytometric analysis software. Left column: Responder PBMCs plus irradiated autologous PBMC stimulator cells. Middle column: Responder PBMCs plus irradiated allogeneic PBMC stimulator cells. Right column: Responder PBMCs plus irradiated allogeneic PBMC stimulator cells, plus CD3+, CD4+, CD25high, CD127low, FoxP3+ Tregs.
Analysis of individual animals' response to AMD3100 and G-CSF confirmed AMD3100-specific pan-lymphocyte mobilization
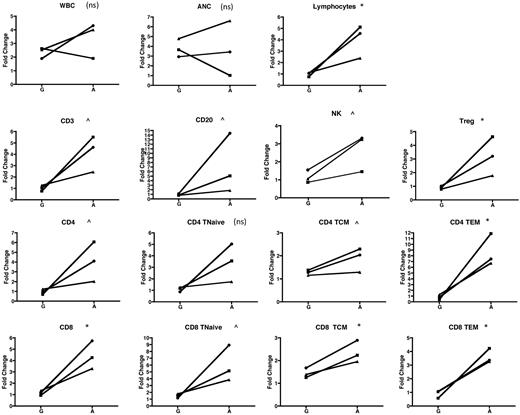
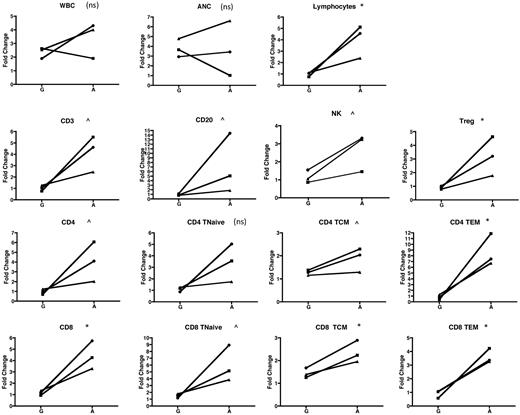
In addition to the cohort analysis documented in Figures 2 to 4, our experimental design permitted comparison of the mobilization of lymphocyte subsets in individual animals exposed to G-CSF alone and then subsequently to AMD3100 alone. This intra-animal comparison added statistical power to the study and strengthened the conclusion that mobilization of both conventional and regulatory lymphocytes was AMD3100-specific. Thus, Figure 5 compares the fold increase in the peripheral blood over baseline for multiple parameters, measured 2 hours after cytokine treatment, in animals that were treated first with G-CSF alone, and then, 2 months later, were treated with AMD3100 alone. Figure 5 confirms that, with the exception of CD4Tn (for which the difference between G-CSF and AMD3100 was not significant), the fold increase of all other lymphocyte populations, including Tregs, was higher when animals were treated with AMD3100 than when they were treated with G-CSF.
Individual animal comparison of lymphocyte mobilization with G-CSF alone versus AMD3100 alone. Three animals were mobilized with G-CSF and then, 2 months later, were mobilized with AMD3100. The fold change at 2 hours for each population was compared with baseline (precytokine treatment) and is shown for each of the animals and for the 2 mobilization regimens. Squares represent animal 1; circles, animal 2; and triangles, animal 3. Values obtained were log-transformed and compared using a paired t test. ns indicates not significant (P > .1). ^P < .1. *P < .05. **P < .01. ***P < .001.
Individual animal comparison of lymphocyte mobilization with G-CSF alone versus AMD3100 alone. Three animals were mobilized with G-CSF and then, 2 months later, were mobilized with AMD3100. The fold change at 2 hours for each population was compared with baseline (precytokine treatment) and is shown for each of the animals and for the 2 mobilization regimens. Squares represent animal 1; circles, animal 2; and triangles, animal 3. Values obtained were log-transformed and compared using a paired t test. ns indicates not significant (P > .1). ^P < .1. *P < .05. **P < .01. ***P < .001.
AMD3100 leads to accumulation of both conventional and regulatory T-cell populations in the leukapheresis product
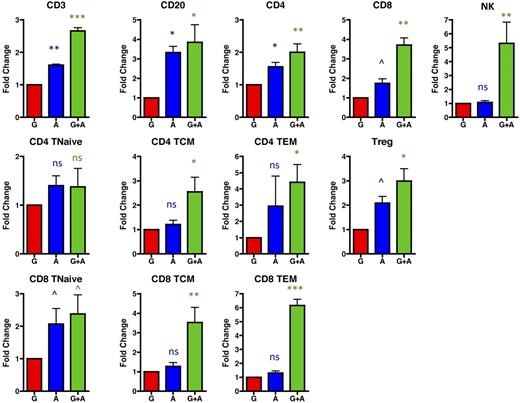
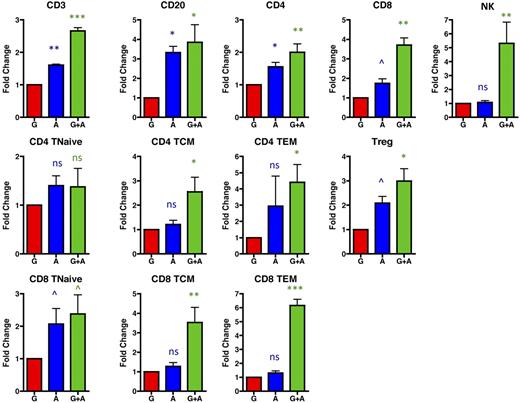
Although mobilization into the peripheral blood is required for collection of both stem cells and lymphocytes into leukapheresis products, given that leukapheresis occurs through cell density-based differential centrifugation, peripheral blood mobilization alone cannot predict ultimate collection into the leukapheresis product. We thus determined the absolute numbers (supplemental Figure 2) and fold increase (Figure 6) of lymphocyte mobilization into leukapheresis products after mobilization with G-CSF alone, AMD3100 alone, and G-CSF plus AMD3100 (Figure 6). As shown in this figure, AMD3100 alone (blue symbols) and, most prominently, G-CSF plus AMD3100 (green symbols) led to leukapheresis products with a significant enrichment for lymphocyte subpopulations compared with leukapheresis products resulting from mobilization with G-CSF alone (red symbols). Thus, G-CSF plus AMD3100 mobilized significantly more CD3 T cells, CD20 B cells, and NK cells than G-CSF alone (Figure 6). CD8 cells (both total CD8 and individual CD8 subpopulations) were, in general, mobilized to a greater extent into the leukapheresis products than CD4 cell subpopulations, especially after treatment with both G-CSF plus AMD3100. Thus, leukapheresis products resulting from G-CSF plus AMD3100 mobilization had 3.7 ± 0.4-fold more total CD8 T cells (P < .01), 2.4 plus or minus 0.6-fold more CD8 Tn (P < .1), 3.5 ± 0.8-fold more CD8 Tcm (P < .01), and 6.2 ± 0.4-fold more CD8 Tem (P < .001) than products resulting from G-CSF mobilization alone (Figure 6). These same products demonstrated an average of 2.0 ± 0.3-fold more total CD4 T cells (P < .01), 1.4 ± 0.4-fold more CD4 Tn (not significantly different from G-CSF alone), 2.6 ± 0.6-fold more CD4 Tcm (P < .05), and 4.4 ± 1.0-fold more CD4 Tem (P < .05) compared with products resulting from G-CSF mobilization alone. Importantly, treatment with AMD3100 (either alone or in conjunction with G-CSF) led to up to 4.0-fold more Tregs in the leukapheresis product compared with G-CSF alone (average of 3.0 ± 0.5, Figure 6, P < .05).
G-CSF + AMD3100 yields leukapheresis products with a higher content of both conventional and regulatory T-cell populations compared with those resulting from treatment with G-CSF alone. The fold change of the lymphocyte populations was determined by comparing the absolute numbers mobilized with G-CSF alone (red, averaged and normalized to 1) with the absolute numbers of these cells mobilized into the apheresis products with either AMD3100 alone (blue) or G-CSF plus AMD3100 (green). Values were log-transformed and compared with the corresponding values obtained with G-CSF alone using the Student t test. ns indicates not significant (P > .1). ^P < .1. *P < .05. **P < .01. ***P < .001.
G-CSF + AMD3100 yields leukapheresis products with a higher content of both conventional and regulatory T-cell populations compared with those resulting from treatment with G-CSF alone. The fold change of the lymphocyte populations was determined by comparing the absolute numbers mobilized with G-CSF alone (red, averaged and normalized to 1) with the absolute numbers of these cells mobilized into the apheresis products with either AMD3100 alone (blue) or G-CSF plus AMD3100 (green). Values were log-transformed and compared with the corresponding values obtained with G-CSF alone using the Student t test. ns indicates not significant (P > .1). ^P < .1. *P < .05. **P < .01. ***P < .001.
Discussion
The FDA approval of Plerixafor or Mozobil as a mobilization agent represents an important clinical advance with clear applicability for autologous transplantation. Rigorous studies, however, are still necessary to determine the impact that this agent may have on strategies for large-scale purification and preparation of targeted cell populations for adoptive transfer, on patient outcomes after allo-HSCT, as well as on possible differences in the time course for AMD3100-mediated lymphocyte versus CD34+ stem cell mobilization. In this study, we have used the rhesus macaque model of mobilization and leukapheresis to measure the impact of AMD3100 on the tempo and extent of mobilization of lymphocyte subpopulations into the peripheral blood and on the lymphocyte content of leukapheresis products. The rhesus macaque model was chosen for these studies given its relative ease of manipulation compared with human studies and because it is well established for the study of auto- and allo-HSCT after leukapheresis.18-22,35 The robust genetic,36,37 phenotypic, and functional similarities25,38 between the macaque and human immune systems have made it a preferred model for the study of both transplant immunology20-22,38,39 and of protective immunity and infectious disease.40,41 Our results with this model document rapid, significant lymphocyte mobilization with AMD3100, which included mobilization of multiple subpopulations, including B cells, NK cells, both CD4 and CD8 T cells, and their Tn, Tcm, and Tem subpopulations. In contrast, G-CSF treatment alone led to no B-, T-, or NK-cell mobilization, despite significant increases in peripheral blood WBC and ANC. In addition to the mobilization of conventional T-cell populations, FoxP3+ regulatory cells were also significantly mobilized into the peripheral blood after treatment with AMD3100, demonstrating as much as a 4-fold increase in the peripheral blood within 2 hours of drug exposure. The increased lymphocyte content in the peripheral blood induced by AMD3100 translated into higher numbers of lymphocytes in the harvested leukapheresis product, with animals receiving G-CSF plus AMD3100 yielding leukapheresis products with significantly higher lymphocyte content than those treated with G-CSF alone. The enhanced lymphocyte harvest included effector T cells, as well as T-cell subpopulations (Treg and Tem) with putative GVHD-protective properties.
Our results are consistent with the hypothesis that both B and T lymphocytes use the CXCR4/CXCL12 axis to home to anatomic niches and that, when inhibited, these cells are able to leave their respective niches and accumulate in the peripheral blood. Although these studies have not identified which locations play the major role in the movement of lymphocyte populations into the blood, previous studies have documented CXCL12/CXCR4-mediated lymphocyte homing in the bone marrow, lymph nodes, high endothelial venules, small blood vessels, thymus, and gastrointestinal tract.42-45 The rapidity of the T- and B-cell mobilization that we observed suggests that lymphocytes may become rapidly demarginated from endothelial anchors and that there may be a readily available lymphocyte reservoir that is closely associated with the endothelium, similar to what has been documented with granulocytes.
The identification of lymphocyte homing sites that are amenable to AMD3100-mediated mobilization could have significance in multiple clinical scenarios. These sites could be targeted as sanctuary sites for malignant lymphomas, in a fashion similar to the ongoing studies exploring the utility of CXCR4 antagonism to mobilize chemorefractory leukemic stem cells from the bone marrow during chemotherapy or as a part of pretransplantation preparation.46,47 The rapid mobilization of lymphocytes that we observed may also have significance for solid organ transplant. Mobilization of T cells from intraorgan endothelial or nodal niches could be exploited during transplantation of organs that pose a risk of GVHD (liver, small bowel)48 to induce the clearance of pathogenic T cells before their transplantation. Furthermore, in patients who develop GVHD, treatment with AMD3100 may be a useful adjunct to photopheresis-based treatment strategies by mobilizing T cells from their anatomic niches and exposing these previously sequestered cells to photopheresis-mediated apoptosis.49 Finally, the observation that AMD3100 leads to mobilization of significant numbers of Tregs into both the peripheral blood and into apheresis products is compelling. Currently, protocols that use Tregs as a cellular therapeutic are limited by the rarity of this cell population in the peripheral blood and the resulting difficulty in purifying sufficient quantities for subsequent clinical use.50 Our results suggest that mobilization with AMD3100 may be an efficient strategy to increase the yield of these and other clinically relevant lymphocyte populations before ex vivo expansion for adoptive cellular therapeutics.
These observations also suggest a possible mechanism for the surprising observation made by Devine et al in the first pilot study of AMD3100-mobilzed allo-HSCT,16 in which patients receiving AMD3100-mobilized products demonstrated rates of GVHD that were not significantly different from historical controls who received G-CSF–mobilized PBSCs, despite that more T cells were transplanted with AMD3100 mobilization. Given the significant mobilization of Tem51 and Tregs that occurred with AMD3100, leukapheresis products resulting from AMD3100-containing mobilization may possess a proregulatory balance of lymphocytes, which could protect against GVHD despite higher total T-cell numbers in the allograft.16 The results reported here are the first to determine that G-CSF plus AMD3100 results in leukapheresis products with a high content of these putative GVHD-protective populations, supporting further investigation of G-CSF plus AMD3100-mobilized products during allo-HSCT. Moreover, given that both Tregs and Tem have been shown to permit protective immune responses, including GVL effects,51,52 G-CSF plus AMD3100-mobilized products may result in a globally favorable risk/benefit balance during HSCT. These results suggest that a rigorous comparison of mobilization with G-CSF alone, AMD3100 alone, and G-CSF plus AMD3100 before allo-HSCT may be warranted to most accurately determine the relative risks of GVHD, immune reconstitution, and relapse in patients receiving each type of mobilized stem cell product.
An Inside Blood analysis of this article appears at the front of this issue.
The publication costs of this article were defrayed in part by page charge payment. Therefore, and solely to indicate this fact, this article is hereby marked “advertisement” in accordance with 18 USC section 1734.
Acknowledgments
The authors thank the staff at 5 Research Court at the National Heart, Lung, and Blood Institute and at the Yerkes National Primate Research Center for their excellent care and handling of the rhesus macaques.
This work was supported by the intramural research program of the National Heart, Lung, and Blood Institute and the Yerkes National Primate Research Center (Base Grant RR00165). L.S.K. was supported by (grants 2U19 AI051731, 1 R01 HL095791, and 2U24 RR018109) and Burroughs Wellcome Fund (Career Award in the Biomedical Sciences). R.E.D., A.C.B., and M.E.M. were supported by the intramural research program of the National Heart, Lung, and Blood Institute. J.J.M. was supported by the National Institute of Dental and Craniofacial Research (DE018339 and DE019397).
National Institutes of Health
Wellcome Trust
Authorship
Contribution: L.S.K. and R.E.D. conceived the project, designed experiments, analyzed data, and wrote the paper; S.S., O.O., K.S., L.S., A.C.B., and M.E.M. performed research; J.R. analyzed data; D.E.L.P. designed and performed statistical analysis; and J.J.M. designed experiments, analyzed data, and wrote the paper.
Conflict-of-interest disclosure: The authors declare no competing financial interests.
Correspondence: Leslie S. Kean, Department of Pediatrics, Children's Healthcare of Atlanta and the Emory Transplant Center, Department of Surgery, Emory University School of Medicine, 5203 WMB, 101 Woodruff Circle NE, Atlanta, GA 30322; e-mail: Leslie.kean@oz.ped.emory.edu.

