Abstract
Genomic alterations play a crucial role in the development and progression of diffuse large B-cell lymphomas (DLBCLs). We determined gene copy number alterations (GCNAs) of TP53, CDKN2A, CDKN1B, BCL2, MYC, REL, and RB1 with a single polymerase chain reaction (PCR) assay (quantitative multiplex PCR of short fragments [QMPSF]) in a cohort of 114 patients with DLBCL to assess their prognostic value and relationship with the gene expression profile. Losses of TP53 and CDKN2A, observed in 8% and 35% of patients, respectively, were significantly associated with a shorter survival after rituximab, cyclophosphamide, doxorubicin, vincristine, and prednisone (R-CHOP) treatment, independently of the International Prognostic Index and of the cell of origin. Analysis of the 9p21 genomic region indicated that transcripts encoding p14ARF and p16INK4A were both disrupted in most patients with CDKN2A deletion. These patients predominantly had an activated B-cell profile and showed a specific gene expression signature, characterized by dysregulation of the RB/E2F pathway, activation of cellular metabolism, and decreased immune and inflammatory responses. These features may constitute the molecular basis sustaining the unfavorable outcome and chemoresistance of this DLBCL subgroup. Detection of TP53 and CDKN2A loss by QMPSF is a powerful tool that could be used for patient stratification in future clinical trials.
Introduction
Diffuse large B-cell lymphoma (DLBCL) is a heterogeneous disease at the molecular level. Gene expression profiling (GEP) has identified different molecular DLBCL subtypes related to the cell of origin, the tumor microenvironment, or activated biochemical pathways with strong clinical significance.1,2 The genomic alterations of these subtypes have been partially described by conventional cytogenetics and comparative genomic hybridization (CGH). The germinal center B-cell (GCB) DLBCL subtype, which exhibits transcriptional features of normal GCBs, is characterized by recurrent t(14;18) translocations, trisomy 12, PTEN deletions, and frequent REL gains.3-5 The activated B-cell (ABC) DLBCL subtype has a gene expression signature reminiscent of post–germinal center cells blocked at a preplasmacytic stage and display more frequent t(3;14) translocations, trisomy 3, 18q21 gains, 6q deletions, CDKN2A deletions, and multiple genomic alterations of genes involved in the antiapoptotic nuclear factor-κB (NF-κB) signaling pathway.3-6 Thus, gene copy number abnormalities (GCNAs) and immunoglobulin gene–derived translocations, such as t(3;14) or t(14;18), represent crucial events that delineate distinct oncogenic pathways in specific DLBCL subgroups and bear potential prognostic value.7,8
The addition of rituximab (R) to anthracycline-based chemotherapy regimens such as cyclophosphamide, doxorubicin, vincristine, and prednisone (CHOP) has greatly improved the overall survival (OS) of patients with DLBCL. It has been recently shown that patients with GCB DLBCL have longer OS and event-free survival (EFS) compared with patients with an ABC phenotype in the R-CHOP era.9,10 However, it remains unclear whether recurrent GCNA with prognosis significance in CHOP-treated patients, such as BCL2 gains or CDKN2A or TP53 deletions, still affect the clinical outcome in this therapeutic setting.
To routinely detect GCNA, we recently developed an inexpensive and sensitive method for the detection of genomic deletions or duplications based on the simultaneous amplification of short genomic fragments (known as multiplex PCR of short fluorescent fragments [QMPSF]).11 We previously demonstrated its applicability to the analysis of various hematologic neoplasms, including chronic lymphocytic leukemia (CLL), DLBCL, mantle cell lymphoma (MCL), and CD4+CD56+ hematodermic neoplasms.12-15 We also assessed its prognostic relevance and its feasibility using formalin-fixed paraffin-embedded (FFPE) tissues in MCL.13
Here, we assess the prognostic value of GCNA (TP53, CDKN2A, REL, BCL2, MYC, and RB1) detected by QMPSF in DLBCL, in a setting of clinical trials based on the use of R-CHOP or R-CHOP–like regimens. Furthermore, we performed an analysis that combined GCNA and GEP data to delineate the molecular pathways related to recurrent and clinically relevant GCNA. Using this approach, we define a subgroup of DLBCL characterized by CDKN2A deletion, a specific gene expression profile, and a poor prognosis.
Methods
Patients and tumor samples
A total of 114 patients with available frozen lymphoma samples were included in this study. Of these, 63 patients were enrolled in the LNH98-5 trial from the Groupe d'Etude des Lymphomes de l'Adulte (GELA), which published the clinical and biologic features of these patients.16 A total of 19 patients were included in other ongoing GELA trials. In addition, 32 patients who received either CHOP or R-CHOP treatment in various GELA Centers (Saint-Louis/Paris, Créteil, Lyon, Nancy, or Rouen) were included in this study. Overall, 36 patients were treated by CHOP or CHOP-like regimens, and 78 patients received R-CHOP/R-CHOP–like regimens. According to the 2008 World Health Organization (WHO) classification, 109 cases were classified as DLBCL not otherwise specified (NOS), 4 cases as T-cell/histiocyte-rich large B-cell lymphomas, and 1 case as intravascular large B-cell lymphoma. No primary mediastinal B-cell lymphoma (PMBCL) was included in this study. Tumor infiltration of the frozen samples was checked on Hemalun Eosin Safran staining of tissue sections. Main clinical features of patients with DLBCL are indicated in Table 1, and detailed characteristics of each individual case are provided in supplemental Table 1 (available on the Blood Web site; see the Supplemental Materials link at the top of the online article).
Patients gave their informed consent in accordance with the Declaration of Helsinki, and the study was approved by the GELA scientific committee and the institutional review board “Comité de Protection des Personnes Ile de France IX.”
QMPSF assay design
QMPSF is based on the simultaneous amplification of short genomic fragments using dye-labeled primers under quantitative conditions (patent no. FR 020924).11,17 For this study, we specifically designed a single QMPSF assay that allows the simultaneous analysis of 4 tumor suppressor genes (TSGs; CDKN2A, CDKN1B, TP53, RB1), 3 oncogenes (BCL2, REL, MYC), a candidate gene located on chromosome 6q (SIM1), and 2 endogenous controls (CECR1 and SEMA4F). The QMPSF ratios used in this study to detect deletions and gains (set to 0.7 and 1.2, respectively) were previously established after dilution experiments or correlation with CGH array.12,13 A QMPSF ratio less than 0.5 was interpreted as indicative of homozygous deletion.
Tumor DNA extraction and PCR assays were performed according to previously reported experimental conditions.12 In addition, we used 2 assays to analyze the 9p21 genomic region (CDKN2A/CDKN2B) and the 17p13 genomic region (TP53) in more detail. Briefly, the 9p21 dedicated assay contained 9 primer pairs covering a 2.8-Mb region and 5 genes (MIR31/MTAP/CDKN2A/CDKN2B/DMRTA1).13 Of note, 1 primer set located within CDKN2A exon 1α was common with the first QMPSF assay. PCR assays were performed according to reported experimental procedures.12,13 Cases with CDKN2A and/or CDKN2B deletions were referred to as DLBCL9p21del.
The 17p13 assay contained 10 primer pairs that covered exon 1 to exon 10 of TP53 (supplemental Table 2). In concordance with the multigene QMPSF assay, the mean of QMPSF ratios for the 10 target exons was calculated, and a result less than 0.7 was interpreted as indicative of a deletion.
Transcriptome analysis and quantitative RT-PCR by TLDA
Of these 114 DLBCL samples, 52 samples had previously been analyzed with a HU133A Affymetrix GeneChip arrays (Affymetrix). The chips were scanned with an Affymetrix GeneChip Scanner 3000 and subsequent images were analyzed using GCOS 1.4. Raw feature data were normalized and log2 intensity expression summary values for each probe set were calculated using robust multiarray average (RMA package affy V1.4.32). Probe sets corresponding to control genes or having a “_x_” annotation were masked, yielding a total of 19 787 probe sets for further analyses. The microarray data were deposited in the Array Express public database (accession no. E-TABM-346).10
Quantitative reverse transcription–PCR (RT-QPCR) was performed in 36 DLBCL samples not previously studied by array-based GEP as previously described.10 A custom microfluidic card was designed to analyze the expression of 17 genes associated with ABC/GCB classification, 7 genes showing prognostic value in our previous studies, and 21 genes extracted from the 9p21 locus deletion signature.10,18 This last set of genes included CDKN2A and CDKN2B mapping to this locus, and 19 genes selected on the basis of the supervised transcriptome analysis performed in the training group of 52 patients. Genes were selected according to their significant differential expression and/or their putative involvement in molecular pathways as suggested by GEP analysis (supplemental Table 3). A total of 3 housekeeping genes (18S, PGK1, and TBP) were included in the experiments.10
Statistical analysis
All analyses were performed with the R system software (v2.7) and Bioconductor (v2.0).19 Supervised analyses on microarray and RT-QPCR data were performed according to the presence or absence of GCNAs involving BCL2, TP53, CDKN2A, REL, or MYC. Affymetrix probe sets retained for these analyses were filtrated to keep only those expressed with sufficient level of expression and sample variability, defined, respectively by a median greater than 5 and a trimmed range (calculated by excluding the extreme values) greater than 1 (corresponding to 4773 probe sets). Differentially expressed probe sets between the 2 groups (with or without GCNA) were determined by t tests with robust variance estimation as implemented in the LIMMA package.20 False discovery rates (FDRs) were then computed to take into account test multiplicity.21 Differential gene expression t tests with a FDR less than 0.05 were considered statistically significant. Hierarchic clusterings were performed by the Ward agglomeration algorithm. The gene expression profile observed in DLBCL9p21del cases was analyzed using 2 statistical enrichment analyses: (1) global differences in biologic processes and signaling pathways between DLBCL9p21del cases and others were studied with the Goeman Globaltest approach using biologic pathways provided by the Molecular Signatures Database (MSigDB) and molecular signatures from the lymphoma literature;22,23 (2) functional analysis to identify the most relevant biologic mechanisms, pathways, and functional categories in the datasets of genes selected by statistical analysis were generated through the use of Ingenuity Pathways Analysis (IPA 6.5 software; Ingenuity Systems).
The GCB/ABC phenotype was determined in 91 patients as previously described according to the expression of 17 genes derived from the Wright predictor for cell of origin (COO) and assessed by Affymetrix U133A array or TaqMan low-density array (TLDA).10,18
Qualitative data were compared using the X2 test or the Fisher exact test when appropriate. EFS was defined as the time interval between the first chemotherapy cycle and death during induction treatment, disease progression or relapse, or death from any cause. OS was calculated from the first chemotherapy cycle until death from any cause. Survival curves were computed by the Kaplan-Meier method and compared by the log-rank test. Cox regression models were performed to evaluate the prognostic significance of GCNAs in a multivariate setting. Interactions between GCNAs and the treatment arms were also tested to determine a differential effect between CHOP and R-CHOP patients.
GEP obtained in our series were compared with an independent dataset of mRNA expression obtained using a similar expression microarray technology (Affymetrix U133plus2) and available from the Gene Expression Omnibus of the National Center for Biotechnology Information through GEO accession number GSE11318.24 The Fisher combined P value approach was used to decipher common signatures between the 2 datasets.25
Results
GCNA frequencies detected by the QMPSF assay
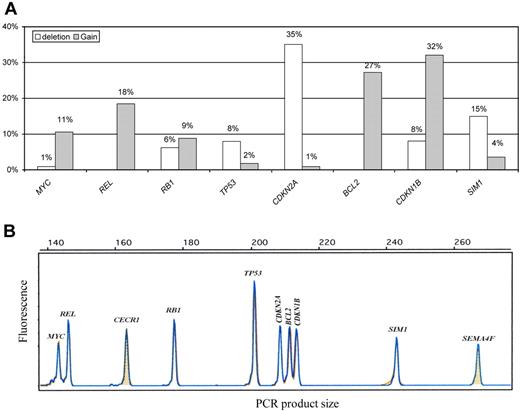
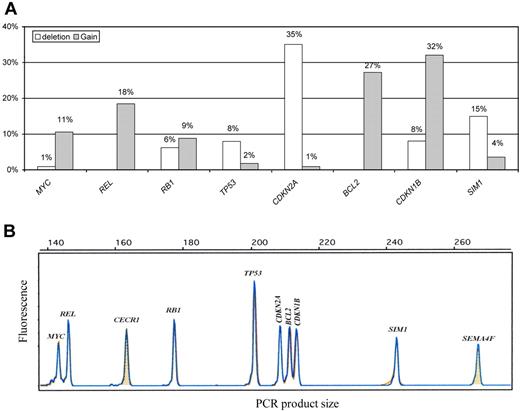
GCNA distribution as detected by the single QMPSF assay in the entire DLBCL population is shown in Figure 1. The most frequent gains involved CDKN1B (32%), BCL2 (27%), and REL (18%), whereas the most frequent deletion involved CDKN2A (35%). Some genes were almost exclusively deleted (CDKN2A and TP53) or exclusively gained (MYC, BCL2, and REL). In contrast, RB1 was either gained or lost. Details of the GCNA distribution for each DLBCL case are shown in supplemental Table 1. Interestingly, we observed significant associations between distinct GCNAs. The presence of a CDKN2A deletion was statistically related to BCL2 gain (21 [52%] of 40 patients with CDKN2A deletions displayed BCL2 gains; P < .001), TP53 loss (7 [17%] of 40 patients; P = .01), and SIM1 loss (11 [27%] of 40 patients; P = .01). Furthermore, we observed an association between MYC and REL gains (8 [75%] of 12 patients with MYC gain displayed concomitant REL gains; P < .001).
QMPSF assay in DLBCL. (A) Gene copy number abnormality distribution in diffuse large B-cell lymphoma (DLBCL; n = 114). (B) Example of an electropherogam obtained from the quantitative multiplex PCR of short fragments (QMPSF) assay. Tumor and normal QMPSF electropherograms are indicated in blue and orange, respectively. Amplicons are identified according to their expected sizes (x-axis). The heights of the peak (fluorescence; y-axis) are proportional to the amount of corresponding target DNA.
QMPSF assay in DLBCL. (A) Gene copy number abnormality distribution in diffuse large B-cell lymphoma (DLBCL; n = 114). (B) Example of an electropherogam obtained from the quantitative multiplex PCR of short fragments (QMPSF) assay. Tumor and normal QMPSF electropherograms are indicated in blue and orange, respectively. Amplicons are identified according to their expected sizes (x-axis). The heights of the peak (fluorescence; y-axis) are proportional to the amount of corresponding target DNA.
Correlation between GCNA status and the GCB/ABC phenotype indicated that genomic abnormalities for REL, SIM1, RB, MYC, and CDKN1B are equally distributed in both groups (details of the distribution are provided in supplemental Table 1). By contrast, BCL2 copy gains (25 of 64, compared with only 2 of 27 in the GCB subtype; P = .005) are significantly more frequent in the ABC subtype. CDKN2A/CDKN2B losses tend to be more frequently observed in the ABC group (30 of 64 compared with 9 of 27; P = .25).
Prognosis relevance of GCNA in the rituximab era
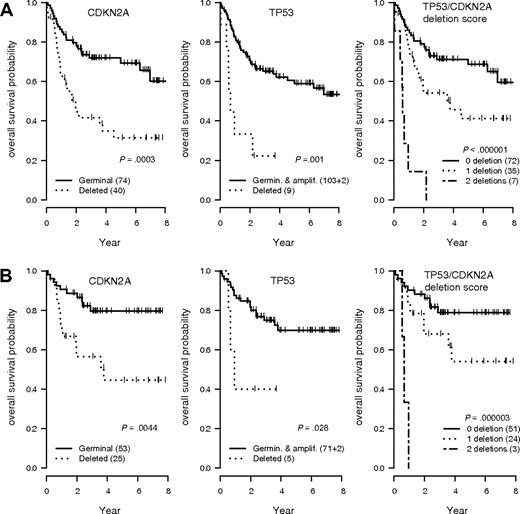
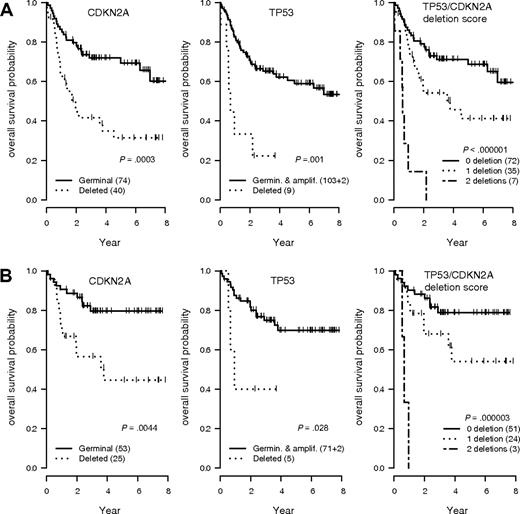
Two GCNAs (TP53 and CDKN2A loss) were strongly associated with an unfavorable outcome (Figure 2). DLCBL with TP53 loss showed a significantly shorter OS and EFS in the overall population (hazard ratio = 3.94 [95% CI, 1.74-8.93], P < .001; and hazard ratio = 4.32 [95% CI, 2.01-9.3], P < .001, respectively) or in patients treated by R-CHOP (hazard ratio = 3.64 [95% CI, 1.06-12.5], P = .03; and hazard ratio = 4.05 [95% CI, 1.39-11.8], P = .005, respectively). DLBCL with CDKN2A loss showed a significant shorter OS and EFS in the overall population (hazard ratio = 2.72 [95% CI, 1.54-4.81], P < .001; and hazard ratio = 2.31 [95% CI, 1.42-2.78], P < .001, respectively) or in patients treated by R-CHOP (hazard ratio = 3.19 [95% CI, 1.37-7.42], P = .004; and hazard ratio = 2.98 [95% CI, 1.53-5.82], P < .001, respectively). Of note, these 2 genomic abnormalities had an additive effect, delineating a subgroup of patients with a very poor prognosis after treatment by CHOP (hazard ratio = 10.1 [95% CI, 4.16-24.53], P < .001) or R-CHOP (hazard ratio = 17.1 [95% CI, 4.19-19.76]; P < .001; Figure 2). A Cox model incorporating TP53 and CDKN2A status, age-adjusted International Prognostic Index (aaIPI), and treatment arm (CHOP vs R-CHOP) identified these genetic alterations as independent predictors of the OS (hazard ratio = 2.53 [95% CI, 1.06-5.99], P = .03; and hazard ratio = 2.38 [95% CI, 1.31-4.37], P = .005, respectively) and EFS (hazard ratio = 3.66 [95% CI, 1.62-8.23]; P = .002; and hazard ratio = 2.08 [95% CI, 1.24-3.45], P = .005, respectively). None of the other GCNAs detected by QMPSF had prognostic significance in this series.
OS according to the TP53 and CDKN2A allelic status in DLBCL. (A) Overall survival (OS) probability in the entire lymphoma population (n = 114). (B) OS probability in the subgroup of patients treated by rituximab, cyclophosphamide, doxorubicin, vincristine, and prednisone (R-CHOP) or R-CHOP–like regimens (n = 78). T53/CDKN2A score indicates patients without any deletion (score 0), 1 deletion (score 1), or 2 deletions (score 2).
OS according to the TP53 and CDKN2A allelic status in DLBCL. (A) Overall survival (OS) probability in the entire lymphoma population (n = 114). (B) OS probability in the subgroup of patients treated by rituximab, cyclophosphamide, doxorubicin, vincristine, and prednisone (R-CHOP) or R-CHOP–like regimens (n = 78). T53/CDKN2A score indicates patients without any deletion (score 0), 1 deletion (score 1), or 2 deletions (score 2).
Analysis of the 9p21 locus using a dedicated assay
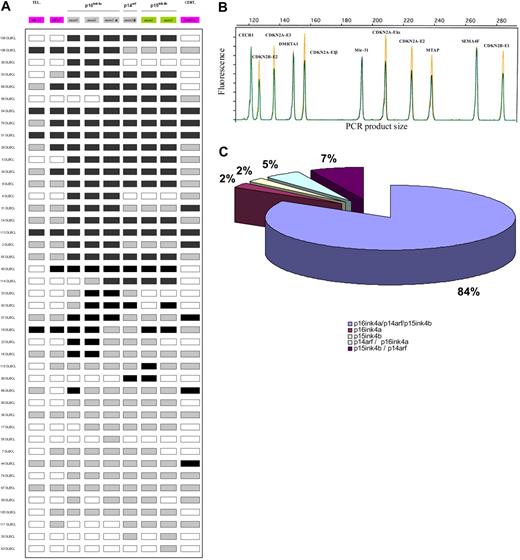
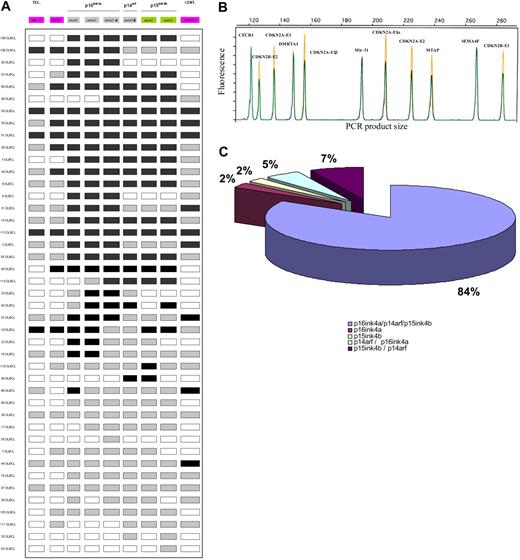
To obtain a more accurate view of the genomic alteration of the 9p21 region that contains several tumor suppressor genes, we used a dedicated QMPSF assay to test the 2 exons encoding p15INK4B (corresponding to the CDKN2B gene), the 3 exons encoding p16INKA (exon 1α, exon 2, and exon 3) and the 2 exons (exon 1β and exon 2) encoding p14ARF (both corresponding to the CDKN2A locus), as well as neighboring genes (MIR31, MTAP, and DMRTA1). A total of 43 DLBCL samples displayed genomic alterations within this locus.
Results between the first QMPSF assay and the dedicated QMPSF assay were in agreement, except for 4 patients with limited alteration of this region. These 4 patients showed CDKN2A exon 1β and/or CDKN2B loss but no deletion of CDKN2A exon 1α. In most cases (36 [84%] of 43), deletions simultaneously affected p15INK4B, p16INK4A, and p14ARF status. Details of the CDKN2A/CDKN2B allelic status are indicated in Figure 3 and supplemental Table 1. The MIR31 gene was codeleted with the CDKN2A/CDKN2B genes in all cases. In 30 (70%) of 43 cases, a QMPSF ratio less than 0.5 of at least 1 amplicon indicated a homozygous deletion of all or a part of the 9p21 locus.
Schematic representation of the 9p21 locus and its genomic alterations detected by a dedicated quantitative QMPSF assay in DLBCL. (A) The molecular organization of the locus is indicated. Abnormal copy numbers are represented by shaded rectangles (gray indicates heterozygous deletion; black, homozygous deletion). (B) Example of an electropherogram obtained with the dedicated 9p21 locus QMPSF assay. (C) Schematic repartition of the deletions involving the 9p21 locus.
Schematic representation of the 9p21 locus and its genomic alterations detected by a dedicated quantitative QMPSF assay in DLBCL. (A) The molecular organization of the locus is indicated. Abnormal copy numbers are represented by shaded rectangles (gray indicates heterozygous deletion; black, homozygous deletion). (B) Example of an electropherogram obtained with the dedicated 9p21 locus QMPSF assay. (C) Schematic repartition of the deletions involving the 9p21 locus.
Information regarding the approximate location of the breakpoint boundaries were provided. The telomeric extremity of the deletion was frequently located between CDKN2A exon 3 and MTAP exon 8 (17 of 43 cases). The centromeric extremity of the deletion appeared frequently located between DMRTA1 and CDKN2B exon 1 (18 of 43 cases). Another hotspot, located between CDKN2A exon 1α and exon 1β, displayed 11 breakpoints.
The prognosis of the refined group of patients displaying CDKN2A and/or CDKN2B deletions was assessed. Patients with homozygous or heterozygous deletions of CDKN2A and/or CDKN2B (n = 43) displayed a significantly shorter OS (hazard ratio = 2.57 [95% CI, 1.45-4.54], P = .001) and EFS (hazard ratio = 2.09 [95% CI, 1.28-3.40], P = .003) compared with patients in germ line configuration (n = 71). Of note, patients with heterozygous deletions (n = 13) displayed an intermediate prognosis compared with germ line patients (OS hazard ratio = 1.96 [95% CI, 0.84-4.6], P = .12) and patients with homozygous deletions (hazard ratio = 2.90 [95% CI, 1.56-5.37], P < .001).
Analysis of the 17p13 locus using a dedicated assay
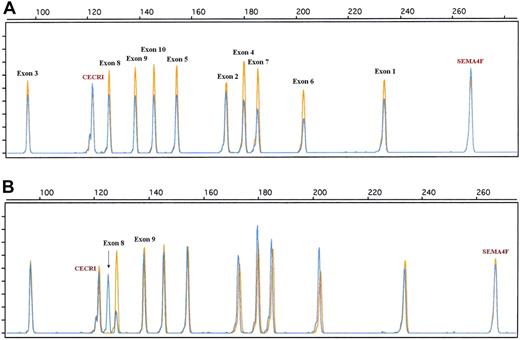
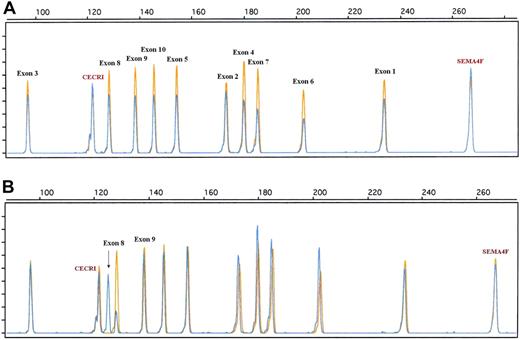
Similarly, to obtain a more accurate view of the genomic alteration of the 17p13/TP53 locus, a dedicated QMPSF assay containing primer pairs covering exons 1 to 10 was designed (Figure 4; supplemental Table 2). Using this assay, TP53 deletions were detected in 9 patients (supplemental Table 1; Figure 4). QMPSF profiles indicate that TP53 deletions encompassed the 10 exons in 8 of 9 patients, showing that our screening assay, based on a single primer pair, is relevant to detect TP53 deletions in most patients. In addition, an aberrant electropherogram pattern was found in 2 patients. Sequencing analysis indicated that this pattern was related to a short internal frameshift deletion within exon 8 (GGT, codon 262, case 92) and to an insertion of 8 nucleotides within intron 9 (TGTTTTAC, patient 41; Figure 4; supplemental Table 1). Survival analysis indicates that micro- or macrodeletion of the coding region (QMPSF ratio < 0.7, n = 9) was associated with a significantly shorter OS and EFS in the overall population (hazard ratio = 2.90 [95% CI, 1.22-6.89], P = .016; and hazard ratio = 3.40 [95% CI, 1.59-7.25], P = .002, respectively).
Examples of TP53 genomic alterations detected by a dedicated quantitative QMPSF assay in DLBCL. Tumor and normal QMPSF electropherograms are indicated in blue and orange, respectively. (A) Case 10. This case showed a decrease of the fluorescence of the 10 TP53-related peaks compared with normal DNA and endogenous controls. (B) Case 92. This case displayed an aberrant electropherogram indicative of a deletion of 3 nucleotides (arrow) located within exon 8 (codon 262).
Examples of TP53 genomic alterations detected by a dedicated quantitative QMPSF assay in DLBCL. Tumor and normal QMPSF electropherograms are indicated in blue and orange, respectively. (A) Case 10. This case showed a decrease of the fluorescence of the 10 TP53-related peaks compared with normal DNA and endogenous controls. (B) Case 92. This case displayed an aberrant electropherogram indicative of a deletion of 3 nucleotides (arrow) located within exon 8 (codon 262).
Correlation between gene expression profile and GCNA
The relationship between the GCNA status and the corresponding mRNA expression, determined either by HU133A and/or TLDA, indicates that in most cases gene expression correlates with the gene copy number status. A significant decrease of TP53, CDKN2A, and CDKN1B mRNA expression was found in DLBCL with TP53, CDKN2A, and CDKN1B deletions, respectively. Similarly, a significant increase of BCL2 and REL mRNA expression was found in DLBCL with copy gains of BCL2 and REL (supplemental Table 4).
For the 52 patients with available Affymetrix data, we performed a supervised analysis to identify probe sets showing differential expression according to GCNAs of BCL2, TP53, SIM1, REL, MYC, and CDKN2A.
A total of 11 probe sets appeared differentially expressed between DLBCL with BCL2 gene copy gains (n = 12) and others (n = 40), corresponding to 7 up-regulated genes and 4 down-regulated genes.
Only 1 probe set, corresponding to the UK114 mRNA gene, was significantly differentially expressed in tumor samples with TP53 deletions (n = 4) after FDR adjustment. Of note, Trail receptor-2/DR5 (TNFRSF10B), previously reported as the most underexpressed gene in DLBCL with TP53 mutations, also tended to be underexpressed26 (P = .01 and adjusted P = .29). Similarly, mRNA expression of TRIM22 (an interferon-inducible protein member of the TRIM protein family), a well-known TP53 target gene previously identified by GEP analysis in myeloma cell lines,27 tended to decrease (P < .001 and adjusted P = .17).
Patients with DLBCL who displayed SIM1 deletions (n = 8) were characterized by the differential expression of 108 probe sets, corresponding to 92 underexpressed genes and 7 overexpressed genes. It is noteworthy that 40 (43%) of 92 genes showing decreased expression are located within the 6q11-q27 cytobands. Of the top 20 underexpressed genes, 17 (85%) are located within a genomic region delineated by the 6q11-q27 cytobands. These observations indicate that the deletion of SIM1 (6q16.2) is associated in most cases with a larger defect of the long arm of chromosome 6, leading to a predominant gene dosage effect.
We failed to detect any probe sets that were significantly differentially expressed in patients with REL (n = 10) or MYC (n = 6) gains. Details of the probe sets/genes differentially expressed for each GCNA are shown in supplemental Table 5.
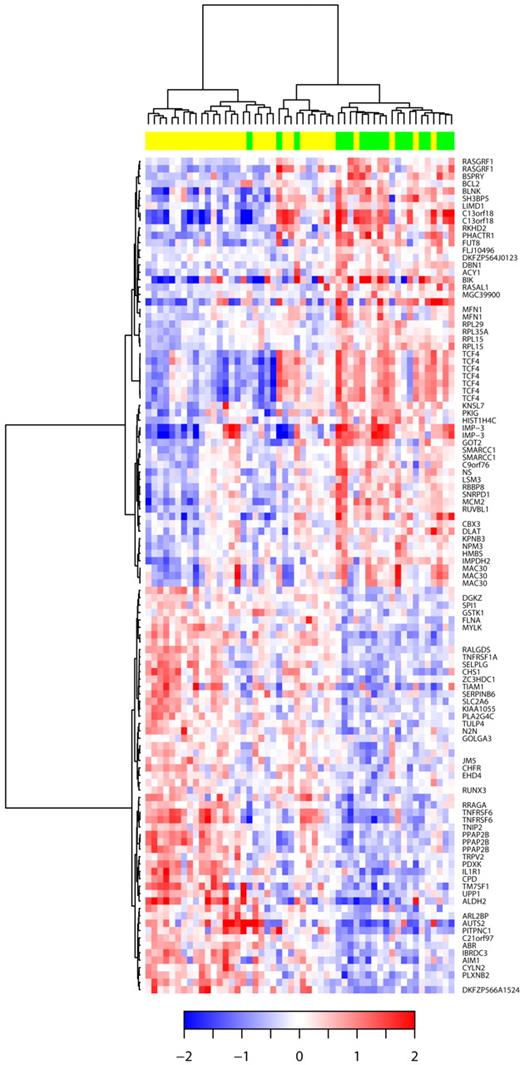
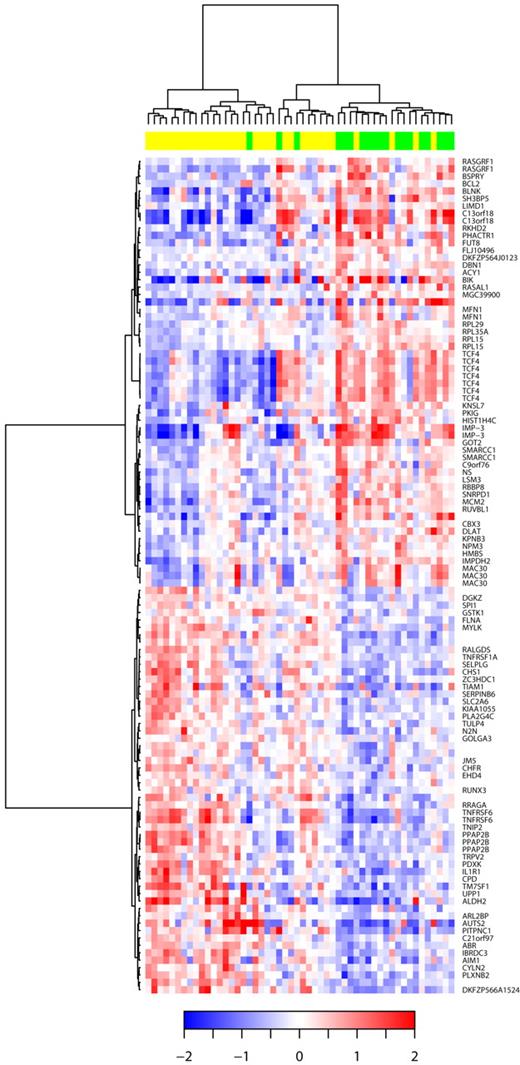
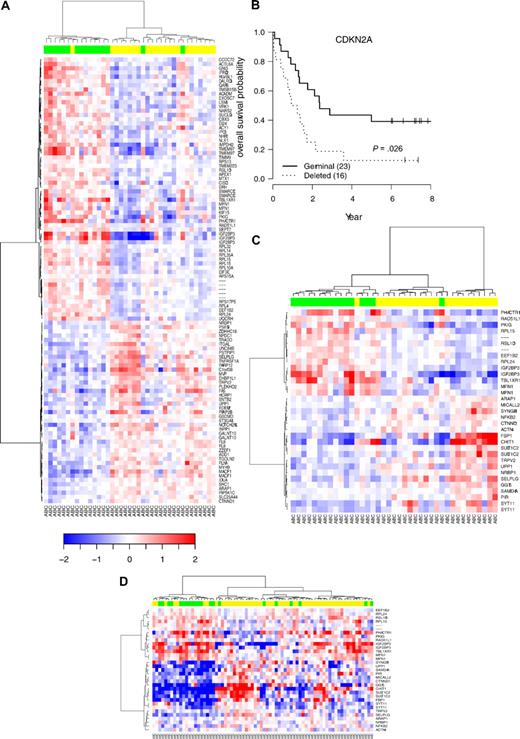
Of these 52 patients, 19 (36%) displayed CDKN2A deletion (including 11 patients with homozygous deletion), and 33 were in a germ line configuration. We identified 42 genes that were significantly underexpressed and 44 genes that were up-regulated in DLBCL9p21del (corresponding to 149 probe sets). Decreased expression with the greatest statistical difference significance was seen with TNFRSF6, AIM1, DGKZ, IL1R1, RRAGA, TIAM1, UPP1, ITGAL, PARP12, and LIMS1. Conversely, increased expression with the greatest statistical significance was observed with PHACTR1, RPL15, FUT8, IMPDH2, TBL1XR1, ACY1, MEX3C, TMSB15B (MGC39900), ARMCX2, and BSPRY (Table 2). The hierarchical clustering of the 52 DLBCL samples according to the 9p21 locus status is represented in Figure 5.
Hierarchic clustering based on the set of mRNA differentially expressed in DLBCL with 9p21 deletion. The relative levels of gene expression of each probe set are depicted according to the color scale shown at the bottom of the heatmap. Each row represents a separate Affymetrix probeset on the microarray, and each column represents a separate lymphoma sample. Green boxes at the top of the columns indicate samples with CDKN2A deletions; yellow boxes, samples without CDKN2A deletions. HUGO genes symbols are listed in the right column.
Hierarchic clustering based on the set of mRNA differentially expressed in DLBCL with 9p21 deletion. The relative levels of gene expression of each probe set are depicted according to the color scale shown at the bottom of the heatmap. Each row represents a separate Affymetrix probeset on the microarray, and each column represents a separate lymphoma sample. Green boxes at the top of the columns indicate samples with CDKN2A deletions; yellow boxes, samples without CDKN2A deletions. HUGO genes symbols are listed in the right column.
Biologic pathways involved in the DLBCL9p21del subgroup
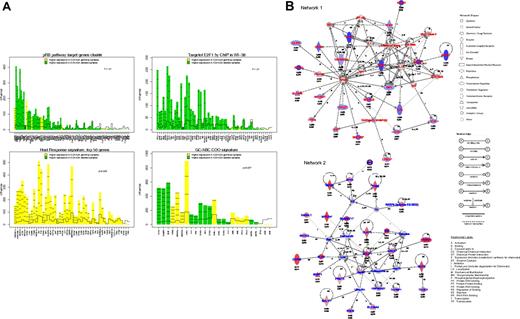
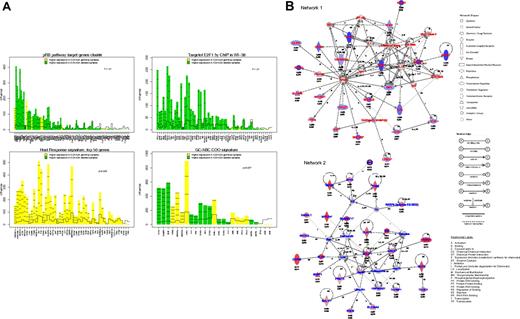
We first examined whether 9p21 deletion affected the p16INK4A/pRb/E2F pathway. Using a global testing approach, a significant enrichment of genes regulated by the p16inka/pRb/E2F pathway in U-2 OS cells28 as well as those containing E2F binding sites29 was observed in DLBCL9p21del cases (Figure 6A). These sets of genes were highly expressed in DLBCL9p21del, indicating that the GEP of DLBCL9p21del is at least partially related to the loss of RB1 regulation and to the release of its downstream targets.
Gene expression profile analysis of 52 DLBCL. (A) Gene plots of the gene sets related to p16ink4a/pRb/E2F pathway (top left), containing E2F binding site (top right), related to the host response (bottom left), and related to the GCB/ABC signature (bottom right) that were differentially expressed between DLBCL with or without 9p21 locus deletion. These plots represent the influence of individual genes of each pathway to the differential expression in 2 groups of samples. For each gene probe set (x-axis), a bar and a reference line are shown. The reference line shows the expected height of the bar under the null hypothesis that the gene is not statistically associated with a DLBCL subgroup. The height of the bar indicates the strength of the association of each probe set with the DLBCL subgroup. The horizontal lines in each bar represent how many standard deviations the gene expression exceeds the hypothesis that there would be no difference between groups (z-score). Genes with higher expression in DLBCL with 9p21 locus deletion are shown in green, and those in DLBCL without 9p21 locus deletions are shown in yellow. (B) Assemblage of genes expressed differentially in DLCBL with CDKN2A deletion into molecular networks. Network 1 represents genes with decreased expression; Network 2, genes with increased expression. Adjusted P value (threshold < .10) and log of the fold change expression are indicated for each gene tested in array experiments.
Gene expression profile analysis of 52 DLBCL. (A) Gene plots of the gene sets related to p16ink4a/pRb/E2F pathway (top left), containing E2F binding site (top right), related to the host response (bottom left), and related to the GCB/ABC signature (bottom right) that were differentially expressed between DLBCL with or without 9p21 locus deletion. These plots represent the influence of individual genes of each pathway to the differential expression in 2 groups of samples. For each gene probe set (x-axis), a bar and a reference line are shown. The reference line shows the expected height of the bar under the null hypothesis that the gene is not statistically associated with a DLBCL subgroup. The height of the bar indicates the strength of the association of each probe set with the DLBCL subgroup. The horizontal lines in each bar represent how many standard deviations the gene expression exceeds the hypothesis that there would be no difference between groups (z-score). Genes with higher expression in DLBCL with 9p21 locus deletion are shown in green, and those in DLBCL without 9p21 locus deletions are shown in yellow. (B) Assemblage of genes expressed differentially in DLCBL with CDKN2A deletion into molecular networks. Network 1 represents genes with decreased expression; Network 2, genes with increased expression. Adjusted P value (threshold < .10) and log of the fold change expression are indicated for each gene tested in array experiments.
To obtain a more comprehensive analysis of the GEP related to DLBCL9p21del, we determined networks, canonical pathways, and functions that may characterize the set of genes that are differentially expressed. The first network was obtained from the set of genes showing decreased mRNA expression. A total of 23 (65%) of 35 genes in this network had a decreased expression in DLBCL9p21del. Thus, this subgroup of lymphoma is characterized by the down-regulation of genes involved in immune and inflammatory responses, including FAS (TNFRSF6), IL1R1, and TNFRSF1A (Figure 6B; supplemental Table 6A). The second network was obtained from the set of genes that displayed a significantly increased expression. A total of 25 (71%) of 35 genes in this network were highly expressed in DLBCL9p21del. This computed interconnection is characterized by the interaction of molecules involved in apoptosis (BCL2, BIK, BIRC5), cell signaling (RASGRF1, BLNK) and DNA replication (MCM2; Figure 6B; supplemental Table 6A). The second IPA analysis compared the list of significant genes with canonical pathways and biologic functions (supplemental Table 6B-C). Overexpressed genes were generally related to nucleotide and amino acid metabolism as well as RNA posttranscriptional modification, whereas genes with decreased expression were related to integrin signaling or natural killer (NK)–T-cell signaling.
A TLDA assay (supplemental Table 2) was designed to validate the Affymetrix signature on an independent series of 36 patients with DLBCL, including 16 samples with DLBCL9p21del (14 homozygous deletions and 2 heterozygous deletions). Among the 22 genes included on the customized fluidic card, 12 genes (SLBP, PDXK, UPP1, RFC4, RMI1, FUT8, IGF2BP3, AUTS2, ACY1, BCL2, CDKN2A, and CDKN2B) were confirmed to be differentially expressed (Table 3). A total of 5 genes (TMEM97, RPL15, RASGRF1, IMPDH2, and PPAP2B) also showed a nonsignificant trend for differential expression. After unsupervised hierarchic clustering based on the expression of these 22 genes, 33 (92%) of 36 patients with DLBCL were properly classified according to their 9p21 locus status (supplemental Figure 1).
Relationship of 9p21 deletion with cell of origin and other DLBCL classifications
We next determined if the DLBCL9p21del signature was related to the sets of genes that define the host response signature (HR), the B-cell receptor, the oxidative phosphorylation (OxPhos), the GCB, and ABC signature.1 We found a significant enrichment of highly expressed genes related to the HR signature in DLBCL without 9p21 locus alteration and a significant enrichment of genes of the ABC signature with increased expression in DLCBL9p21del (Figure 6B). This enrichment was further confirmed in DLBCL studied by RT-QPCR (Table 3).
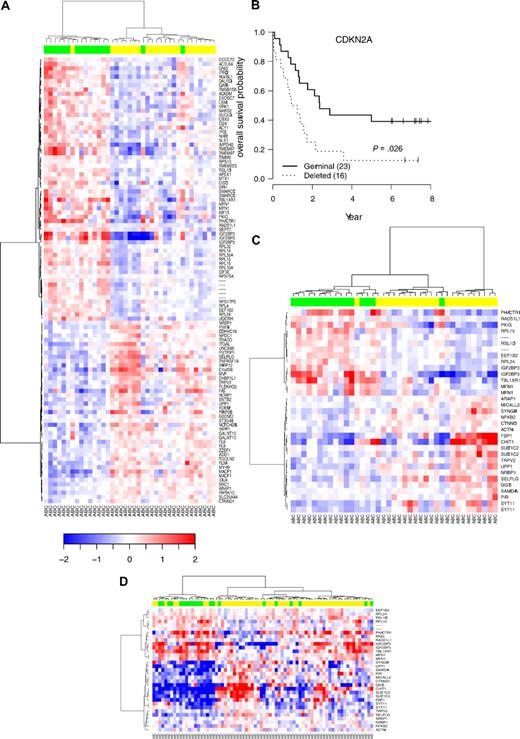
To identify GEP changes due to CDKN2A/CDKN2B deletions unrelated to the ABC/GCB subclassification, we specifically analyzed mRNA expression of the subgroup of 39 ABC DLBCL. A total of 15 DLBCL9p21del cases were therefore compared with 24 DLBCL cases. Using a supervised approach, 105 probe sets (corresponding to 90 genes) appeared differentially expressed (Figure 7A and Table 2). Among these probe sets, 33 (38%) belonged to the set of probes differentially expressed in the entire DLBCL9p21 subgroup. These genes include, notably, UPP1, IGF2BP3, ACY1, TMEM9, RPL15, RASGRF1, IMPDH2, or PPAP2B, which were confirmed by TLDA experiments. These results indicate that the DLBCL9p21-related GEP is partially independent of the ABC/GCB signature.
Hierarchic clustering according to CDKN2A genomic status in DLBCL with ABC phenotype and survival. (A) Supervised hierarchic clustering according to CDKN2A status in the activated B-cell (ABC) DLBCL subtype. (B) OS probability in the subgroup of patients with ABC-DLBCL analyzed by Affymetrix U133A. (C) Unsupervised hierarchic clustering according to the expression of 27 genes belonging to the ABC 9p21 signature previously defined from array experiments. (D) Unsupervised hierarchic clustering according to the expression of this set of genes in an independent series of ABC-DLBCL samples.3 Green boxes indicate samples with CDKN2A deletions; yellow boxes, samples without CDKN2A deletions.
Hierarchic clustering according to CDKN2A genomic status in DLBCL with ABC phenotype and survival. (A) Supervised hierarchic clustering according to CDKN2A status in the activated B-cell (ABC) DLBCL subtype. (B) OS probability in the subgroup of patients with ABC-DLBCL analyzed by Affymetrix U133A. (C) Unsupervised hierarchic clustering according to the expression of 27 genes belonging to the ABC 9p21 signature previously defined from array experiments. (D) Unsupervised hierarchic clustering according to the expression of this set of genes in an independent series of ABC-DLBCL samples.3 Green boxes indicate samples with CDKN2A deletions; yellow boxes, samples without CDKN2A deletions.
Furthermore, this genomic deletion is still predictive of the outcome in the ABC subtype, defining therefore an ABC DLBCL9p21del subgroup with a very poor prognosis (Figure 7B; OS hazard ratio = 2.35 [95% CI, 1.11-4.98], P = .026; EFS hazard ratio = 2.00 [95% CI, 1.00-4.01], P = .05).
Comparison of the DLBCL9p21del GEP with available public data
To confirm our results, we compared the 9p21 signature obtained in our series to an independent dataset of mRNA expression. To determine patients belonging to the DLBCL9p21 subgroup, sample CGH segmentation was performed with DNA copy algorithm as described.3 By this approach, 25 patients with CDKN2A deletions were diagnosed and compared with 147 germ line cases (patients with PMBCL were excluded). Among the 149 probe sets belonging to our 9p21 signature, 59 (39.6%) were also found to be differentially expressed in this series. The global test approach confirmed the significant enrichment of the signature (P < .001). Considering the fact that almost all DLBCL9p21 cases belong to the ABC subtype in this external series (21/25 DLBCL9p21), we combined the results of the differential expression analyses of the 2 datasets to identify a common set of genes able to predict the CDKN2A/CDKN2B allelic status in ABC lymphoma cases.25 Using this approach, we defined a list of 33 probe sets (corresponding to 28 genes including CDKN2A) that classifies our ABC DLBCL samples and the independent set of ABC DLBCL samples according to their 9p21 allelic status with unsupervised hierarchical clustering. Importantly, this set of genes remains efficient after exclusion of CDKN2A and defines a branch within the hierarchic clustering containing, respectively 15 (88%) of 17 and 14 (66%) of 21 ABC DLBCL9p21del cases (Figure 7C-D). Of note, these genes are mainly involved in cell cycle, cellular growth, and ribosome biogenesis (RPL15, RPL14, RPL24, RPL32, RSL1D1, and RPS13; supplemental Table 7).
Discussion
Our results show that 9p21 locus alterations have a strong prognostic impact in patients with DLBCL treated with a combination of chemotherapy and rituximab, thereby confirming and extending previous studies.30 These findings are important because CDKN2A deletions are observed in approximately one-third of patients and can be easily detected by a simple PCR assay. Thus, 9p21 deletion is a simple biomarker that could be used in routine practice. We also confirmed the prognostic value of TP53 deletions in patients treated by R-CHOP and observed an additive unfavorable effect of these 2 GCNAs, as shown by the dramatic outcome of patients with concomitant deletions of CDKN2A and TP53 (6% in this series). In addition, using different approaches (ie, global testing in a first set of patients and RT-QPCR in a second set of patients), we showed that CDKN2A loss is predominantly observed in DLBCL with an ABC phenotype. These results are in agreement with those recently published indicating that CDKN2A was deleted in 30% of ABC-DLBCL and only in 4% of GCB-DLBCL.3 Interestingly, LMO2, often considered to be one of the most reliable GCB biomarkers,31 is also among the most underexpressed genes in DLBCL9p21del. Conversely, FUT8, which is included in the Wright classifier, is one of the most highly expressed genes in DLBCL9p21del and ABC subtypes.18,32
Giving the strong interaction that may exist between the 9p21 locus status and the GCB/ABC phenotype, we subsequently focused our analysis on ABC-DLBCL. Approximately 40% of the genes included in the 9p21 signature defined in the whole population remained differentially expressed when the analysis was restricted to the ABC subgroup. Furthermore, in our series, CDKN2A/CDKN2B deletions are still predictive of the outcome in the ABC subtype, defining a subgroup with a particularly unfavorable outcome. More important, we refined a set of 28 genes that efficiently classified an independent set of ABC-DLBCL with unsupervised hierarchical clustering, confirming the specificity of this subgroup among patients with ABC-DLCBL.
Gene expression signatures related to recurrent translocations involving BCL2, BCL6, or MYC that are considered to be primary genetic events have been identified.33-35 More recently, it was demonstrated that inactivation of TP53 was associated with a particular GEP characterized notably by a decreased expression of TRAIL receptor-2.26 Here, we delineated approximately 100 genes that distinguish DLBCL9p21del. This set of genes may represent the molecular basis for the unfavorable outcome of this subgroup.26,36 The CDKN2A locus encodes 2 different proteins: p16INK4A and P14ARF. p16INK4A participates in the G1/S phase transition by inhibiting the kinase activity of CDK4/6 and consequently the phosphorylation of the Retinoblastoma protein (pRb). As a consequence of the phosphorylated status of pRb, the E2F transcription factor family is inhibited. In contrast, the p14ARF protein inactivates the MDM2 protein and thereby stabilizes the p53 protein, but also suppresses ribosome biogenesis.37 Therefore, genetic alterations of the CDKN2A locus may impair both p14ARF/p53 and p16INK4A/pRb pathways, providing a selective advantage in the development and progression of tumors. In the present study, molecular anatomy of the deletions determined clearly indicated that in almost all cases, both p14ARF and p16INK4A are inactivated. Using a global testing approach to further characterize the GEP related to CDKN2A/ARF deletion, we observed an enrichment of genes regulated by the p16INK4A/RB1/E2F pathway or in those that contain E2F1 binding sites.29 These observations indicate that the tumor suppressor role of CDKN2A in DLBCL is mechanistically related to RB1 and its downstream targets. A proliferation signature based on the expression of 20 genes highly expressed in dividing cells has been defined in MCL.38 Interestingly, 8 genes included in this proliferation signature (MCM2, HMGB2, TOP2A, CEBPB, CDKN3, PCNA, and CDC2) were also highly expressed in DLBCL9p21del.
It appears that the GEP associated with DLBCL9p21del also results from molecular events that are not directly connected to CDKN2A or CDKN2B gene loss. For example, genes with increased expression in DLBCL9p21del include BCL2. The increase of BCL2 mRNA expression in DLBCL9p21del is most likely explained by the strong association between BCL2 gains and CDKN2A losses, as indicated by a significantly higher level of BCL2 mRNA expression in DLBCL9p21del with BCL2 gain compared with DLBCL9p21del without BCL2 gain (data not shown). These results suggest that these 2 GCNAs generate synergistic molecular effects that may be positively selected during lymphomagenesis. We also hypothesize that genomic alterations of genes surrounding CDKN2A/CDKN2B may influence the GEP. Using a dedicated QMPSF assay to further analyze the 9p21 locus, we observed that 9p21 genomic alterations were characterized by large deletions that involve the centromeric and telomeric boundary markers DMRAT1 and MIR31/MTAP. MIR31 is constantly codeleted with CDKN2A, suggesting that its deletion does not represent, by itself, an essential oncogenic event in DLBCL. In contrast to what was reported in MCL, we did not observe deletions solely involving MTAP.13,39 MTAP-knockout mice die prematurely and develop T-cell lymphoma, whereas re-expression of MTAP in MTAP-deleted tumor cell lines leads to loss of tumor formation.40 MTAP is involved in the activation of the intrinsic mitochondrial-dependent apoptotic pathway, and it is therefore likely that its inactivation contributes to the aggressiveness of the tumor.
Similarly, we used a dedicated QMPSF assay to further analyze the 17p13 locus. Our results are in agreement with CGH experiments and confirm that in most cases, TP53 deletions implicate the totality of the coding region.12 Of note, we observed a microdeletion involving the DNA-binding domain of TP53 in 1 patient. These results are in agreement with the frequency of short internal deletions/insertions observed by denaturing high-performance liquid chromatography, indicating that QMPSF assay is also adequate to detect short internal deletions/insertions in this setting.26
In summary, DLBCL9p21del was associated with a specific gene expression profile that combines direct and indirect effects of the deletion, including an activated cellular metabolism and an increase of antiapoptotic mechanisms in a background of ABC-related signature. In addition, we clearly identified an underexpression of genes related to T cells or macrophages in DLBCL9p21del, indicating that this subgroup may also differ by the nature of its microenvironment.
Predicting the outcome using routinely applicable tests in lymphoma still remains a challenge. If the detection of biomarkers by immunohistochemistry remains the most routinely and universally applicable approach, results regarding its prognostic value and its reproducibility are still subject to caution.41 More recently, we established an immuno–fluorescence in situ hybridization (FISH) index based on the detection of BCL2, BCL6, or MYC translocations, which predicts survival of patients treated with R-CHOP.42 Models based on the expression of a few genes determined by RT-QPCR have also been proposed from frozen or fixed tissues.43-45 Here, we propose a complementary strategy based on the analysis of recurrent genomic alterations. The QMPSF approach reliably allows for the detection of GCNAs in a large range of tumor cell amounts, detecting gene copy number gains and losses in samples comprising as little as 30% of tumoral DNA.13 We recently proposed a single “double-hit” QMPSF assay in MCL based on the simultaneous detection of TP53 and CDKN2A deletions applicable with frozen or FFPE tumor samples.13 The present study indicates that such an assay could be a strong predictor of the outcome in DLBCL and could be advantageously used in combination with the IPI to stratify patients in clinical trials.
The online version of this article contains a data supplement.
The publication costs of this article were defrayed in part by page charge payment. Therefore, and solely to indicate this fact, this article is hereby marked “advertisement” in accordance with 18 USC section 1734.
Acknowledgments
We thank C. Maingonnat and P. Bertrand (Inserm U918, Rouen, France) for help with the TLDA experiments. We are indebted to the pathologists and clinicians of the GELA who contributed pathologic specimens and clinical data.
This study was supported by grants of the Ligue Nationale Contre le Cancer (programme Carte d'Identité des Tumeurs) and the Programme Hospitalier de Recherche Clinique (AOM 03060).
Authorship
Contribution: F.J. designed the project, analyzed the data, and wrote the manuscript; J.-P.J. designed the project, performed statistical analysis, and revised the paper; T.-J.M. analyzed data and revised the paper; P.R. performed some PCR experiments and data analysis and wrote the paper; F.P. performed most of the PCR experiments and designed PCR assays; J.-M.P. performed immunohistochemistry experiments and DNA extraction and acquired data; C.H., G.-A.S., and A.d.R. analyzed data and revised the paper; P.F. and C.G. contributed clinical data; C.B. supervised the project, analyzed QMPSF data, and revised the paper; H.T. supervised the project, analyzed clinical data, and revised the paper; C.H. revised the paper; B.C. contributed clinical data; and K.L. supervised the project, analyzed biologic data, and wrote the paper.
Conflict-of-interest disclosure: The authors declare no competing financial interests.
Correspondence: Fabrice Jardin, Inserm, Unité 918, Département d'hématologie, Centre Henri Becquerel, Rue d'Amiens, Rouen, F-76000, France; e-mail: fjardin@rouen.fnclcc.fr.

