Abstract
To identify dysregulated pathways in distinct phases of NOTCH1-mediated T-cell leukemogenesis, as well as small-molecule inhibitors that could synergize with or substitute for γ-secretase inhibitors (GSIs) in T-cell acute lymphoblastic leukemia (T-ALL) therapy, we compared gene expression profiles in a Notch1-induced mouse model of T-ALL with those in human T-ALL. The overall patterns of NOTCH1-mediated gene expression in human and mouse T-ALLs were remarkably similar, as defined early in transformation in the mouse by the regulation of MYC and its target genes and activation of nuclear factor-κB and PI3K/AKT pathways. Later events in murine Notch1-mediated leukemogenesis included down-regulation of genes encoding tumor suppressors and negative cell cycle regulators. Gene set enrichment analysis and connectivity map algorithm predicted that small-molecule inhibitors, including heat-shock protein 90, histone deacetylase, PI3K/AKT, and proteasome inhibitors, could reverse the gene expression changes induced by NOTCH1. When tested in vitro, histone deacetylase, PI3K and proteasome inhibitors synergized with GSI in suppressing T-ALL cell growth in GSI-sensitive cells. Interestingly, alvespimycin, a potent inhibitor of the heat-shock protein 90 molecular chaperone, markedly inhibited the growth of both GSI-sensitive and -resistant T-ALL cells, suggesting that its loss disrupts signal transduction pathways crucial for the growth and survival of T-ALL cells.
Introduction
T-cell acute lymphoblastic leukemia (T-ALL) results from a number of transformative steps that involve molecular abnormalities in transcription factor genes.1,2 Translocations that juxtapose TCR gene sequences with TAL1, LMO1, HOX11, or other transcriptional factors occur in 35% of T-ALL cases.1-3 Independent of these molecular events, mutations or translocations that lead to aberrant NOTCH1 activation are a common occurrence in T-ALL4-6 and probably involve a number of signaling pathways that control T-cell growth and proliferation. Overexpression of the activated form of NOTCH1 in hematopoietic cells causes T-cell neoplasms in both mice and zebrafish,7-9 providing animal models to investigate mechanisms of transformation. Targeting of the NOTCH1 protein with small-molecule γ-secretase inhibitors (GSIs) blocks the growth of T-ALL cells,4,10 indicating that NOTCH1 signaling is required, not only for transformation but also for the continuous growth of affected T lymphoblasts.
The transcriptional targets of NOTCH1 in T-ALL have been reported by us and others.11-15 One of the direct targets most relevant to NOTCH1-dependent T-ALL cell growth is the MYC oncogene.11-13 In GSI-sensitive T-ALL cell lines, overexpression of MYC rescues the growth inhibition imposed by GSI, whereas GSI-resistant T-ALL cell lines fail to down-regulate MYC after GSI treatment, indicating that MYC plays a critical role in the pathogenesis of T-ALL; however, overexpression of MYC by itself is not sufficient to induce T-ALL, with additional events required to initiate clonal growth of leukemic cells.16,17 In this regard, retroviral insertional mutagenesis identified overexpression of truncated and full-length NOTCH1 as a frequent collaborating lesion in MYC-induced T-ALL.16 We therefore hypothesize that signaling pathways driven by NOTCH1, MYC, and other complementary molecules interact synergistically to promote transformation to T-ALL.
We recently reported that overexpression of intracellular Notch1 (ICN1), an activated form of Notch1, in transplanted Lin-negative murine hematopoietic cells, leads to T-ALL.8 In this mouse model, ICN1-overexpressing abnormal CD4+CD8+ double-positive (DP) cells were found early at 2 weeks after transplantation, in the extrathymic lymphoid organs (supplemental Figure 1, available on the Blood website; see the Supplemental Materials link at the top of the online article) and displayed multiple TCR-β rearrangements consistent with their polyclonality. Notably, these abnormal DP cells lacked tumorigenic activity when transplanted into nu/nu recipient mice, whereas monoclonal DP cells emerging at 6 to 8 weeks after transplantation showed a high proliferative capacity and were tumorigenic. The latter cells were most probably derived from immature CD4−CD8+ single-positive cells that were present at low numbers at 2 weeks after transplantation. These results implicated 2 distinct phases of Notch1-induced T-ALL, characterized by (1) an early phase in which abnormal polyclonal DP cells arise and (2) a late phase characterized by the expansion of a dominant leukemic clone. Besides the up-regulation of Myc, we observed increased degradation of E2a protein in the polyclonal DP cells. The Tp53/p53 protein was specifically down-regulated in leukemic DP cells through down-regulation of the Cdkn2a/Arf protein and up-regulation of the Mdm2 protein. These results explain in part the mechanisms involved in leukemogenesis in this mouse model; however, the roles of other collaborating genes and pathways in these transformational changes are still largely unknown. Moreover, as a first-step toward identifying new molecular targets for the therapy of T-ALL, a powerful strategy is to clarify signaling pathways that are altered in the mouse model system and associate them with pathogenic events in human T-ALL. We therefore undertook gene set enrichment analysis (GSEA) and connectivity map analysis (CMAP), using gene expression data from both mouse and human T-ALL cells, to identify changes in expression profiles during distinct phases of NOTCH1-mediated T-ALL development and to gain insights into small-molecule inhibitors that would synergize with or substitute for GSIs in this disease.
Methods
Dataset
T-ALL diagnostic specimens were collected with informed consent and approval from children treated on Children's Oncology Group-9404 in accordance with the Declaration of Helsinki. All studies of primary human samples were approved by the Institutional Review Board. All animal studies were approved by the Institutional Animal Care and Use Committee. Genome-wide RNA expression analyses of mouse T-ALL, human T-ALL cell lines, and primary samples were previously performed by us.8,15,18 The datasets have been deposited in the GEO database (http://www.ncbi.nlm.nih.gov/geo/); the accession numbers are GSE12948, GSE8416, and GSE14618.
Mutation detection
Sequencing of exons 28, 29, and 34 of the human NOTCH1 gene was performed on human T-ALL cell lines and primary samples at Agencourt Bioscience.
Data analysis and significant testing
After normalization by RMA algorithm, significance analysis of microarray (SAM; Stanford University, Stanford, CA)19 was performed on the mouse dataset. Differentially expressed genes were selected based on a fold change more than or equal to 1.5 and false discovery rate approximately 10%. Statistical significance for each gene was evaluated on the basis of the SAM score. If a gene had multiple probe sets, the one with the maximum expression was chosen for further analyses. For human cell lines and primary samples, statistical significance was calculated as a P value by the paired T test and unpaired T test (Student t test or Aspin-Welch T test), respectively. Significant increases or decreases in gene expression were based on a P value less than .05 and fold change more than or equal to 1.2.
GSEA
GSEA (Broad Institute)20,21 was performed with the “curated” gene sets available at GSEA website (http://www.broad.mit.edu/gsea/). A total of 1390 gene sets were subjected to the criteria for gene number (minimum 15, maximum 500). Significant gene sets were selected on the basis with nominal P value less than .05.
CMAP
CMAP analysis (Broad Institute)22 was performed with the latest dataset version (Build 02), which contains 6100 expression profiles representing 1309 compounds (http://www.broad.mit.edu/cmap/).
Human cell lines and reagents
Human T-ALL (HPB-ALL, TALL-1, KOPTK1, DND-41, JURKAT, SUP-T7, RPMI-8402, CCRF-CEM, and MOLT16), acute myeloid leukemia (SKM-1, HEL, and OCI-AML2), Burkitt lymphoma (P3HR-1), chronic lymphocytic leukemia (MEC-2), diffuse large B-cell lymphoma (KIS-1), multiple myeloma (U266), and neuroblastoma (BE(2)C, SH-SY5Y, SK-N-SH, and CHP-100) cell lines were cultured in RPMI 1640 medium. Breast cancer (MDA-MB-435), glioblastoma (LN-428), cervical cancer (HeLa), and colon cancer (HCT-116) cell lines were cultured in Dulbecco modified Eagle medium. Each medium contained l-glutamine and 10% fetal bovine serum (Sigma-Aldrich). A GSI, MRK-003, was obtained from Merck Research Laboratories. A histone deacetylase (HDAC) inhibitor, vorinostat, was used as described previously.23 Proteasome inhibitors MG-132 and bortezomib and a heat-shock protein 90 (HSP90) inhibitor alvespimycin were purchased and used in this study.
Cell viability assay
Cells were plated in 96-well plates at 104 cells/well and treated with each of the compounds. The number of viable cells was measured by methyl-thiazolyl-tetrazolium (MTT) assay as described previously.23 The half-maximal inhibitory concentration (IC50) was calculated, and nonlinear regression curves were drawn using GraphPad Prism.
Results
Transformation phases and their associated genes in a Notch1-induced mouse model of T-ALL
We previously described an ICN1-induced mouse model of T-ALL,8 in which polyclonal CD4+CD8+ DP T cells appeared at 2 weeks after transplantation of hematopoietic cells that had been transduced with the ICN1 gene (supplemental Figure 1). These cells ectopically overexpressed ICN1 but had a low proliferative capacity and no tumorigenic activity, distinguishing them from both normal thymocytes and leukemic DP cells. At 6 to 8 weeks after transplantation, monoclonal DP cells emerged with high levels of proliferative activity and tumorigenicity. To clarify the molecular changes induced by ICN1 transduction, we performed gene expression analysis of DP cells from 3 different groups of mice: (1) control DP cells infected with an empty retrovirus, (2) polyclonal DP cells from mice transplanted with ICN1-transduced bone marrow cells that appeared after 2 weeks after transplantation, and (3) monoclonal (leukemic) DP cells from mice after 6 to 8 weeks after transplantation.
To identify differentially expressed genes in DP cells from the different groups of mice, we first applied the SAM algorithm19 to our gene expression arrays from each group of mice. The results indicate that, in polyclonal DP cells, 1261 genes were significantly up-regulated and 952 were down-regulated compared with normal controls (Figure 1A). In leukemic DP cells, 637 genes were up-regulated and 1707 down-regulated compared with polyclonal DP cells (Figure 1B). For the genes whose expression changed in polyclonal DP cells compared with normal controls, the degree of up-regulation in a subset of genes (red dots in Figure 1A) was much greater than the degree of down-regulation in the opposite subset (green dots), whereas the reverse trend was observed in the comparison of leukemic versus polyclonal DP cells (Figure 1B). These results indicate that transcriptional overexpression dominates in the setting of Notch1 activation in nontransformed polyclonal DP cells, whereas down-regulation of a subset of genes predominates in the transformed leukemic cells.

Differentially expressed genes in a Notch1-induced mouse model of T-ALL. (A-B) SAM was applied in triplicate in 2 comparisons: polyclonal DP cells versus normal control (A) and leukemic DP cells versus polyclonal DP cells (B), with 3 different mice per group. Significant genes were selected by the following criteria: fold change ≥ 1.5 and δ value of 0.37 (polyclonal DP cells vs normal control) and 0.55 (leukemic DP cells vs polyclonal DP cells) to adjust the false discovery rate to ∼ 10%. Red or green dots represent genes that were significantly up-regulated or down-regulated in each comparison, respectively. (C) Heat-map images for the differentially expressed genes. The selected genes were classified into groups 1 to 8, based on significant levels and fold change between each of cells. Normal control (N), polyclonal DP cells (P), and leukemic DP cells (L).
Differentially expressed genes in a Notch1-induced mouse model of T-ALL. (A-B) SAM was applied in triplicate in 2 comparisons: polyclonal DP cells versus normal control (A) and leukemic DP cells versus polyclonal DP cells (B), with 3 different mice per group. Significant genes were selected by the following criteria: fold change ≥ 1.5 and δ value of 0.37 (polyclonal DP cells vs normal control) and 0.55 (leukemic DP cells vs polyclonal DP cells) to adjust the false discovery rate to ∼ 10%. Red or green dots represent genes that were significantly up-regulated or down-regulated in each comparison, respectively. (C) Heat-map images for the differentially expressed genes. The selected genes were classified into groups 1 to 8, based on significant levels and fold change between each of cells. Normal control (N), polyclonal DP cells (P), and leukemic DP cells (L).
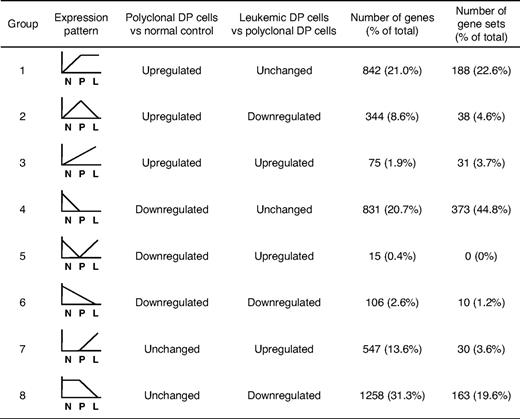
A total of 4018 genes attained significance in the analyses shown in Figure 1A and B (genes represented by green or red dots), and these were selected for further study (listed in supplemental Table 2). To gain insights into T-ALL pathogenesis represented by these differentially expressed genes, we divided them into 8 groups based on the types of changes observed (Figure 1C; Table 1). Groups 1 to 3 included all genes up-regulated in polyclonal DP cells versus normal controls, and groups 4 to 6, all genes down-regulated in the same comparison. These results were refined by subdividing the genes according to their expression patterns in leukemic versus polyclonal cells: unchanged (groups 1 and 4), down-regulated in leukemic cells (groups 2 and 6), and up-regulated in leukemic cells (groups 3 and 5). Groups 7 and 8 included the genes that were up-regulated or down-regulated, respectively, in leukemic versus polyclonal DP cells but were unchanged in the comparison of polyclonal DP cells versus normal controls.
To identify the biologic pathways that are deregulated in the DP cells at each phase, we then compared our mouse data with a total of 1390 annotated gene sets using GSEA.20,21 The significant gene sets (nominal P < .05) were selected and then classified into 8 groups based on the pattern of regulation (Table 1).
Up-regulation of Notch1, Myc, and other prosurvival or proliferation pathways in the polyclonal abnormal DP cells
By GSEA, the gene set designated “NOTCH signaling pathway” showed the regulation pattern of group 2 in which Notch1 targets and coactivators were highly enriched in polyclonal DP cells compared with normal controls and were down-regulated in leukemic DP cells (Figure 2A). Most of the individual Notch1 target genes were up-regulated in polyclonal DP cells but were either down-regulated (group 2: Ptcra and Snw1) or unchanged (group 1: Dtx1 and Hes1) in leukemic DP cells (Figure 2B). Unlike other Notch1 targets, Myc and its target genes, such as Apex1, Nme2, and Cdk4, were classified into group 3, with up-regulation in polyclonal DP cells and even higher expression levels in leukemic DP cells (Figure 2C). Multiple gene sets defining the MYC pathway that include both direct transcriptional targets and interacting proteins consistently showed a high enrichment score in both polyclonal and leukemic DP cells by GSEA and the differential gene expression pattern of group 3 (Figure 2D). To assess the direct targets of Notch1 and Myc, we performed GSEA using new gene sets for the recently defined direct target genes by Margolin et al.14 In this analysis, both the direct targets of Notch1 and Myc were classified into group 1 (supplemental Figure 2). Thus, the continued up-regulation of the more focused Myc targets in leukemic cells appears to be the result of influence or collaborating genetic events necessary for leukemogenesis and not solely up-regulation of Myc activity, which would have been reflected in the much larger number of Myc direct targets.

Up-regulation of the Notch1 pathway at early phase of leukemogenesis and up-regulation of the Myc pathway at early and late phases of leukemogenesis. (A) GSEA histograms for the gene set “NOTCH signaling pathway.” The enrichment score (ES; y-axis) reflects the degree to which a gene set is overrepresented in normal control (N), polyclonal DP cells (P), and leukemic DP cells (L) at the extreme left or right of the entire ranked list. Each solid bar represents 1 gene within a gene set. Heat-map image illustrates gene expression levels of the leading edge subset. The normalized enrichment score (NES) and the nominal P value are indicated. (B) Expression of representative genes (Dtx, Hes1, Ptcra, and Snw1) in the Notch signaling pathway. Significance was evaluated by the Student t test: **P < .01. Data are mean ± SD values of triplicate experiments. (C) Expression of Myc and its targets (Apex1, Nme2, and Cdk4) in each cell. Significance was evaluated by the Student t test: *P < .05, **P < .01. Data are mean ± SD values of triplicate experiments. The NES and the nominal P value are indicated. (D) GSEA histograms for the gene set representing “MYC oncogenic signature.” See panel A description for details of the GSEA histogram.
Up-regulation of the Notch1 pathway at early phase of leukemogenesis and up-regulation of the Myc pathway at early and late phases of leukemogenesis. (A) GSEA histograms for the gene set “NOTCH signaling pathway.” The enrichment score (ES; y-axis) reflects the degree to which a gene set is overrepresented in normal control (N), polyclonal DP cells (P), and leukemic DP cells (L) at the extreme left or right of the entire ranked list. Each solid bar represents 1 gene within a gene set. Heat-map image illustrates gene expression levels of the leading edge subset. The normalized enrichment score (NES) and the nominal P value are indicated. (B) Expression of representative genes (Dtx, Hes1, Ptcra, and Snw1) in the Notch signaling pathway. Significance was evaluated by the Student t test: **P < .01. Data are mean ± SD values of triplicate experiments. (C) Expression of Myc and its targets (Apex1, Nme2, and Cdk4) in each cell. Significance was evaluated by the Student t test: *P < .05, **P < .01. Data are mean ± SD values of triplicate experiments. The NES and the nominal P value are indicated. (D) GSEA histograms for the gene set representing “MYC oncogenic signature.” See panel A description for details of the GSEA histogram.
Besides the Notch1 and Myc pathways, GSEA identified a number of pathways that mediate cell survival, proliferation, or growth that were enriched in polyclonal DP cells. For example, the JAK-STAT signaling pathway was activated in polyclonal DP cells but then down-regulated in leukemic DP cells (group 2; supplemental Figure 3). The PI3K/AKT pathway, nuclear factor-κB (NF-κB) pathway, and cell surface receptor-linked signal transduction (a category that includes cytokine signaling pathways) were up-regulated in polyclonal DP cells compared with normal control (group 1). A gene set termed “proteasome” that includes genes encoding proteasomal proteins was also up-regulated in both polyclonal and leukemic DP cells (group 1).
Down-regulation of tumor suppressors and negative cell cycle regulators in the leukemic DP cells
The development of murine leukemic T cells was characterized predominately by down-regulation of tumor suppressors and negative cell cycle regulators (group 4 or 8; Figure 3; Table 1). The gene sets referred to in the GSEA program as “p53 signaling pathway” and “tumor suppressor” were down-regulated specifically in leukemic DP cells compared with polyclonal DP cells (P < .05; Figure 3A) but were unchanged compared in normal control versus polyclonal DP cells (group 8). This result is consistent with our previous finding that Tp53/p53 activity was down-regulated in this mouse model through down-regulation of the Cdkn2a encoding ARF protein and up-regulation of the Mdm2 protein.8 In addition, the tumor suppressor Pten was down-regulated in polyclonal DP cells as well as in leukemic DP cells (group 4; Figure 3B), whereas other tumor suppressors, such as Apc, Fbxw7, and Ep300, were down-regulated specifically in leukemic DP cells (group 8). Similarly, several negative cell cycle regulators, including Rb1, Cdkn2c, Cdkn2d, and Cdkn3, were specifically down-regulated in leukemic DP cells (group 8; Figure 3C). A consistent finding in this study was that multiple gene sets related to cell cycle regulation were down-regulated in leukemic DP cells compared with polyclonal DP cells, but not in polyclonal DP cells compared with normal controls (see, for example, the gene set “cell cycle arrest” in Figure 3D). To verify the results obtained by microarray analysis, we examined mRNA and protein expression levels of Cdkn2c, Cdkn2d, and Cdk4 genes in mouse DP cells (supplemental Figure 4). Both Cdkn2c and Cdkn2d were specifically down-regulated in leukemic DP cells both at mRNA and protein levels. By contrast, Cdk4 mRNA and protein levels were up-regulated in polyclonal DP cells and further up-regulated in leukemic DP cells. Taken together, these results suggest that pathways negatively regulating cell proliferation are specifically suppressed in the late phase of leukemogenesis.

Down-regulation of tumor suppressors and cell cycle regulators at the late phase of leukemogenesis. (A) GSEA histograms for the gene sets “p53 signaling pathway” and “tumor suppressor.” See Figure 2A description for details on the GSEA histogram. The NES and the nominal P value are indicated. Normal control (N), polyclonal DP cells (P), and leukemic DP cells (L). (B) Expression of Pten, Apc, Fbxw7, and Ep300 at the normal (control), polyclonal DP cells, and leukemic DP cells. Significance was evaluated by the Student t test: *P < .05, **P < .01. Data are mean ± SD values of triplicate experiments. (C) Expression levels of the cell cycle regulators Rb1, Cdkn2c, Cdkn2d, and Cdkn3. Significance was evaluated by the Student t test: *P < .05, **P < .01. Data are mean ± SD values of triplicate experiments. (D) GSEA histogram for the gene set “cell cycle arrest.”
Down-regulation of tumor suppressors and cell cycle regulators at the late phase of leukemogenesis. (A) GSEA histograms for the gene sets “p53 signaling pathway” and “tumor suppressor.” See Figure 2A description for details on the GSEA histogram. The NES and the nominal P value are indicated. Normal control (N), polyclonal DP cells (P), and leukemic DP cells (L). (B) Expression of Pten, Apc, Fbxw7, and Ep300 at the normal (control), polyclonal DP cells, and leukemic DP cells. Significance was evaluated by the Student t test: *P < .05, **P < .01. Data are mean ± SD values of triplicate experiments. (C) Expression levels of the cell cycle regulators Rb1, Cdkn2c, Cdkn2d, and Cdkn3. Significance was evaluated by the Student t test: *P < .05, **P < .01. Data are mean ± SD values of triplicate experiments. (D) GSEA histogram for the gene set “cell cycle arrest.”
Genes and pathways commonly deregulated in both mouse and human T-ALL
To assess whether the gene expression alterations we identified in our mouse model are relevant to human T-ALL, we took advantage of our previously performed gene expression profiling of human cell lines15 and primary samples.18 For this comparison, we analyzed the profiles of NOTCH1-active human T-ALL cells (DMSO-treated cell lines or NOTCH1-mutant primary samples) compared with NOTCH1-inactive cells (GSI-treated cell lines or wild-type primary samples), to identify the genes that were regulated in a NOTCH1-dependent manner. In most of the human T-ALL cell lines, NOTCH1 protein is constitutively activated4,15 ; however, GSI responsiveness in terms of cell cycle arrest and growth inhibition was only observed in a fraction of these T-ALL cell lines, regardless of the NOTCH1 activation status; this resistant mechanism is in part explained by additional irreversible abnormalities, such as genetic deletion or mutation of PTEN or FBXW7.15,24-26 We therefore used the dataset for 4 T-ALL cell lines, all of which show a high sensitivity to GSI (supplemental Figure 5A-B), to select differentially expressed genes in GSI (1 μM)–treated cells versus DMSO-treated controls. Our previous work has shown that knockdown of NOTCH1 by short-hairpin RNA (shRNA) induces changes in gene expression profiles and cell phenotypes that are very similar to GSI treatment in T-ALL cell lines,11 and that GSI phenotypic effects on T-ALL cells can be abrogated by expression of ICN1.4,27 It is possible, however, that some aspects of the signature in GSI-treated human T-ALL cell lines could be the result of effects of GSI on pathways other than those mediated downstream of NOTCH1, and work is ongoing to identify tightly controlled conditional shRNA systems to address this issue. As shown in Figure 4A, 150 genes showed a statistically significant difference (P < .05) in the comparison between GSI-treated cells and DMSO-treated controls. Notably, MYC and its target, such as CDK4 (group 3), and CDKN2D (group 8), were identified by these criteria. We also compared 20 NOTCH1-mutant (MUT) primary T-ALL cases with 14 wild-type (WT) cases (supplemental Table 1, the genetic status of NOTCH1 in each sample). Forty of the genes also showed significance (P < .05) in a comparison of expression levels for primary samples between MUTs and WTs. NOTCH1 activation played a dominant role in these expression differences, as the majority of the genes that were differentially expressed in the primary samples (32 of the 40) are up-regulated in NOTCH1-active cells compared with the GSI-treated samples.

Genes and pathways deregulated in human T-ALL. (A) Heat-map image of differentially expressed genes in human T-ALL. Microarray gene expression profiling was performed on 4 human T-ALL cell lines and 34 primary T-ALL samples. Genes attaining statistical significance (P < .05, fold change ≥ 1.2) were selected and classified into 8 groups based on criteria used to classify genes in the mouse model (Table 1). The selected genes were also analyzed for significant differences in NOTCH1 mutant (MUT) versus wild-type (WT) primary T-ALL samples (20 MUTs vs 14 WTs). Genes that showed significant differences in expression levels in this comparison are indicated: *P < .05, **P < .01. (B) GSEA histograms for human T-ALL cells (cell lines, top; and primary clinical samples, bottom) representing “MYC oncogenic signature.” See the Figure 2A description for details of GSEA. The NES and the nominal P value are indicated. GSI-treated T-ALL cell lines (G), DMSO-treated T-ALL cell lines (D), wild-type primary T-ALL samples (W), and NOTCH1-mutant primary samples (M).
Genes and pathways deregulated in human T-ALL. (A) Heat-map image of differentially expressed genes in human T-ALL. Microarray gene expression profiling was performed on 4 human T-ALL cell lines and 34 primary T-ALL samples. Genes attaining statistical significance (P < .05, fold change ≥ 1.2) were selected and classified into 8 groups based on criteria used to classify genes in the mouse model (Table 1). The selected genes were also analyzed for significant differences in NOTCH1 mutant (MUT) versus wild-type (WT) primary T-ALL samples (20 MUTs vs 14 WTs). Genes that showed significant differences in expression levels in this comparison are indicated: *P < .05, **P < .01. (B) GSEA histograms for human T-ALL cells (cell lines, top; and primary clinical samples, bottom) representing “MYC oncogenic signature.” See the Figure 2A description for details of GSEA. The NES and the nominal P value are indicated. GSI-treated T-ALL cell lines (G), DMSO-treated T-ALL cell lines (D), wild-type primary T-ALL samples (W), and NOTCH1-mutant primary samples (M).
We then performed GSEA on human T-ALL cell lines and primary samples, obtaining 461 significant gene sets (206 enriched in GSI-treated cells and 255 enriched in DMSO-treated control) for the cell lines and 116 (101 enriched in MUTs and 15 enriched in WTs) for the primary samples. Strikingly, the “MYC oncogenic signature” and numerous metabolic pathways were highly enriched in human T-ALL cell lines (DMSO-treated control) and primary cases with a mutant NOTCH1 gene (Figure 4B; data not shown). The gene set designated “cell cycle arrest” also showed an enrichment in the T-ALL cell lines treated with GSI (supplemental Figure 6). These results are consistent with evidence that activation of the MYC pathway and deregulation of cell cycle arrest are critical events for NOTCH1-induced T-ALL.11-13
GSEA and CMAP analyses implicate small-molecule inhibitors
In addition to the MYC pathway, we found by GSEA that the gene set “proteasome” was highly enriched in both T-ALL cell lines and NOTCH1-mutant primary cases (Figure 5A), consistent with the finding in our mouse model (supplemental Figure 3). This result prompted us to examine the effect of pharmacologic inhibition of proteasomes in mouse and human T-ALL cells on cell growth. As shown in Figure 5B, the IC50 values with proteasome inhibitors MG-132 and bortezomib indicated strong activities of these drugs on T-ALL cell lines compared with the other cancer/leukemia cell lines. Interestingly, GSI-sensitive T-ALL cell lines were more sensitive to bortezomib than were GSI-resistant cell lines (P < .05). Notably, the IC50 value for leukemic mouse DP cells was within the range observed for the human T-ALL cell lines. MG-132 administered with the MRK-003 GSI showed synergistic activity against the growth of GSI-sensitive T-ALL cell lines (Figure 5C), but not against that of GSI-resistant lines.
![Figure 5. Up-regulation of proteasome pathway and the growth inhibitory effect of proteasome inhibitors on T-ALL cells. (A) GSEA histograms for human T-ALL cells (cell lines or primary clinical samples) representing the “proteasome pathway.” The NES and the nominal P value are indicated. GSI-treated T-ALL cell lines (G), DMSO-treated T-ALL cell lines (D), wild-type primary T-ALL samples (W), and NOTCH1-mutant primary samples (M). (B) IC50 values with the proteasome inhibitors MG-132 and bortezomib. Mouse leukemic DP cells (mouse T-ALL) were obtained from the mouse after 8 weeks after transplantation of Lin− hematopoietic cells that had been transduced with the ICN1 gene. Mouse T-ALL cells and various types of human leukemia/cancer cell lines were treated for 3 days with a proteasome inhibitor MG-132 (1 mouse T-ALL, 4 GSI-sensitive T-ALL, 4 GSI-resistant T-ALL, 3 acute myeloid leukemia [AML], 4 B-cell non-Hodgkin lymphoma [B-NHL]/multiple myeloma [MM]/chronic lymphocytic leukemia [CLL], 4 neuroblastoma [NBL], and 4 other cancer cell lines) or bortezomib (4 GSI-sensitive T-ALL and 4 GSI-resistant T-ALL). The number of viable cells was measured by the MTT assay, and the IC50 values were calculated for each cell. (C) Synergistic effect of MG-132 in combination with GSI. Three GSI-sensitive and 3 GSI-resistant T-ALL cell lines were treated with or without MG-132 (0.3μM) in the presence or absence of GSI MRK-003 (1μM) for 6 days. The number of viable cells was measured by the MTT assay.](/view-large/figure/7088464/zh89990948370005.jpeg)
Up-regulation of proteasome pathway and the growth inhibitory effect of proteasome inhibitors on T-ALL cells. (A) GSEA histograms for human T-ALL cells (cell lines or primary clinical samples) representing the “proteasome pathway.” The NES and the nominal P value are indicated. GSI-treated T-ALL cell lines (G), DMSO-treated T-ALL cell lines (D), wild-type primary T-ALL samples (W), and NOTCH1-mutant primary samples (M). (B) IC50 values with the proteasome inhibitors MG-132 and bortezomib. Mouse leukemic DP cells (mouse T-ALL) were obtained from the mouse after 8 weeks after transplantation of Lin− hematopoietic cells that had been transduced with the ICN1 gene. Mouse T-ALL cells and various types of human leukemia/cancer cell lines were treated for 3 days with a proteasome inhibitor MG-132 (1 mouse T-ALL, 4 GSI-sensitive T-ALL, 4 GSI-resistant T-ALL, 3 acute myeloid leukemia [AML], 4 B-cell non-Hodgkin lymphoma [B-NHL]/multiple myeloma [MM]/chronic lymphocytic leukemia [CLL], 4 neuroblastoma [NBL], and 4 other cancer cell lines) or bortezomib (4 GSI-sensitive T-ALL and 4 GSI-resistant T-ALL). The number of viable cells was measured by the MTT assay, and the IC50 values were calculated for each cell. (C) Synergistic effect of MG-132 in combination with GSI. Three GSI-sensitive and 3 GSI-resistant T-ALL cell lines were treated with or without MG-132 (0.3μM) in the presence or absence of GSI MRK-003 (1μM) for 6 days. The number of viable cells was measured by the MTT assay.
Up-regulation of proteasome pathway and the growth inhibitory effect of proteasome inhibitors on T-ALL cells. (A) GSEA histograms for human T-ALL cells (cell lines or primary clinical samples) representing the “proteasome pathway.” The NES and the nominal P value are indicated. GSI-treated T-ALL cell lines (G), DMSO-treated T-ALL cell lines (D), wild-type primary T-ALL samples (W), and NOTCH1-mutant primary samples (M). (B) IC50 values with the proteasome inhibitors MG-132 and bortezomib. Mouse leukemic DP cells (mouse T-ALL) were obtained from the mouse after 8 weeks after transplantation of Lin− hematopoietic cells that had been transduced with the ICN1 gene. Mouse T-ALL cells and various types of human leukemia/cancer cell lines were treated for 3 days with a proteasome inhibitor MG-132 (1 mouse T-ALL, 4 GSI-sensitive T-ALL, 4 GSI-resistant T-ALL, 3 acute myeloid leukemia [AML], 4 B-cell non-Hodgkin lymphoma [B-NHL]/multiple myeloma [MM]/chronic lymphocytic leukemia [CLL], 4 neuroblastoma [NBL], and 4 other cancer cell lines) or bortezomib (4 GSI-sensitive T-ALL and 4 GSI-resistant T-ALL). The number of viable cells was measured by the MTT assay, and the IC50 values were calculated for each cell. (C) Synergistic effect of MG-132 in combination with GSI. Three GSI-sensitive and 3 GSI-resistant T-ALL cell lines were treated with or without MG-132 (0.3μM) in the presence or absence of GSI MRK-003 (1μM) for 6 days. The number of viable cells was measured by the MTT assay.
To discover additional therapeutic compounds that might reverse the expression of genes responsible for T-ALL pathogenesis, we performed CMAP analysis,22 which is a pattern-matching algorithm. We applied this analysis to 150 genes shown in Figure 4A (73 up-regulated genes and 77 down-regulated genes in GSI-treated cells vs DMSO-treated controls), which are related to the growth of leukemic cells in both mouse models and human T-ALL cell lines. We compared these shared genes that are deregulated in T-ALL with gene expression data from cultured human cells treated with bioactive small-molecule inhibitors. As shown in Table 2, we identified 23 compounds that exhibited a strong negative correlation (P < .001). Interestingly, multiple instances of HDAC inhibitors, PI3K/AKT/mTOR inhibitors, and HSP90 inhibitors were selected by these criteria. In particular, the expression signatures of the HDAC inhibitor vorinostat, a PI3K inhibitor LY-294002, and a HSP90 inhibitor alvespimycin showed a strong negative correlation (Figures 6A, 7A). The CMAP database included one instance of a proteasome inhibitor, MG-132, that also showed a negative correlation (score −0.51), but statistical significance could not be evaluated because the number of instances was small (data not shown). On the strength of these results, we tested LY-294002 and vorinostat on the growth of T-ALL and other cell lines. As illustrated in Figure 6B, T-ALL cell lines were relatively more sensitive to vorinostat than were the other leukemia/cancer cell lines, and GSI-sensitive T-ALL cell lines were more sensitive to vorinostat than were the GSI-resistant cell lines (P < .05). The reverse trend was observed when the cells were treated with LY-294002. The IC50 value for leukemic mouse DP cells treated with vorinostat was remarkably similar to those of human T-ALL cell lines, whereas the mouse DP cells were more sensitive to LY-294002 than most of the T-ALL cell lines. The combination of LY-294002 with GSI inhibited GSI-resistant lines as strongly as GSI-sensitive lines (Figure 6C). Moreover, combination treatment with vorinostat and GSI synergistically inhibited the growth of GSI-sensitive cell lines, more strongly than GSI-resistant lines (Figure 6D). We also tested the HSP90 inhibitor alvespimycin, which inhibited the growth of human T-ALL cell lines, regardless of GSI sensitivity (Figure 7B), and it did not synergize with GSI in suppressing cell growth (Figure 7C). The IC50 value for leukemic mouse cells treated with alvespimycin was in the range of the most sensitive of the human T-ALL cell lines.

Growth inhibitory effect of the HDAC inhibitor vorinostat and the PI3K inhibitor LY-294002 on T-ALL cell lines. (A) Negative correlation of the T-ALL gene expression signature with vorinostat and LY-294002. CMAP analysis was performed on a T-ALL gene expression signature with 6100 instances of compounds. Green and red represent positive and negative correlation, respectively. Each dataset is indicated by a black bar. (B) IC50 values with the HDAC inhibitor vorinostat and the PI3K inhibitor LY-294002. Mouse leukemic DP cells (mouse T-ALL) and various types of human leukemia/cancer cell lines were treated for 3 days with vorinostat or LY-294002 (1 mouse T-ALL, 4 GSI-sensitive T-ALL, 4 GSI-resistant T-ALL, 3 AML, 4 B-NHL/MM/CLL, 4 NBL, and 4 other cancer cell lines). The number of viable cells was measured by the MTT assay, and IC50 values were calculated for each cell. (C-D) Synergistic effects of LY-294002 and vorinostat in combination with GSI. Three GSI-sensitive and 3 GSI-resistant T-ALL cell lines were treated with or without LY-294002 (10μM; C) or vorinostat (0.3μM; D) in the presence or absence of GSI MRK-003 (1μM) for 6 days. The number of viable cells was measured by MTT assay.
Growth inhibitory effect of the HDAC inhibitor vorinostat and the PI3K inhibitor LY-294002 on T-ALL cell lines. (A) Negative correlation of the T-ALL gene expression signature with vorinostat and LY-294002. CMAP analysis was performed on a T-ALL gene expression signature with 6100 instances of compounds. Green and red represent positive and negative correlation, respectively. Each dataset is indicated by a black bar. (B) IC50 values with the HDAC inhibitor vorinostat and the PI3K inhibitor LY-294002. Mouse leukemic DP cells (mouse T-ALL) and various types of human leukemia/cancer cell lines were treated for 3 days with vorinostat or LY-294002 (1 mouse T-ALL, 4 GSI-sensitive T-ALL, 4 GSI-resistant T-ALL, 3 AML, 4 B-NHL/MM/CLL, 4 NBL, and 4 other cancer cell lines). The number of viable cells was measured by the MTT assay, and IC50 values were calculated for each cell. (C-D) Synergistic effects of LY-294002 and vorinostat in combination with GSI. Three GSI-sensitive and 3 GSI-resistant T-ALL cell lines were treated with or without LY-294002 (10μM; C) or vorinostat (0.3μM; D) in the presence or absence of GSI MRK-003 (1μM) for 6 days. The number of viable cells was measured by MTT assay.

Growth inhibitory effect of the HSP90 inhibitor alvespimycin on T-ALL cell lines. (A) Negative correlation of the T-ALL gene expression signature with alvespimycin. CMAP analysis was performed on a T-ALL gene expression signature with 6100 instances of compounds. Green and red represent positive and negative correlation, respectively. Each dataset is indicated by a black bar. (B) IC50 values with the HSP90 inhibitor alvespimycin. Mouse leukemic DP cells (mouse T-ALL) and various types of human leukemia/cancer cell lines were treated for 3 days with vorinostat or LY-294002 (1 mouse T-ALL, 4 GSI-sensitive T-ALL, 4 GSI-resistant T-ALL, 3 AML, 4 B-NHL/MM/CLL, 4 NBL, and 4 other cancer cell lines). The number of viable cells was measured by the MTT assay, and IC50 values were calculated for each cell. (C) Combination treatment of alvespimycin with GSI. Three GSI-sensitive and 3 GSI-resistant T-ALL cell lines were treated with or without alvespimycin (0.1μM) in the presence or absence of GSI MRK-003 (1μM) for 6 days. The number of viable cells was measured by MTT assay.
Growth inhibitory effect of the HSP90 inhibitor alvespimycin on T-ALL cell lines. (A) Negative correlation of the T-ALL gene expression signature with alvespimycin. CMAP analysis was performed on a T-ALL gene expression signature with 6100 instances of compounds. Green and red represent positive and negative correlation, respectively. Each dataset is indicated by a black bar. (B) IC50 values with the HSP90 inhibitor alvespimycin. Mouse leukemic DP cells (mouse T-ALL) and various types of human leukemia/cancer cell lines were treated for 3 days with vorinostat or LY-294002 (1 mouse T-ALL, 4 GSI-sensitive T-ALL, 4 GSI-resistant T-ALL, 3 AML, 4 B-NHL/MM/CLL, 4 NBL, and 4 other cancer cell lines). The number of viable cells was measured by the MTT assay, and IC50 values were calculated for each cell. (C) Combination treatment of alvespimycin with GSI. Three GSI-sensitive and 3 GSI-resistant T-ALL cell lines were treated with or without alvespimycin (0.1μM) in the presence or absence of GSI MRK-003 (1μM) for 6 days. The number of viable cells was measured by MTT assay.
We examined the effects of these drugs on the cell cycle distribution of human T-ALL cell lines. In the DND41 GSI-sensitive cell line, both vorinostat- and LY-294002–treated cells exhibited a modest increase in G1-phase cells, when used in combination with GSI (supplemental Figure 7). A larger increase in G1-phase population was observed in the SUP-T7 GSI-resistant cell line after the treatment with alvespimycin in combination with GSI. To identify the genes commonly targeted by all 4 classes of compounds, we compared the gene expression profiles in our GSI-treated T-ALL cells with the database of other cancer cells treated with these compounds. As shown in supplemental Table 3, all of these compounds down-regulated the MYC, GRWD1, PUS7, WDR74, PPRC1, POLR3E, and IFRD2 genes and up-regulated the ZNF292 and PDCL gene in both T-ALL and other cell lines, suggesting that these genes are critical mediators of the growth inhibitory effects.
Discussion
NOTCH1 activation is known to play a crucial role in T-ALL pathogenesis. We and others previously identified the transcriptional targets of NOTCH1 in T-ALL cells,11-15 but the signaling pathways that interact with NOTCH1-mediated effects, especially at distinct phases of leukemogenesis, are not completely understood. Pharmacologic inhibition of NOTCH1 by GSI is a therapeutic strategy in T-ALL4,10 ; however, a limited fraction of T-ALL cell lines show sensitivity in terms of the growth inhibitory effect. Therefore, we analyzed gene expression profiles in both human T-ALL and a murine model of this disease to delineate the specific genes and interconnecting molecular pathways that interact with NOTCH1 signaling and to identify novel therapeutic drugs that would synergize with GSIs in T-ALL therapy.
Comparison of gene expression profiles in mouse DP cells collected at each phase with those in GSI-treated human T-ALL cells and primary T-ALL samples showed that the MYC oncogene and its targets were highly up-regulated in both the mouse and human T-ALL cells (Figures 2,4). Interestingly, in the murine model, Myc and its targets were up-regulated by Notch1 activation in polyclonal DP cells, with even higher levels attained in the clonal leukemic DP cells, probably because of loss of function of one or more tumor suppressors. Recently, Margolin et al reported that 92.5% of the gene promoters bound by NOTCH1 are cobound by MYC,14 supporting the hypothesis that NOTCH1 and MYC act coordinately in T-cell transformation.
In our previous report, we demonstrated that the tumor suppressors Tp53/p53 and E2a proteins were down-regulated in this mouse model.8 Here we show that the gene sets “p53 signaling pathway” and “tumor suppressor” are down-regulated in leukemic DP cells (Figure 3A). Interestingly, we found that other tumor suppressors, such as Apc, Fbxw7, and Ep300, were also down-regulated, specifically in leukemic DP cells (Figure 3B). APC is a negative regulator of the Wnt/β-catenin pathway, and it has been reported that this pathway is constitutively activated in T-ALL cells,28 although deletion or mutation of the APC gene itself has not been identified in T-ALL. Loss of APC function suppresses Notch1-dependent transcription in mice, resulting in the disruption of thymic development,29 suggesting that these 2 pathways act in concert to regulate T-cell development. FBXW7 is a ubiquitin ligase that mediates the degradation of target proteins, such as NOTCH1 and MYC proteins. We and others have previously reported that FBXW7 is mutated in 8.6% of primary T-ALL cases and that dysfunction of the FBXW7 protein results in stabilization of the NOTCH1 and MYC proteins.15,26 EP300 encodes a histone acetyltransferase that has been reported to interact with the transcription factors, such as E2A in normal thymocytes.30 We found that the gene expression signature of T-ALL was negatively correlated with that of HDAC inhibitor-treated cells (Figure 6A; Table 2) and that HDAC inhibitors exert a growth inhibitory effect on T-ALL cells (Figure 6B), possibly by compensating for the down-regulation of EP300 in clonal leukemic DP cells in our mouse model.
We also identified the genes involved in regulation of the G1- to S-cell cycle phase transition, such as Rb, Cdkn2c, Cdkn2d, and Cdkn3, which are down-regulated specifically in leukemic DP cells (group 8; Figure 3C; supplemental Figure 4). By contrast, Cdk4 was up-regulated in both the polyclonal and leukemic DP cells in the murine model (group 3; Figure 2C; supplemental Figure 4). Consistently, human CDKN2D was down-regulated and CDK4 was up-regulated in human T-ALL cell lines and primary samples (Figure 4A). Interestingly, up-regulation of CDKN2D and down-regulation of CDK4 by GSI were observed only in the GSI-sensitive lines and not in GSI-resistant lines as reported previously.15 CDK4 protein forms a complex with D-type cyclins and phosphorylates the RB protein, resulting in promotion of cell cycle transition from G1- to S-phase, whereas CDKN2 family proteins inhibit the activity of the CDK4-cyclin complex. We have previously shown that the Cdkn2a/Arf protein is down-regulated in this mouse model.8 In human T-ALL, the CDKN2A gene is heterozygously or homozygously deleted in 65% to 90% of primary cases.31-37 Thus, loss of function of multiple CDKN2s is a common event in both mouse model and in human T-ALL. Our gene expression analysis suggests that disruption of the G1 checkpoint through dysfunction of both the RB1 and CDKN2 proteins, and through the up-regulation of CDK4, is responsible for the clonal expansion of leukemic cells in late phase of leukemogenesis and cell growth. Our recent observation supports this hypothesis, showing that the inhibition of CDK4 activity by a cyclinD1-CDK4 inhibitor (6-substituted indolocarbazole) induces growth arrest of T-ALL cell lines.27
Using GSEA and CMAP analyses, we identified proteasome inhibitors, HSP90 inhibitors, HDAC inhibitors, and PI3K inhibitors as potentially useful drugs with opposing effects on the expression levels of genes deregulated by NOTCH1 in T-ALL. Indeed, human T-ALL cell lines were sensitive to these inhibitors (Figures 5,Figure 6–7); and importantly, the IC50 values for mouse leukemic DP cells treated with these drugs were within the range observed for the human T-ALL cell lines, strengthening our finding that the mouse and human T-ALLs are very similar. Interestingly, the proteasome and HDAC inhibitors synergized with GSIs in suppressing cell growth of human GSI-sensitive cells. Vilimas et al have reported that the proteasome inhibitors can block NF-κB activity in T-ALL cells and synergize with the growth inhibitory effects of GSI.38 It has been reported that NF-κB is constitutively activated in many primary T-ALL cases and cell lines.38,39 NF-κB is activated in concert with NOTCH1 activation,40,41 and NOTCH1 augments NF-κB activity by facilitating its nuclear retention, emphasizing the synergistic activities of these pathways in leukemogenesis. Our finding that the NF-κB pathway is up-regulated with Notch1 in polyclonal DP cells in the mouse model (supplemental Figure 3) supports this interpretation. With respect to HDAC inhibitors, several reports including our own have demonstrated that these drugs can inhibit the growth of T-ALL cells,23,42 but our current study is the first to show synergism between the vorinostat HDAC inhibitor and GSI in T-ALL cells. Notably, the CDKN2D gene is highly up-regulated by the treatment with vorinostat in the leukemia and cancer cell lines included in the CMAP database (data not shown); indeed, treatment with vorinostat induced CDKN2D expression in each of the T-ALL cell lines (supplemental Figure 8). Because CDKN2D is down-regulated in leukemic DP cells in our mouse model and is also highly up-regulated after GSI treatment in human T-ALL cell lines (Figures 3–4),27 it is probable that one of the target genes mediates the synergy between GSI and vorinostat.
In addition to proteasome inhibitors and HDAC inhibitors, PI3K/AKT/mTOR inhibitors also induced gene expression changes that were negatively correlated with the NOTCH1-induced gene expression patterns in murine and human T-ALL. Our GSEA results indicated that the PI3K pathway was already up-regulated in the polyclonal DP cells in our mouse model (supplemental Figure 3) and that Pten, a negative regulator of PI3K/AKT pathway, was down-regulated (group 4; Figure 3B). Hes1 is a Notch1 target gene that is up-regulated in polyclonal DP cells in the murine model (Figure 2B) and is known to transcriptionally repress Pten expression,14,43 suggesting that Pten is down-regulated by Hes1 in the polyclonal phase of T-cell transformation. The PTEN gene is mutationally inactivated or deleted in many primary human T-ALL cases,37,43-45 indicating that loss of PTEN function is a common event in both mouse and human T-ALL. Interestingly, GSI-resistant T-ALL lines were more sensitive to a PI3K inhibitor LY-294002 than were GSI-sensitive lines (Figure 6B); and more importantly, this compound inhibits the growth of all T-ALL cell lines in the presence of GSI, regardless of whether the cells respond to GSI alone (Figure 6C), indicating that LY-294002 overcomes the resistance to GSI in T-ALL cells. Finally, several HSP90 inhibitors showed opposing effects compared with NOTCH1 on gene expression in T-ALL cells (Figure 7A). These inhibitors specifically block the essential ATPase activity of HSP90, a molecular chaperone for multiple signaling proteins, causing destabilization and eventual degradation of the associated client proteins that promote the growth and survival of cancer cells.46 Because we did not observe a synergy between alvespimycin and GSI (Figure 7C), it seems doubtful that alvespimycin is exerting its effects directly through ICN1. It does appear to provide an alternative way to target key pathways, a possibility that warrants further study in T-ALL.
In conclusion, we have identified interconnecting regulatory pathways at different phases of NOTCH1-induced T-cell leukemogenesis. Aberrant expression of NOTCH1 activates multiple pro-survival and proliferation pathways, such as MYC, NF-κB, and PI3K/AKT, in the early phase of transformation. Subsequently, leukemic clones emerge that have disrupted “cell-protective” pathways regulating the G1-S transition, suggesting a key role of loss of function of tumor suppressors in the final step of T-cell leukemogenesis. Detailed analysis of shared alterations in gene expression between the murine model and human GSI-treated T-ALL cell lines implicate proteasome inhibitors, HDAC inhibitors, PI3K inhibitors, and HSP90 inhibitors as molecules that could act synergistically with or substitute for GSI to block the proliferation of T-ALL lymphoblasts.
The online version of this article contains a data supplement.
The publication costs of this article were defrayed in part by page charge payment. Therefore, and solely to indicate this fact, this article is hereby marked “advertisement” in accordance with 18 USC section 1734.
Acknowledgments
The authors thank the children with T-ALL and their families, as well as members of the Children's Oncology Group (COG) Cell Bank and Dana-Farber Cancer Institute Acute Lymphoblastic Leukemia Consortium member institutions, for the samples analyzed in these studies; Drs Rani A. George and Shinsuke Iida for the gifts of cell lines; and John R. Gilbert for editorial review.
This work was supported by the National Cancer Institute (grant 5P01CA109901-040001; A.T.L. and H.v.B) and by the Lymphoma Research Foundation fellowship and the Claudia Adams Barr grant (X.L.). COG cell banking and sample distribution were supported by the COG 9900 cell biology study and grants CA98543 and CA114766.
National Institutes of Health
Authorship
Contribution: T.S. and X.L. designed, performed, and analyzed research and wrote the paper; A.G., Y.A., and J.O. performed research; D.S.N. supervised research and analyzed data; P.R.S. and C.G.W. provided reagent and performed research; S.S.W. and R.S.L. provided vital reagents and analyzed data; and H.v.B. and A.T.L. supervised research and cowrote the manuscript.
Conflict-of-interest disclosure: A.T.L. discloses research support SRA and honoraria from speakers bureau provided by Merck, and patents on Notch mutations and signature filed. J.O., P.R.S., and C.G.W. are employed by Merck & Co Inc, which is developing a GSI. The remaining authors declare no competing financial interests.
Correspondence: Harald von Boehmer, Department of Cancer Immunology and AIDS, Dana-Farber Cancer Institute, 44 Binney St, Smith 736, Boston, MA 02115; e-mail: harald_von_boehmer@dfci.harvard.edu; and A. Thomas Look, Department of Pediatric Oncology, Dana-Farber Cancer Institute, 44 Binney St, Mayer 630, Boston, MA 02115; e-mail: thomas_look@dfci.harvard.edu.