Abstract
Imatinib mesylate has been demonstrated to allow the emergence of T cells directed against chronic myeloid leukemia cells. A total of 10 Philadelphia chromosome–positive acute lymphoblastic leukemia patients receiving high-dose imatinib mesylate maintenance underwent long-term immunological monitoring (range, 2-65 months) of p190BCR-ABL–specific T cells in the bone marrow and peripheral blood. p190BCR-ABL–specific T lymphocytes were detected in all patients, more frequently in bone marrow than in peripheral blood samples (67% vs 25%, P < .01) and resulted significantly associated with lower minimal residual disease values (P < .001), whereas absent at leukemia relapse. Specific T cells were mainly effector memory CD8+ and CD4+ T cells, producing interferon-γ, tumor necrosis factor-α, and interleukin-2 (median percentage of positive cells: 3.34, 3.04, and 3.58, respectively). Cytotoxic subsets able to lyse BCR-ABL–positive leukemia blasts also were detectable. Whether these autologous p190BCR-ABL–specific T cells may be detectable under other tyrosine-kinase inhibitors, expanded ex vivo, and exploited for immunotherapy remains to be addressed.
Introduction
Imatinib mesylate (IM), the treatment of choice for chronic myeloid leukemia (CML), has also been showing efficacy in Philadelphia chromosome–positive acute lymphoblastic leukemia (Ph+ ALL), especially when associated with intensive chemotherapy.1 Furthermore, in Ph+ ALL series and single case reports, prolonged disease-free survival has been observed with IM alone, even in the presence of persisting levels of minimal residual disease (MRD).2,3 Whether these latter results were the consequence of the sole inhibitory activity of IM or, rather, obtained with the contribution of a restored leukemia-specific immune response, it is an issue that has not yet been addressed in the Ph+ ALL setting. An immunosuppressive activity of IM has been suggested both in vitro and in vivo.4-6 However, functional T cells have been reported to frequently develop in CML patients under IM, possibly cooperating with IM for the improved control of the disease.7,8
We prospectively investigated for the presence of p190BCR-ABL–specific T cells in the bone marrow (BM) and peripheral blood (PB) of 10 Ph+ ALL patients on high-dose IM maintenance. In addition, we performed phenotypical and functional characterization of the leukemia-specific T-cell subsets and analyzed the correlation between such antitumor immune responses and MRD data or patients' outcome.
Methods
Patients and samples
A cohort of 10 consecutive Ph+ (p190) ALL patients (patients 1-10) undergoing maintenance therapy with high-dose IM (600-800 mg/d) was studied (median disease-free survival 63 months and overall survival 60% at 48 months). Informed consent was obtained in accordance with the Declaration of Helsinki, and the study was approved by the University of Modena and Reggio Emilia ethical committee. Patients' clinical features are summarized in Table 1. All patients underwent monthly collection of BM and PB samples (for a total of 161 samples) for MRD follow-up. Immunological monitoring was concomitantly performed on some of the samples. BM and PB mononuclear cells (BMMCs and PBMCs) were isolated by Ficoll-Lymphoprep density gradient separation (Axis-Shield PoC AS). MRD values were measured on all BMMC samples by reverse transcriptase-polymerase chain reaction quantification of BCR-ABL transcripts as previously described.9
BCR-ABL–derived peptides and interferon-γ–enzyme-linked immunospot assay immunological screening
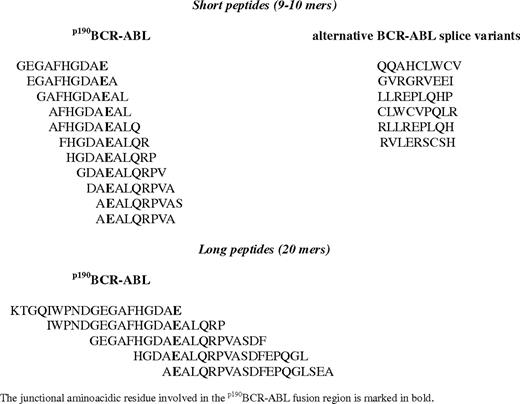
All BCR-ABL–derived peptides were synthesized by SIGMA-Genosys to a minimum purity of 95% and confirmed by mass spectrometry. Mixed pools of 9-, 10-, and 20-mers peptides, deriving from the complete spanning of BCR-ABL (p190) junctional region and alternative splicing, were used as antigens.10,11 In details, 11 short peptides (9-, 10-mers, overlapping 8 amino acids)10 and 5 long peptides (20 mers, overlapping 15 amino acids) were designed to span the entire p190BCR-ABL fusion region (Table 2). Moreover, 6 short peptides (9-mers), deriving from alternative BCR-ABL splice variants, were tested in our series (Table 2).11 All 22 peptides were combined into various mixtures and used as leukemia-specific antigen stimulation for all the immunological assays performed in this study.
Interferon-γ (IFN-γ) enzyme-linked immunospot assay (ELISPOT) experiments were performed by the use of BMMCs or PBMCs collected from the 10 Ph+ ALL patients at several time points. In detail, cells were resuspended in RPMI1640/fetal calf serum 10% (Invitrogen) and cultured at 37°C in a humidified 5% CO2 atmosphere in a 96-well polyvinylidene difluoride–bached plate coated with anti–IFN-γ monoclonal antibody (Mabtech).12 A total of 3 × 10⁵ cells/well were stimulated for 20 hours with separate peptide mixtures, each containing 5 or 6 different BCR-ABL peptides (all peptides used at a final concentration of 10-12 μg/mL) or with a comprehensive BCR-ABL antigenic pool containing all the 22 peptides (each peptide used at a final concentration of 3-5 μg/mL). Unstimulated BMMCs/PBMCs were used as negative controls, whereas phytohemagglutinin (PHA; Sigma-Aldrich) was added to positive control wells at a final concentration of 5 μg/mL. The number of spot-forming cells (SFCs) per well was quantified by the use of an automated ELISPOT counter (AID-GmbH). All test conditions were performed in triplicate, and results were considered positive if the number of SFC/106 cells in BCR-ABL antigen-stimulated wells was 2-fold greater than that in control wells and there were at least 10 spots. Results for individual time points were calculated as a median value of different antigenic stimulations compared with control wells. Statistical associations were analyzed by χ2 test by the use of SPSS-16 (SPSS Inc).
Flow cytometric analysis and cytokine secretion assay on BMMCs
The memory phenotype of BM CD8+ and CD4+ lymphocytes was analyzed by flow cytometry. BMMCs were labeled with different panels of monoclonal antibodies by the use of standard immunostaining protocols. The following mouse anti–human monoclonal antibody conjugates were used: CD3 allophycocyanin (APC), CD4 peridinin chlorophyll A protein (PerCP), CD8 PerCP, CD45RA fluorescein isothiocyanate (FITC), CD62L phycoerythrin (PE), and CCR7 PE. All antibodies were purchased from BD Biosciences. T-cell memory subsets were defined by the use of standard surface markers as previously reported13 : naive T cells were identified by CD62L+CD45RA+, central memory (CM) by CD62L+CD45RA−, effector memory (EM) by CD62L−CD45RA−, and effector memory RA (EMRA) by CD62L−CD45RA+. As a surface marker for T-cell homing, CCR7, also was used instead of CD62L in duplicated experiments. Cells were acquired on a FACSCalibur flow cytometer (BD Biosciences) and analyzed by the use of CellQuest (BD Biosciences). Results from each T-cell subset were expressed as relative percentages on the total of either CD8+ or CD4+ T cells.
The cytokine secretion assay (CSA) for IFN-γ, tumor necrosis factor-α (TNF-α), or interleukin-2 (IL-2) was performed according to the manufacturer's instructions (CSA Detection Kit; Miltenyi Biotec), as already reported.14,15 In brief, 1 × 10⁶ BMMCs were stimulated with BCR-ABL peptides at a final concentrations of 5 μg/mL for 1 to 3 hours. After stimulation, BMMCs were immunostained with IFN-γ, TNF-α, or IL-2 catch reagent for 5 minutes, incubated for 45 minutes at 37°C under continuous rotation, and then labeled with the respective cytokine detection antibody (FITC or APC labeled). The phenotype of the cytokine producing cells was directly assessed after sample counterstaining with CD3 APC, CD8 FITC or PerCP, CD4 PerCP or APC, or CD62L or CCR7 PE, allowing the identification of EM T cells (CD3+, CD8+ or CD4+, CD62L−/CCR7−) or CM T cells (CD3+, CD8+ or CD4+, CD62L+/CCR7+). Unstimulated and PHA-stimulated BMMCs were used as negative and positive controls, respectively. Cells were acquired on a FACSCalibur flow cytometer (BD Biosciences) and analyzed by the use of CellQuest (BD Biosciences) and Summit software (Dako). CD8+ or CD4+ T cells were gated on CD3+ events after passing through a small lymphocyte gate. Frequencies of antigen-reactive EM or CM T cells were calculated as mean differences compared with unstimulated controls. Results were expressed as percentages of BM CD8+ T cells or CD4+ T cells.
BCR-ABL–specific cytotoxic T-lymphocyte analysis
The presence of specific cytotoxic T-lymphocyte (CTL) subsets was evaluated by coculturing patients' BMMCs, obtained from single samples found positive by ELISPOT assay, with BCR-ABL peptide-pulsed autologous dendritic cells,16 at a responder/stimulator ratio of 20:1, in RPMI medium supplemented with 10% fetal calf serum. Dendritic cells were pulsed with a mixture of all available peptides (Table 2) at the same final concentration used for the IFN-γ–ELISPOT assay. Cultures were restimulated on day +7 with 106 BCR-ABL peptide-pulsed, irradiated (3000 rads) autologous PBMCs in the presence of 10 ng/mL IL-7 (R&D Systems) and 20 U/mL IL-2 (Hoffman-La Roche). The autologous PBMCs used as antigen-presenting cells in the different stimulation steps were collected at the same time points of collection of the paired BM samples analyzed. A single PB sample was used to stimulate the single paired BM sample.
On day +13, responder cells, unmanipulated or after CD8+ T cell–positive selection with magnetic microspheres (Miltenyi Biotec), were examined for phenotype and for specificity in a standard 51Cr-release assay against a panel of targets, including autologous mock-pulsed or BCR-ABL peptide-pulsed PHA T-cell blasts (PHA blasts),17 autologous or allogeneic Ph+ ALL blasts, and allogeneic Ph− ALL blasts. PHA blasts, expanded from PBMC samples from the same patients whose allogeneic Ph+ and Ph− blasts were used in the experiments, were obtained by 3- to 6-day incubation with 4 μg/mL PHA and were used as a control for alloreactivity. Target cells were incubated overnight with 51Cr (100 μCi). For the cytotoxicty assay, effector cells were incubated with 103 target cells at effector/target (E:T) ratios from 10:1 to 0.01:1. Results are reported as the percentage specific lysis at different E:T ratios, or as lytic units (LUs). A LU10 was defined as the number of cells required to produce 10% specific lysis by the use of 1 × 10³ labeled target cells.
Monoclonal antibodies used to characterize cultured cells were as follows: anti-CD3 FITC, PE, and PerCP-5y5.5; anti-HLA-DR PE, anti-CD8 FITC, PE, PerCP-Cy 5.5, anti-CD56 PE, anti–T-cell receptor (TCR)-γδ FITC, anti-CD4 PE, PerCP-Cy 5.5, anti-CD19 FITC, anti-CD20 PE, anti-CD45 FITC, anti-CCR7 FITC, and anti-CD45RA PE (Becton Dickinson); anti-foxP3 PE (eBioscence); anti Vβ 1, 2, 3, 4, 5.1, 5.2, 5.3, 7.1, 7.2, 9, 11, 12, 13, 13.2, 13.6, 14, 16, 17, 18, 20, 21.3, and 22 (Beckman Coulter); and anti Vβ 6.7 (Valter Occhiena).
Results
p190BCR-ABL–specific T cells resident in the BM correlate with MRD in patients with Ph+ ALL undergoing IM treatment
The ELISPOT assay allowed the detection of p190BCR-ABL–specific IFN-γ–producing T cells in 67% of the BM samples tested (response range, 20-350 SFC/106 cells), from 10 of 10 (100%) Ph+ ALL patients (Figure 1) but not from any of the 4 control Ph− ALL patients (data not shown). These responses were associated with MRD values lower than 10−3 in a statistically significant manner (P < .001). Furthermore, the dynamics of BM p190BCR-ABL–specific T cells appeared to inversely correlate with the kinetics of MRD by showing (1) increased or sustained number of specific T cells with stable or decreasing MRD values (patients 1-6, 10); and (2) decreased number or absence of specific T cells with growing MRD values (patients 3, 4, 6, 9) or with molecular or hematologic relapse (patients 3 and 6, respectively; Figure 1).

Immunological monitoring of p190BCR-ABL–specific memory T-cell responses in the BM from 10 Ph+ ALL patients on IM alone and correlation with the disease course. Longitudinal data tracking MRD kinetics (right, y-axis; red) and IFN-γ–ELISPOT responses (left, y-axis, blue) are summarized in a single time-course graph for each patient. On each patient's graph, representative memory BM T-cell profiles are also depicted over the related time points (indicated by asterisks). T-cell memory subsets were defined as following: CD62L−CD45RA− (EM, dark blue), CD62L−CD45RA+ (EMRA, light blue), CD62L+CD45RA− (CM, yellow), CD62L+CD45RA+ (naive T cells, white). Data for each subset are expressed as relative percentages on the total of either CD8+ or CD4+ T cells.
Immunological monitoring of p190BCR-ABL–specific memory T-cell responses in the BM from 10 Ph+ ALL patients on IM alone and correlation with the disease course. Longitudinal data tracking MRD kinetics (right, y-axis; red) and IFN-γ–ELISPOT responses (left, y-axis, blue) are summarized in a single time-course graph for each patient. On each patient's graph, representative memory BM T-cell profiles are also depicted over the related time points (indicated by asterisks). T-cell memory subsets were defined as following: CD62L−CD45RA− (EM, dark blue), CD62L−CD45RA+ (EMRA, light blue), CD62L+CD45RA− (CM, yellow), CD62L+CD45RA+ (naive T cells, white). Data for each subset are expressed as relative percentages on the total of either CD8+ or CD4+ T cells.
The BM p190BCR-ABL–specific T cells were absent at the time of the Ph+ ALL diagnosis in patients 7 (October 2008) and 10 (June 2009). The specific T cells were detectable after 32 (November 2005), 75 (April 2007), 36 (November 2008), 53 (May 2008), and 78 (September 2009) days in patients 2, 4, 7, 8, 10, respectively, all undergoing IM since the diagnosis and obtaining complete remission (Figure 1). In pt 6, BM p190BCR-ABL–specific T cells were absent on day 72 (April 2005) after the induction chemotherapy, while were detectable as early as 21 days (July 2005) after the administration of IM as maintenance treatment (Figure 1).
In the remaining 4 patients (patients 1, 3, 5, 9) the first BM sample was studied for the presence of specific T cells only after a median of 24 months (range, 14-35 months) from the diagnosis of leukemia (Figure 1). The p190BCR-ABL–specific T cells were detectable in BM for a median of 12.2 months (range, 1-46 months). Conversely, p190BCR-ABL–specific IFN-γ–producing T cells were detected in 25% of the paired PB samples tested (P < .01) and at lower frequencies (range, 20-100 SFC/106 cells).
Phenotypic and functional characterization of p190BCR-ABL–specific T cells resident in BM
BM cytofluorimetric analysis showed the predominant presence of either EM or EMRA CD8+ subsets and of either CM or naive CD4+ subsets (Figure 1). Interestingly, in patient 1, the EMRA subset accounted for 90% of CD8+ T cells. A detailed functional characterization of p190BCR-ABL–specific lymphocytes showed robust IFN-γ production in all patients (median percent positive cells, 4.9; range, 0.1-12), mediated mainly by CD8+ EM T cells and by CD4+ EM and CM lymphocytes (Figure 2). Likewise, IL-2 production was almost equally distributed between CD8+ and CD4+ T cells. Moreover, specific TNF-α production was demonstrated in 9 patients as the result of either CD8+ or CD4+ T EM subsets (Figure 2).

Analysis of cytokine profile by p190BCR-ABL–specific BM T cells. The frequencies of p190BCR-ABL–specific BM T cells producing IFN-γ, TNF-α, or IL-2, either as EM (dark bars) or CM (light bars), are shown as median percent positive cells, computed over all 10 patients. Results are expressed as percentages of CD8+ T cells (left) or CD4+ T cells (right). In addition, median magnitudes of specific cytokine-producing T cells for individual patients are reported on each column, either as EM (□) or CM (○). CD8+ or CD4+ T cells were gated on CD3+ events after passing through a small lymphocyte gate. Percentages of antigen-reactive EM or CM T cells were calculated as mean differences over unstimulated controls according to CSA methods.
Analysis of cytokine profile by p190BCR-ABL–specific BM T cells. The frequencies of p190BCR-ABL–specific BM T cells producing IFN-γ, TNF-α, or IL-2, either as EM (dark bars) or CM (light bars), are shown as median percent positive cells, computed over all 10 patients. Results are expressed as percentages of CD8+ T cells (left) or CD4+ T cells (right). In addition, median magnitudes of specific cytokine-producing T cells for individual patients are reported on each column, either as EM (□) or CM (○). CD8+ or CD4+ T cells were gated on CD3+ events after passing through a small lymphocyte gate. Percentages of antigen-reactive EM or CM T cells were calculated as mean differences over unstimulated controls according to CSA methods.
p190BCR-ABL–specific T cells resident in BM include cytotoxic subsets able to recognize autologous leukemia blasts
To further ascertain the functional characteristics of the Ph+ ALL antigen response, we evaluated the presence of specific cytotoxic T-cell subsets within the BMMC samples previously analyzed. Time points analyzed in the assay were calculated from the start of the treatment with IM and were as follows: patient 1, day 810 (February 2006); patient 2, day 152 (March 2006); patient 3, day 623 (March 2006); patient 4, day 75 (April 2007); patient 5, day 1130 (December 2005); patient 6, day 21 (July 2005); patient 7, day 36 (November 2008); patient 8, day 53 (May 2008); patient 9, day 1071 (May 2005); patient 10, day 78 (September 2009).
The 13-day cultures tested for lytic activity included a median 83% CD4+ T cells (95% confidence interval [CI], 70-90) with EM phenotype (median and 95% CI, 49%, 16-60), and 10% CD8+ T cells (95% CI, 7-26) with EMRA phenotype (median and 95% CI, 43%, 29-65).
BM-derived T cells showed a p190BCR-ABL–specific lytic activity greater than 100 LU10/106 in 7 of the 10 patients (median lysis against p190-derived peptide-pulsed targets: 1355 LU10/106; Figure 3A). Specific cytotoxicity was mediated by both CD8+ and CD4+ T cells (supplemental Figure 1, available on the Blood website; see the Supplemental Materials link at the top of the online article). All patients were tested at a time when specific T-helper activity was detectable in the BM. Thus, we tried to analyze the reasons for the absent/low cytotoxicity observed in patients 4, 5, and 8. We could not find any correlation with memory T-cell subsets or relative numbers of CD4/CD8 T or natural killer cells. However, analysis of regulatory T cells, performed on 6 of the 10 patients, showed median CD4/FoxP3+ and CD8/FoxP3+ percentages of 1% and 0%, respectively (range, 0%-4% for both subsets) in the 5 patients with p190BCR-ABL–specific lytic activity greater than 100 LU10/106, whereas in patient 4, who had a specific cytotoxicity of 10 LU10/106, CD4/FoxP3+ and CD8/FoxP3+, T cells were 6% and 45%, respectively.

Cytolytic activity exerted by p190BCR-ABL–specific BM T cells. (A) Cytotoxic activity of BMMCs after 13-day culture in the presence of p190BCR-ABL–derived peptides against autologous PHA blasts pulsed with p190BCR-ABL peptides (n = 10), autologous Ph+ ALL blasts (n = 3), autologous Ph+ ALL blasts after incubation with anti-HLA class I monoclonal antibody (W6/32, Dako; n = 2), allogeneic Ph+ ALL blasts (n = 4), allogeneic PHA blasts from the donor of the allogeneic Ph+ blasts (alloPHA*, n = 3), allogeneic Ph− ALL blasts (n = 6), and allogeneic PHA blasts from the donors of the allogeneic Ph− blasts (alloPHA**, n = 5). The results are represented as the number of lytic units per 106 cells (LU10/106) and reported for each patient and as median. The LU values referring to lysis of autologous PHA blasts pulsed with p190BCR-ABL peptides were calculated after subtraction of background, consisting of cytotoxicity against autologous PHA blasts pulsed with irrelevant peptides. (B) Cytotoxicity profile of cultured BMMCs obtained from patient 6. The figure reports the percentage of specific lysis against autologous PHA blasts pulsed with p190BCR-ABL peptides (dotted line, ●) or with control peptides (dotted line, ○), autologous Ph+ ALL blasts (solid line, ■), allogeneic Ph− ALL blasts (solid line, ▴), and allogeneic PHA blasts from the same donor of Ph− blasts (solid line, ▵). The mean percentage of lysis of duplicate wells for 4 different effector-to-target (E:T) ratios is shown.
Cytolytic activity exerted by p190BCR-ABL–specific BM T cells. (A) Cytotoxic activity of BMMCs after 13-day culture in the presence of p190BCR-ABL–derived peptides against autologous PHA blasts pulsed with p190BCR-ABL peptides (n = 10), autologous Ph+ ALL blasts (n = 3), autologous Ph+ ALL blasts after incubation with anti-HLA class I monoclonal antibody (W6/32, Dako; n = 2), allogeneic Ph+ ALL blasts (n = 4), allogeneic PHA blasts from the donor of the allogeneic Ph+ blasts (alloPHA*, n = 3), allogeneic Ph− ALL blasts (n = 6), and allogeneic PHA blasts from the donors of the allogeneic Ph− blasts (alloPHA**, n = 5). The results are represented as the number of lytic units per 106 cells (LU10/106) and reported for each patient and as median. The LU values referring to lysis of autologous PHA blasts pulsed with p190BCR-ABL peptides were calculated after subtraction of background, consisting of cytotoxicity against autologous PHA blasts pulsed with irrelevant peptides. (B) Cytotoxicity profile of cultured BMMCs obtained from patient 6. The figure reports the percentage of specific lysis against autologous PHA blasts pulsed with p190BCR-ABL peptides (dotted line, ●) or with control peptides (dotted line, ○), autologous Ph+ ALL blasts (solid line, ■), allogeneic Ph− ALL blasts (solid line, ▴), and allogeneic PHA blasts from the same donor of Ph− blasts (solid line, ▵). The mean percentage of lysis of duplicate wells for 4 different effector-to-target (E:T) ratios is shown.
We then proceeded to assess whether the p190BCR-ABL–specific cytotoxic T cells resident in the BM of patients receiving IM treatment had the ability to recognize and kill leukemia blasts. In 3 of the patients for whom autologous Ph+ ALL blasts were available, we could demonstrate a strong leukemia-directed lytic activity (median lysis, 10 000 LU10/106; Figure 3A-B). The lysis directed toward autologous blasts was mainly mediated by CD8+ T cells and was human leukocyte antigen (HLA) class I–restricted, as demonstrated by inhibition with anti-HLA class I monoclonal antibody (Figure 3A). In 4 additional patients for whom autologous blasts were not available, we evaluated the response against allogeneic Ph+ blasts. A median lysis of 750 LU10/106 was observed, which was not likely ascribable to alloreactivity because PHA blasts from the same donors from whom the tested allogeneic Ph+ blasts were isolated were not killed (Figure 3A).
For 3 of the 4 patients tested against allogeneic Ph+ blasts, the lysis observed could have been mediated by HLA A2–restricted (patient 2) or HLA-DRB1 13–restricted (patients 1 and 5) T cells, whereas, in the case of patient 9, lysis toward the allogeneic Ph+ blasts was HLA-unrestricted because the patient and the Ph+ blast donor were complete HLA mismatched (Figure 3A; supplemental Table 2). Finally, we observed only modest or absent lysis of allogeneic Ph− blasts, comparable with the killing of allogeneic PHA blasts from the same donors (median values, 25 LU10/106 and 50 LU10/106, respectively) and significantly lower than cytotoxicity toward autologous PHA blasts pulsed with p190BCR-ABL peptides, autologous Ph+ blasts, or allogeneic Ph+ blasts (P < .05, P < .05, and P < .01, respectively; Figure 3A).
TCR analysis on BMMCs at baseline and after stimulation with p190BCR-ABL peptides, conducted in 5 patients, showed expansion of multiple Vβ families, indicating polyclonality of the cytotoxic populations (Figure 4).

TCR Vβ analysis of precultured BMMCs and the derived 13-day culture from patient 1. Cytofluorimetric analysis of 6 Vβ families in BMMCs and the derived p190BCR-ABL–stimulated 13-day culture are shown. The presence of expanded populations within Vβ 1, Vβ 2, Vβ 5.1, Vβ 6.7, and Vβ 13 demonstrates polyclonality of the response driven by the antigen.
TCR Vβ analysis of precultured BMMCs and the derived 13-day culture from patient 1. Cytofluorimetric analysis of 6 Vβ families in BMMCs and the derived p190BCR-ABL–stimulated 13-day culture are shown. The presence of expanded populations within Vβ 1, Vβ 2, Vβ 5.1, Vβ 6.7, and Vβ 13 demonstrates polyclonality of the response driven by the antigen.
Discussion
In this study, we used IFN-γ–ELISPOT analysis, CSA, and cytolytic assay to identify and functional characterize CD8+ and CD4+ T-cell responses against p190BCR-ABL antigens in patients with Ph+ ALL during IM treatment.
The identified p190BCR-ABL–specific T cells were (1) mainly present in BM; (2) significantly associated with lower MRD values; (3) frequently present at sustained levels for several months; (4) CD8+ or CD4+ memory T cells, able to produce T-helper 1 cytokines; and (5) able to mediate leukemia-specific lysis.
To date, studies describing cellular immunity against ALL have been performed mainly in the allogeneic stem cell transplantation setting, where antileukemia responses directed against Wilms tumor antigen-1 and preferentially expressed antigen of melanoma were observed only in patients' PB.18,19 Tumor-specific T cells present in BM have so far been reported only in patients with acute myeloid leukemia, multiple myeloma, as well as solid tumors.15,20-23
This study shows for the first time that antileukemia T-cell responses may develop either in BM or PB in patients with Ph+ ALL who are undergoing IM treatment. The greater frequency of leukemia-specific immune responses in BM than in PB (67% vs 25%, P < .01) may be related to the fact that BM represents the site of primary pathology and may be favored by a continuous apoptosis process, induced by IM on residual BM Ph+ leukemia cells.7,18,24 Furthermore, BM has been described as a preferential homing site for either antiviral or antitumor memory immune responses.20,22,25
The association of the p190BCR-ABL–specific T lymphocytes with MRD values lower than 10−3, their temporal dynamics, which frequently correlate with changes in MRD values, and their absence at the molecular or hematologic relapse may suggest that these antileukemia responses play a role in the maintenance of remission, possibly cooperating with IM, as recently reported in CML patients on IM.7
Of note, in the study by Chen et al,7 anti-CML T-cell responses became detectable in patients' PB early in remission (3-8 months), were sustained for months, and their decrease at 24 to 46 months coincided with molecular response. The detection of specific T cells at a median of 55 days (range, 32-78 days) since the start of induction treatment with IM in our patient series seems to suggest that p190BCR-ABL–specific immune responses also may be present early in remission in the Ph+ ALL setting, albeit in BM rather than in PB. The unsuccessful detection of such an immune response at the time of Ph+ ALL diagnosis in the 2 tested patients may be related to the complete BM substitution by leukemic blasts, either impairing the emergence of p190BCR-ABL–specific T cells or reducing their frequencies under the sensitivity threshold of our assay. Moreover, the outcome of patients 1 to 5 suggests that leukemia-specific responses also may be long lasting in Ph+ ALL. Indeed, BM p190BCR-ABL–specific lymphocytes were detectable as late as 60 months after complete molecular remission (patient 1; Figure 1).
Cytofluorimetric analysis showed the predominance of memory T-cell subsets in the BM, namely EM within CD8+ and CM within CD4+ populations, and revealed a rather normal memory T-cell profile.26 This observation suggests that in Ph+ ALL patients in complete remission the normal differentiation, recirculation, and activation potential of BM T lymphocytes do not appear to be negatively affected, even during high-dose IM. In patient 1, who showed sustained complete molecular remission, the almost-exclusive presence of the EMRA subset among BM CD8+ T cells may possibly be consistent with the notion that EMRA T cells appear late during the immune response and proliferate in the absence of the antigen.27,28
The cytokine production profile demonstrated by the p190BCR-ABL–specific T cells is also partially in line with what was observed in CML patients treated with IM,7 having revealed the presence of specific T cells producing not only IFN-γ but also IL-2 and TNF-α. However, in our patients, cytokine-secreting cells included CD8+ T cells in addition to CD4+ lymphocytes.7 Likewise, the p190BCR-ABL–specific cytotoxic T cells identified in the patients' BM included both CD8+ and CD4+ lymphocytes, although the activity toward autologous leukemia blasts was mostly mediated by CD8+, HLA class I–restricted T cells. When allogeneic Ph+ blasts were used as targets, we also could depict a response that was likely mediated by HLA DRB1 13–restricted CD4+ T cells, although we have not yet been able to identify the specific epitope involved in this response. The 13-day in vitro stimulation with the antigen, with the addition of homeostatic cytokines on day +7, was designed to provide sufficient expansion of p190BCR-ABL–specific T cells, which we hypothesized to be present at low frequencies in patients' BM, to attempt a cytotoxicity assessment. Clearly, the short culture time did not allow either complete loss of alloreactive T cells, whose baseline frequencies are usually 2 to 3 log greater than leukemia-reactive responses, or the selection of best-fit T cells at the expense of low-affinity lymphocytes, as suggested by the presence of HLA-unrestricted T cells in some patients. However, as indicated by TCR Vβ analysis, a polyclonal expansion of antigen-specific T cells was attained. Interestingly, analysis of regulatory T-cell subsets, although incomplete, because of the exiguity of sampling, suggests that the absence of specific cytotoxicity observed in 3 of the patients could be attributable to the presence of CD4+/FoxP3+ and CD8+/FoxP3+ T cells.
Because of the small cohort analyzed, to the use of peptide mixtures, and the fact that each single pool did not result in being more immunogenic than the others, we could identify neither a shared HLA type in the patients with detectable p190BCR-ABL specific T-cell responses nor a possible peptide dominant motif. Nonetheless, our approach, by offering the advantage of documenting antileukemic specific T cells irrespective of patients' HLA types, may allow a wider monitoring of Ph+ ALL patients and may spur further studies to investigate the best candidate vaccine peptide or peptide pools.
In conclusion, our findings demonstrated that p190BCR-ABL antileukemia T-cell responses, predominantly found in BM, may emerge in patients with Ph+ ALL under IM treatment. The specific T cells possibly synergize with IM for remission maintenance because they are associated with lower MRD values and directly mediate specific lysis of Ph+ leukemic blasts. Additional studies on larger cohorts are warranted to confirm our results and further clarify whether these p190BCR-ABL–specific T cells may arise under other tyrosine-kinase inhibitors and have a possibly therapeutic role in Ph+ ALL patients.
The online version of this article contains a data supplement.
The publication costs of this article were defrayed in part by page charge payment. Therefore, and solely to indicate this fact, this article is hereby marked “advertisement” in accordance with 18 USC section 1734.
Acknowledgments
This study was supported by grants from the Associazione Italiana per la Ricerca sul Cancro (AIRC), Milan, Italy (to M.L., P.C., and F.L.); the Associazione Italiana Lotta alle Leucemie, Linfoma e Mieloma (AIL)–Sezione “Luciano Pavarotti”–Modena-ONLUS (to L.P. and F.F.); Ministero dell'Istruzione, Università e della Ricerca (MIUR; to F.L.); Regione Lombardia (to F.L.) and the Programma di ricerca Regione-Università (PRU 2007–2009) Emilia Romagna (to G.T.); Ministero della Salute, Progetti Ricerca Oncologica (RFPS-2006–4-341763 and RFPS-2006–2-340145 [to F.L.], RFPS-2006-Regione Umbria [to P.C. and F.L.]); Fondazione IRCCS (Istituto di Ricovero e Cura a Carattere Scientifico) Policlinico San Matteo (to F.L.); and Società Italiana Ematologia Sperimentale (SIES; fellowship to L.P.).
Authorship
Contribution: G.R., M.L., P.B., P.C., and L.P. conceived and designed the study, analyzed results, and wrote the manuscript; G.R., P.B., C.Q., S.B., D.V., E.Z., C.D., and R.D. processed samples, executed experiments, and performed statistical analysis; G.R., M.L., M. Morselli, F.F., M. Maccaferri, F.V., and L.P. provided clinical care, collected patient data, and commented on the manuscript; and F.L. and G.T. supervised the study and critically revised the manuscript.
Conflict-of-interest disclosure: The authors declare no competing financial interests.
Correspondence: Mario Luppi, University of Modena and Reggio Emilia, Department of Oncology, Hematology and Respiratory Diseases, Via Del Pozzo 71 Modena 41100, Italy; e-mail: mario.luppi@unimore.it; or Patrizia Comoli, University of Pavia, Department of Pediatrics, Laboratory of Immunology, Pediatric Hematology Unit, Istituto di Ricovero e Cura a Carattere Scientifico (IRCCS), Policlinico San Matteo, P.le Golgi 2 Pavia 27100, Italy; e-mail: pcomoli@smatteo.pv.it.