Abstract
Human cancers, including acute myeloid leukemia (AML), commonly display constitutive phosphoinositide 3-kinase (PI3K) AKT signaling. However, the exact role of AKT activation in leukemia and its effects on hematopoietic stem cells (HSCs) are poorly understood. Several members of the PI3K pathway, phosphatase and tensin homolog (Pten), the forkhead box, subgroup O (FOXO) transcription factors, and TSC1, have demonstrated functions in normal and leukemic stem cells but are rarely mutated in leukemia. We developed an activated allele of AKT1 that models increased signaling in normal and leukemic stem cells. In our murine bone marrow transplantation model using a myristoylated AKT1 (myr-AKT), recipients develop myeloproliferative disease, T-cell lymphoma, or AML. Analysis of the HSCs in myr-AKT mice reveals transient expansion and increased cycling, associated with impaired engraftment. myr-AKT–expressing bone marrow cells are unable to form cobblestones in long-term cocultures. Rapamycin, an inhibitor of the mammalian target of rapamycin (mTOR) rescues cobblestone formation in myr-AKT–expressing bone marrow cells and increases the survival of myr-AKT mice. This study demonstrates that enhanced AKT activation is an important mechanism of transformation in AML and that HSCs are highly sensitive to excess AKT/mTOR signaling.
Introduction
The phosphoinositide 3-kinase (PI3K)/AKT pathway is central to many biologic processes, including insulin metabolism, protein synthesis, proliferation, and apoptosis. Activated growth factor receptors recruit PI3K to the plasma membrane, allowing for the phosphorylation of phosphoinositides (PIP) and conversion of PIP2 to PIP3. Proteins containing pleckstrin homology domains, such as Akt, bind PIP3 lipid products and become associated with the plasma membrane. This membrane localization allows for kinases, such as PDK1 and mammalian target of rapamycin (mTOR), to phosphorylate and activate AKT. Akt, a serine/threonine kinase, is the major effector of the PI3K signaling pathway, and many of its substrates regulate cell survival and growth.1 Most significantly, dysregulation of the PI3K kinase/AKT pathway has been implicated in many human malignancies. For example, activating mutations in PIK3CA, the gene encoding the α catalytic subunit of PI3 kinase, have been identified in a variety of human tumors, such as breast, lung, and colon carcinomas.2 The same activating mutations in PI3 kinase can confer factor-independent growth and leukemogenic potential to hematopoietic cells.3 An activating mutation in the pleckstrin homology domain of AKT was recently found in breast, colon, and ovarian tumors, and cooperates with Eμmyc in a mouse model of leukemia.4 However, similar mutations in PI3 kinase or AKT have not been identified in acute myeloid leukemia (AML).5,6 Nevertheless, the constitutive phosphorylation of AKT has been detected in a large proportion of primary AML patient samples.7-10 In a subset of those cases, it has been shown that somatic mutations in tyrosine kinases, such as FLT3-ITD and BCR-ABL, are responsible for AKT activation, whereas in other cases the genetic basis for AKT activation is not known.11 Despite the prevalence of AKT phosphorylation in AML, it is not known whether AKT acts as a mediator of transformation or progression in this disease.
Mice with conditional hematopoietic-specific deletion of phosphatase and tensin homolog (Pten), a phosphatase that antagonizes Pi3k/Akt signaling, develop a myeloproliferative disease (MPD) that can progresses to both AML and T-cell acute lymphoblastic leukemia (T-ALL) over several weeks.12,13 Paradoxically, the hematopoietic stem cells (HSCs) in these mice are driven into the cell cycle and become depleted. Rapamycin rescues this stem cell defect and prevents the development of leukemia in Pten-deficient mice.12 Interestingly, a similar myeloproliferative phenotype and depletion of the stem cell pool occur with combined conditional deletion of forkhead box, subgroup O (FOXO) 1, 3, and 4 in the hematopoietic lineage.14,15 The FoxO transcription factors regulate quiescence, apoptosis, and cellular response to oxidative stress and are degraded after phosphorylation by activated AKT. Mice with FoxO deletions do not develop AML but do develop T-cell lymphoma after several months. Furthermore, deletion of tuberous sclerosis protein 1 (TSC1), which leads to activation of mTOR signaling, causes rapid cycling of HSCs and a buildup of reactive oxygen species, and reduces HSC self-renewal.16 The contrasts between these phenotypes, particularly in the incidence of leukemia, suggest that Pten deletion may affect alternative downstream mediators of the PI3K/AKT pathway, or a parallel pathway, to induce AML. Similarly, FOXO is regulated by other pathways independently of PI3K/AKT.17 Therefore, the specific role of AKT in leukemogenesis and HSC homeostasis has remained elusive. All of these mouse models suggest that the PI3K/AKT pathway may play an important role in both normal hematopoiesis and leukemic transformation. However, Pten, FOXO, and TSC1 deletions are not commonly detected in human AML, whereas pathologic phosphorylation of AKT is highly prevalent.
We have generated a model system using constitutively active AKT to more closely mimic what has been observed in human AML. We introduced a myristoylated allele of AKT1 (myr-AKT) into HSCs via retroviral transduction of bone marrow (BM) cells and subsequent transplantation. Our results demonstrate that activated AKT contributes to the induction of MPD, AML, and T-cell lymphoma. Furthermore, functional phenotypic analysis of HSC-enriched populations reveals that tight regulation of AKT signaling is crucial for the maintenance of hematopoietic stem cells. Using rapamycin in vitro and in vivo, we also demonstrate that mTOR is an important mediator of myr-AKT function, both in the regulation of HSC self-renewal and in the progression of T-cell lymphoma.
Methods
Plasmid preparation and viral supernatant production
Ba/F3 cells were maintained in RPMI 1640 media with 10% fetal calf serum and either interleukin-3 (IL-3; 0.5 ng/mL; R&D Systems) or WEHI-3 conditioned media (Walter and Eliza Hall Institute) as a source of IL-3. Retroviral stocks were generated from transfection of 293T cells, and viral titers were determined as previously described.18 The myr-AKT1 cDNA was subcloned into the EcoRI site of the MSCV-IRES-green fluorescent protein (GFP) vector. myr-AKT-IRES-GFP and IRES-GFP retroviral supernatants were produced in 293T cells using the Fugene system (Roche Diagnostics) as previously described.18
Retroviral BMT assay
All mice were housed in a pathogen-free animal facility in microisolator cages, and experiments were conducted based on a protocol approved by the Institutional Animal Care and Use Committee. Murine bone marrow transplantation (BMT) experiments were performed as previously described.18 Wild-type 6- to 8-week-old C57 Bl/6 donor mice were given a single intraperitoneal injection of 5-fluorouracil (Sigma-Aldrich) at 0.15 mg/g body weight on day −8. The donor mice were killed at day −2, and BM was harvested. After treatment with RBC lysis buffer (Puregene), the BM was stimulated overnight in RPMI/10% fetal bovine serum with murine IL-3, IL-6, and stem cell factor. The BM was then transduced twice with the retroviral supernatant. Six- to 8-week-old C57 Bl/6 recipient mice were lethally irradiated with 2 doses of irradiation at 650 cGy on day 0, and then 106 donor BM cells were injected into the tail vein of each mouse. For secondary transplantations, 106 splenocytes or thymocytes from myr-AKT primary transplantation mice were injected into the tail veins of sublethally irradiated 6- to 8-week-old C57 Bl/6 recipient mice. After BMT with myr-AKT-ER-Thy1.1 or empty-Thy1.1 retrovirus, myr-AKT expression was induced with 1 mg of tamoxifen (Sigma-Aldrich) dissolved in sunflower oil and injected intraperitoneally daily for 3 days starting at 4 weeks after transplantation. For in vivo rapamycin treatment, rapamycin (LC Laboratories) was dissolved in ethanol, diluted in vehicle solution (5% Tween 80, 5% PEG-400 in phosphate-buffered saline), and then injected intraperitoneally at 4 mg/kg mouse daily, starting at 4 weeks after transplantation.
Flow cytometry
BM cells, splenocytes, and thymocytes were harvested and subjected to red cell lysis. Fresh or frozen cells were stained with the following antibodies: Mac1-PE, Gr1-APC, c-Kit-APC, CD71-PE, Ter119-APC, B220-PE, and T-cell receptor-β-APC (BD Biosciences) and analyzed on the BD FACSCalibur instrument. Reactive oxygen species (ROS) levels were measured by sorting Lin−c-kit+Sca1+ (LSK) cells or progenitors and then staining with 5μM 2′-7′-dichlorofluorescein diacetate (DCF-DA; Molecular Probes). Staining for multiparameter flow cytometry was performed as previously described,15 and the cells were analyzed on the BD FACSAria instrument.
Colony-forming assays
BM and spleen cells were harvested, subjected to red-cell lysis, and resuspended in Iscove modified Dulbecco medium/10% fetal bovine serum/5% penicillin-streptomycin. Cells were plated in duplicate in M3434 methylcellulose media (StemCell Technologies) at 104 cells/dish for BM and 5 × 10⁴ cells/dish for spleen cells. Colonies were scored after 7 days. If at least 25 colonies were observed per dish, the cells were replated in M3434 media at 104 cells/dish and then counted and replated every 7 days.
Western blotting
Whole-cell protein lysates were prepared from Ba/F3 cells or from single-cell suspensions of splenocytes and thymocytes from myr-AKT mice and from age-matched WT C57 Bl/6 mice. Western blotting was performed as previously described.19 Phospho-AKT (Ser473), GSK3β, phospho-FOXO1 (Ser 256), and phospho-S6 (Ser235/236) antibodies were obtained from Cell Signaling. GAPDH antibody was obtained from Santa Cruz Biotechnology.
Statistical analyses
Kaplan-Meier survival curves were constructed using Prism4 software (GraphPad), and log-rank analysis was used to analyze the results. For bar graphs, the unpaired 2-tailed Student t test was used to compute P values, except where stated otherwise. Error bars reflect the SEM, except where stated otherwise.
Results
Activation of AKT in hematopoietic cells causes a myeloproliferative disease
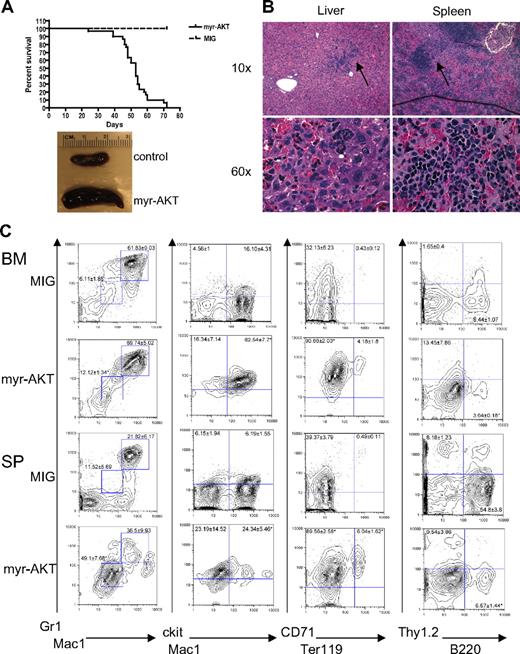
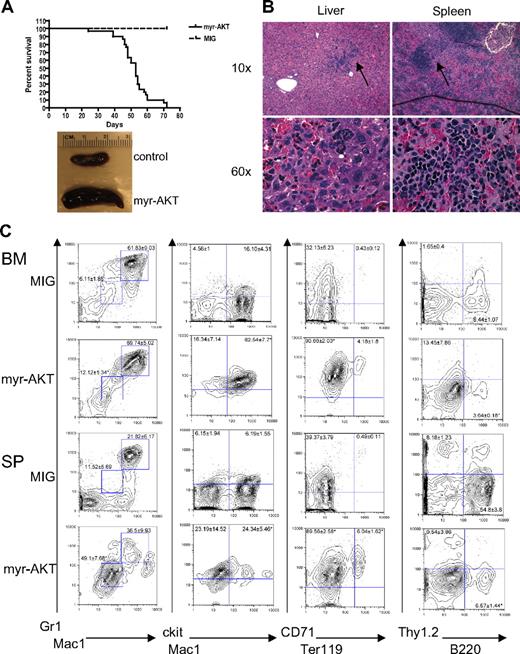
We developed a mouse model of AKT activation in the hematopoietic system using a retroviral BMT assay. For this assay, we used a retroviral construct encoding myr-AKT bicistronic to GFP, MSCV-myr-AKT-IRES-GFP. Myristoylation of AKT causes AKT to associate with the membrane, which leads to its constitutive phosphorylation and activation.20 To confirm that myr-AKT1 is capable of activating downstream targets of AKT in hematopoietic cells, we first tested it in the murine Ba/F3 cell line. Transduction of Ba/F3 cells with the myr-AKT-IRES-GFP retrovirus results in increased phosphorylation of AKT at Ser 473, as well as phosphorylation of the downstream targets GSK3β, FOXO1, and ribosomal protein S6 (supplemental Figure 1, available on the Blood website; see the Supplemental Materials link at the top of the online article). We then transduced BM from C57BL/6 5-fluorouracil–injected donors with myr-AKT-IRES-GFP or with an empty vector control retrovirus expressing only GFP (MIG) and injected it into the tail veins of lethally irradiated C57BL/6 recipients. By 6 to 8 weeks after transplantation, 90% of the myr-AKT recipients developed MPD, characterized by extramedullary hematopoiesis in the spleen and liver, whereas 10% of the animals developed AML (Table 1; Figure 1A-B). The recipients developed thrombocytopenia but had normal white blood cell counts and hematocrits (Table 1). Flow cytometry revealed an expansion of Mac1mid/Gr1mid and Mac1mid/ckithi immature myeloid cells, and of the CD71hiTer119lo immature population in the BM and spleens of myr-AKT mice, at the expense of B220hi lymphoid cells (Figure 1C). These results suggest that myr-AKT causes an expansion of immature myeloid cells in the BM and spleen.
Myeloid expansion in myr-AKT mice. (A) Kaplan-Meier survival curve of 3 separate BMT experiments using myr-AKT retrovirus (n = 30) or MIG empty vector control (n = 5; P < .001). (B) Hematoxylin and eosin–stained histopathology sections of a representative liver and spleen of myr-AKT recipients, revealing infiltration with immature myeloid and erythroid cells (arrows). Details on image acquisition can be found in supplemental Methods. To the left is a photograph of spleens from myr-AKT and MIG control mice. (C) Flow cytometric analysis of the myeloid, lymphoid, and erythroid lineages of BM and spleen (SP) single-cell suspensions from myr-AKT or MIG transplantation recipients. All were gated for GFP+ cells. Values are the mean ± SEM. *P < .05.
Myeloid expansion in myr-AKT mice. (A) Kaplan-Meier survival curve of 3 separate BMT experiments using myr-AKT retrovirus (n = 30) or MIG empty vector control (n = 5; P < .001). (B) Hematoxylin and eosin–stained histopathology sections of a representative liver and spleen of myr-AKT recipients, revealing infiltration with immature myeloid and erythroid cells (arrows). Details on image acquisition can be found in supplemental Methods. To the left is a photograph of spleens from myr-AKT and MIG control mice. (C) Flow cytometric analysis of the myeloid, lymphoid, and erythroid lineages of BM and spleen (SP) single-cell suspensions from myr-AKT or MIG transplantation recipients. All were gated for GFP+ cells. Values are the mean ± SEM. *P < .05.
T-cell lymphoma in myr-AKT transplantation recipients
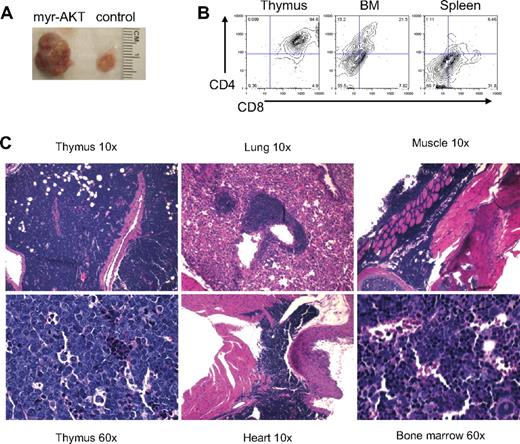
By 6 to 8 weeks after transplantation, 65% of the myr-AKT recipient mice developed a CD4+/CD8+ lymphoblastic thymic T-cell lymphoma. All of the mice that died of T-cell lymphoma had a coexisting MPD. These animals had markedly enlarged thymuses (Figure 2A). Flow cytometric analysis of thymocytes from mice with T-cell lymphoma revealed that most GFP+ cells in the thymus were CD4/CD8 double-positive, and a few GFP+ CD4+/CD8+ cells were also seen in the BM and spleen (Figure 2B). These lymphoblasts also invaded other organs, such as the lung, heart, BM, and muscle (Figure 2C). The T-cell disease was transplantable to secondary recipients, which became ill and died with a mean latency of 30 days (Figure 3C). The transplanted disease was a more aggressive T-ALL, with CD4/CD8+ lymphoblasts infiltrating the BM, liver, spleen, and kidney (supplemental Figure 2A-B). Southern analysis of thymocyte genomic DNA from myr-AKT mice with T-cell lymphoma using a GFP-specific probe reveals that the T-cell lymphoma induced by myr-AKT is a monoclonal or oligoclonal disease, suggesting that retroviral integration sites may play a role in disease initiation or progression (supplemental Figure 2C).
T-cell lymphoma in myr-AKT mice. (A) Photograph of the thymus from a myr-AKT mouse and a MIG control mouse. (B) Flow cytometric analysis of thymus, BM, and spleen single-cell suspensions from a myr-AKT mouse with T-cell lymphoma. Representative plots are shown. All were gated for GFP+ cells. (C) Hematoxylin and eosin–stained histopathology sections of thymus, lung, heart, BM, and muscle sections of a myr-AKT mouse with T-cell lymphoma. Details on image acquisition can be found in supplemental Methods.
T-cell lymphoma in myr-AKT mice. (A) Photograph of the thymus from a myr-AKT mouse and a MIG control mouse. (B) Flow cytometric analysis of thymus, BM, and spleen single-cell suspensions from a myr-AKT mouse with T-cell lymphoma. Representative plots are shown. All were gated for GFP+ cells. (C) Hematoxylin and eosin–stained histopathology sections of thymus, lung, heart, BM, and muscle sections of a myr-AKT mouse with T-cell lymphoma. Details on image acquisition can be found in supplemental Methods.
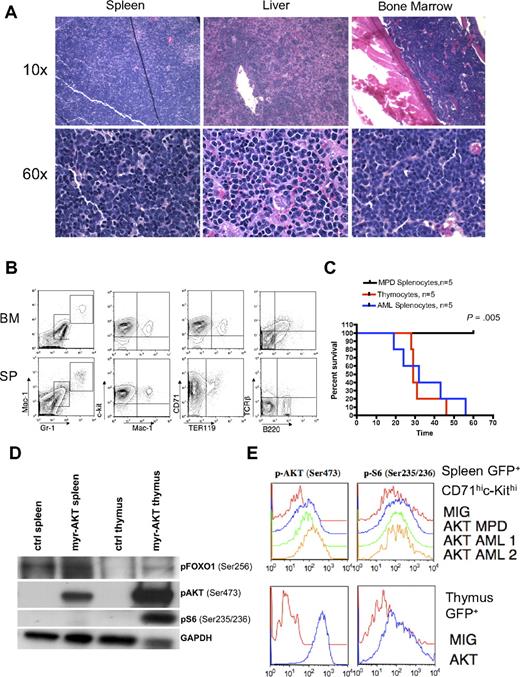
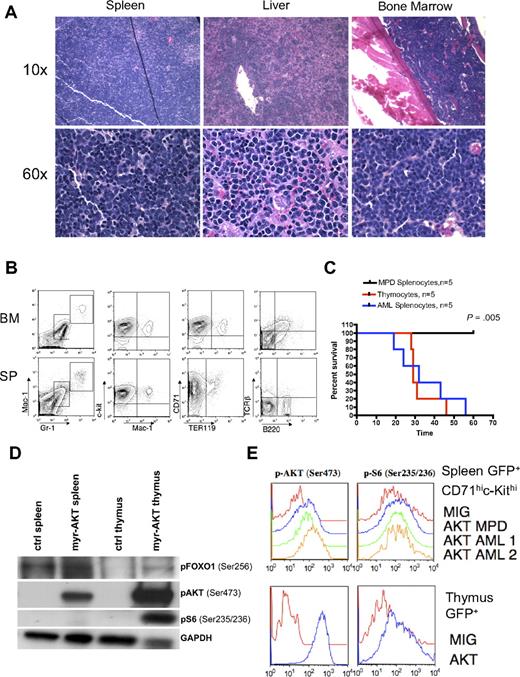
AML in myr-AKT mice. (A) Hematoxylin and eosin–stained histopathology sections of spleen, liver, and BM from a representative myr-AKT mouse with AML. Details on image acquisition can be found in supplemental Methods. (B) Flow cytometric analysis of BM and spleen cells from a representative myr-AKT mouse with AML. All were gated for GFP+ cells. (C) AML and T-cell lymphoma are transplantable, whereas MPD is not. Kaplan-Meier survival curves representing secondary transplantations of splenocytes from myr-AKT mice with MPD, thymocytes from myr-AKT mice with T-cell lymphoma, or splenocytes from myr-AKT mice with AML injected into the tail veins of sublethally irradiated C57 Bl/6 mice. MPD secondary transplantation mice were followed for 120 days with no evidence of disease. (D) Western blot of representative splenocyte and thymocyte lysates from diseased myr-AKT mice and a WT age-matched control mouse. (E) Intracellular flow cytometry on GFP-gated thymocytes and GFP-gated CD71hic-Kithi splenocytes from a myr-AKT mouse and a WT age-matched control mouse.
AML in myr-AKT mice. (A) Hematoxylin and eosin–stained histopathology sections of spleen, liver, and BM from a representative myr-AKT mouse with AML. Details on image acquisition can be found in supplemental Methods. (B) Flow cytometric analysis of BM and spleen cells from a representative myr-AKT mouse with AML. All were gated for GFP+ cells. (C) AML and T-cell lymphoma are transplantable, whereas MPD is not. Kaplan-Meier survival curves representing secondary transplantations of splenocytes from myr-AKT mice with MPD, thymocytes from myr-AKT mice with T-cell lymphoma, or splenocytes from myr-AKT mice with AML injected into the tail veins of sublethally irradiated C57 Bl/6 mice. MPD secondary transplantation mice were followed for 120 days with no evidence of disease. (D) Western blot of representative splenocyte and thymocyte lysates from diseased myr-AKT mice and a WT age-matched control mouse. (E) Intracellular flow cytometry on GFP-gated thymocytes and GFP-gated CD71hic-Kithi splenocytes from a myr-AKT mouse and a WT age-matched control mouse.
AML in myr-AKT transplantation recipients
Approximately 10% of the myr-AKT transplantation recipients developed AML without any evidence of preexisting MPD. In these animals, disease onset was observed at 4 to 7 weeks after transplantation. Myeloblasts were observed effacing the BM, spleen, and liver architecture (Figure 3A). The GFP+ population was composed of immature undifferentiated cells expressing c-Kit and CD71, low levels of the myeloid markers Mac1 and Gr1, but not the lymphoid markers B220 or T-cell receptor-β (Figure 3B). AML blasts in the spleen, liver, and BM were myeloperoxidase negative and terminal deoxynucleotidyl transferase negative (data not shown). Therefore, the immunophenotype of this leukemia is that of an undifferentiated AML (M0 in French-American-British classification). Splenocytes from myr-AKT animals with AML recapitulated the disease in secondary recipients with a mean latency of 30 days. In contrast, splenocytes from mice with MPD failed to transplant disease to secondary recipients (P = .005; Figure 3C). Disease in secondary recipients closely resembled the disease seen in primary myr-AKT transplantation recipients with AML by histopathology and flow cytometry (supplemental Figure 3A-B). To determine how the MPD, AML, and T-cell lymphoma in myr-AKT mice are related to AKT pathway activation, we examined the phosphorylation of AKT and its downstream targets ribosomal protein S6 and FOXO1 in thymocytes and splenocytes from myr-AKT recipients with T-cell lymphoma, using immunoblot analysis and intracellular flow cytometry. We found increased phosphorylation of AKT, S6, and FOXO1 in both thymic lymphoblasts and splenocytes of myr-AKT mice with T-cell lymphoma relative to controls, although S6 was phosphorylated to a greater degree in GFP+ thymocytes than in GFP+ CD71hic-kithi splenocytes (Figure 3D-E).
Impaired engraftment in myr-AKT mice
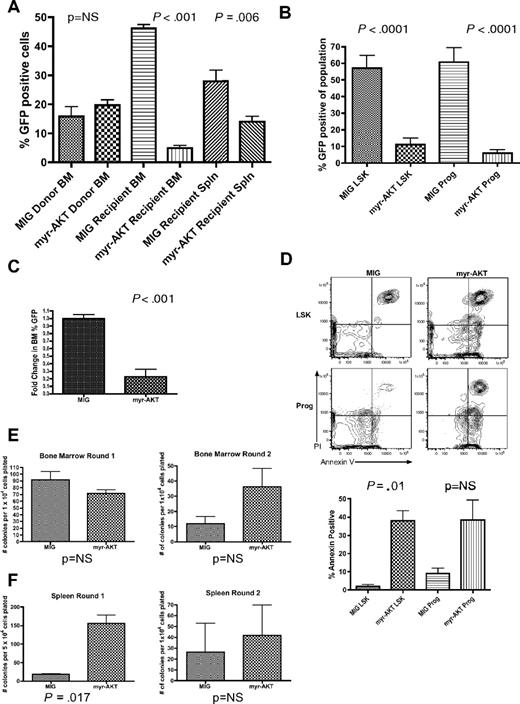
We were surprised to find that, despite the ability of the myr-AKT-IRES-GFP retrovirus to cause MPD and AML in recipient mice, the percentage of GFP+ cells was consistently lower in the BM of sick myr-AKT recipient mice when they were killed at 6 to 8 weeks after transplantation compared with GFP controls (Figure 4A). This could not be explained by differences in transduction efficiency between the 2 retroviruses, as the percentage of GFP+ cells was not significantly different in the donor BM (Figure 4A). Multiparameter flow cytometry revealed a relative decrease in the proportion of GFP+ LSK cells, containing the HSCs, and in GFP+ Lin−Sca1−c-kit+ myeloid progenitors, compared with the corresponding cell populations from MIG controls (Figure 4B). These data suggest a defect in the homing, engraftment, or long-term repopulating potential of myr-AKT–transduced HSCs in vivo. To test for proper homing, myr-AKT-GFP–transduced BM or MIG BM was injected into the tail veins of lethally irradiated recipients, and the percentage of GFP+ cells in recipient BM was determined 18 hours later. We observed no significant difference in the percentage of GFP+ cells in the transduced donor BM that was transplanted, or between the BM or spleens of myr-AKT-GFP and MIG recipient mice, suggesting that myr-AKT cells are capable of homing normally to the BM (supplemental Figure 4A and data not shown). For the competitive engraftment assay, lethally irradiated recipients of BM transduced with myr-AKT-GFP or MIG were killed 2 weeks after transplantation, and the BM and spleen cells were analyzed for the percentage of GFP+ cells. We observed a small increase in the percentage of GFP+ cells in the MIG transplantation recipients after 2 weeks. In contrast, we observed a dramatic decrease in the percentage of GFP+ cells in the BM of myr-AKT mice (Figure 4C). We also observed a decrease in the percentage of GFP+ cells in the spleens of myr-AKT mice, suggesting that the BM lodging defect cannot be explained entirely by a redistribution of HSCs and progenitors to the spleen (data not shown). This suggests that myr-AKT impairs the short-term repopulating activity of HSCs. The early engraftment defect seen in myr-AKT mice made an in-depth analysis of the HSC compartment difficult, as the numbers of GFP+ LSK cells and progenitors are very low by the time disease develops (Figure 4B and data not shown). We did observe an increase in apoptosis in the GFP+ LSK population in myr-AKT mice killed at 6 to 8 weeks, suggesting that this may be a mechanism for the impaired reconstitution we observed (Figure 4D). To examine the clonogenic capacity and in vitro self-renewal activity of BM and spleen cells isolated from diseased myr-AKT mice, we performed methylcellulose plating assays in M3434 media. Splenocytes from myr-AKT recipient mice produced more myeloid colonies initially, with a predominance of granulocyte-macrophage colonies, whereas BM cells yielded approximately the same number of colonies (Figure 4E-F; Tables 2–3). However, both splenocytes and BM cells from myr-AKT mice failed to replate past 2 rounds (Figure 4E-F). These results reveal that, although myr-AKT increases the clonogenic capacity of splenocytes, it does not confer in vitro self-renewal properties.
Sustained AKT signaling in myr-AKT mice causes depletion of LSK cells and progenitors and increased apoptosis. (A) Left bar graph: Percentage GFP of BM transduced with myr-AKT-GFP or MIG control retrovirus on the day of tail vein injection. Results are the mean of data from 3 independent transplantation experiments. Right bar graphs: Percentage GFP in recipient BM and spleen (Spln) in MIG or myr-AKT mice killed at 6 to 8 weeks after transplantation. Error bars represent SEM. (B) Decrease in percentage GFP+ cells in the LSK and progenitor compartments of myr-AKT BM. BM of control MIG transplantation mice or diseased myr-AKT transplantation mice killed at 6 to 8 weeks after transplantation was stained with a lineage antibody cocktail, goat anti–rat antibody, and then Sca1 and c-Kit to distinguish the LSK and progenitor populations. The percentage of GFP+ cells in each population is shown. (C) Competitive engraftment of BM transduced with myr-AKT or MIG control retrovirus. BM was transduced with myr-AKT or MIG retrovirus and then injected into mice as previously described. Recipient mice were killed at 2 weeks after transplantation, and percentage GFP in the BM was quantified by flow cytometry. The fold change in percentage GFP in the BM was determined as: percentage GFP in recipient BM/percentage GFP in donor BM. The values for MIG controls were normalized to 1 for the analysis. (D) Apoptosis analysis of the LSK and progenitor compartments in BM from MIG or diseased myr-AKT mice killed at 6 to 8 weeks after transplantation. Apoptosis analysis of the LSK and mixed progenitor populations from myr-AKT mice. BM cells were gated on GFP+ LSK and Lin−c-kit+Sca1− (Prog) cells. Representative annexin V vs propidium iodide plots are shown for these populations. (E) Methylcellulose plating assays of BM cells from myr-AKT and MIG control mice, killed at 6 to 8 weeks after transplantation. Bar graphs reveal the total number of colonies seen at each round of replating every 7 days. (F) Methylcellulose plating assays of spleen cells from myr-AKT and MIG control mice, killed at 6 to 8 weeks after transplantation. Bar graphs represent the total number of colonies seen at each round of replating every 7 days.
Sustained AKT signaling in myr-AKT mice causes depletion of LSK cells and progenitors and increased apoptosis. (A) Left bar graph: Percentage GFP of BM transduced with myr-AKT-GFP or MIG control retrovirus on the day of tail vein injection. Results are the mean of data from 3 independent transplantation experiments. Right bar graphs: Percentage GFP in recipient BM and spleen (Spln) in MIG or myr-AKT mice killed at 6 to 8 weeks after transplantation. Error bars represent SEM. (B) Decrease in percentage GFP+ cells in the LSK and progenitor compartments of myr-AKT BM. BM of control MIG transplantation mice or diseased myr-AKT transplantation mice killed at 6 to 8 weeks after transplantation was stained with a lineage antibody cocktail, goat anti–rat antibody, and then Sca1 and c-Kit to distinguish the LSK and progenitor populations. The percentage of GFP+ cells in each population is shown. (C) Competitive engraftment of BM transduced with myr-AKT or MIG control retrovirus. BM was transduced with myr-AKT or MIG retrovirus and then injected into mice as previously described. Recipient mice were killed at 2 weeks after transplantation, and percentage GFP in the BM was quantified by flow cytometry. The fold change in percentage GFP in the BM was determined as: percentage GFP in recipient BM/percentage GFP in donor BM. The values for MIG controls were normalized to 1 for the analysis. (D) Apoptosis analysis of the LSK and progenitor compartments in BM from MIG or diseased myr-AKT mice killed at 6 to 8 weeks after transplantation. Apoptosis analysis of the LSK and mixed progenitor populations from myr-AKT mice. BM cells were gated on GFP+ LSK and Lin−c-kit+Sca1− (Prog) cells. Representative annexin V vs propidium iodide plots are shown for these populations. (E) Methylcellulose plating assays of BM cells from myr-AKT and MIG control mice, killed at 6 to 8 weeks after transplantation. Bar graphs reveal the total number of colonies seen at each round of replating every 7 days. (F) Methylcellulose plating assays of spleen cells from myr-AKT and MIG control mice, killed at 6 to 8 weeks after transplantation. Bar graphs represent the total number of colonies seen at each round of replating every 7 days.
Short-term elevation of AKT signaling causes expansion of the LSK compartment and increased cycling of LSK cells
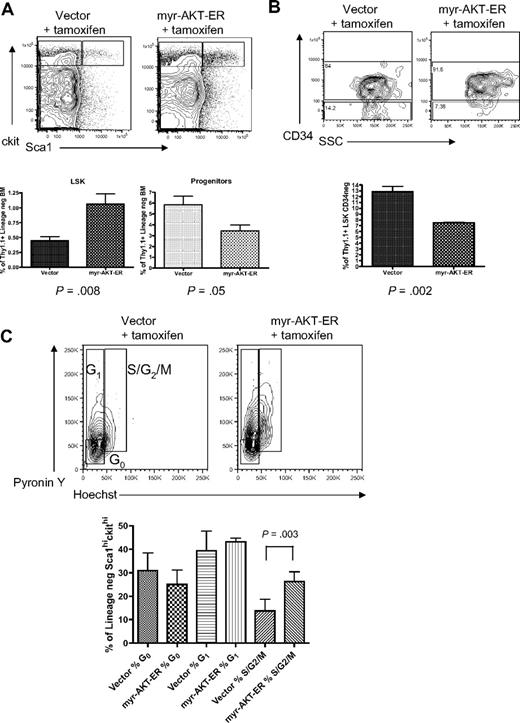
To better understand the effects of constitutive AKT activation on stem cell function, we used a tamoxifen-inducible MSCV-myr-AKT-estrogen receptor-IRES-Thy1.1 (myr-AKT-ER) retrovirus in the BMT system to analyze the effects of short-term AKT signaling on the stem and progenitor cell compartments. Thy1.1 is expressed at very low levels in the LSK and progenitor populations in C57 Bl/6 mice, so it can be used as a marker in this system (supplemental Figure 4B). Mice transplanted with BM expressing myr-AKT-ER or control MSCV-Thy1.1 retrovirus were injected with tamoxifen intraperitoneally daily for 3 days after the 4-week engraftment period to induce myr-AKT expression, and then were killed and analyzed on the fourth day. Interestingly, flow cytometry revealed evidence of an early MPD in the spleens of myr-AKT-ER mice induced for 3 days, with an expansion of immature myeloid cells (supplemental Figure 5). When we analyzed the HSCs in the BM of myr-AKT-ER mice, we observed an approximately 2-fold increase in the percentage of Thy1.1-gated LSK cells and a 2-fold decrease in the percentage of Thy1.1-gated mixed progenitors in myr-AKT-ER mice compared with control vector mice (Figure 5A). There was also a relative increase in the percentage of short-term CD34+ LSK cells at the expense of CD34− long-term LSK cells in myr-AKT-ER mice (Figure 5B). We used Hoechst and pyronin Y staining to examine the cell-cycle status of LSK cells in myr-AKT-ER mice after short-term induction of AKT signaling. We found a higher proportion of the LSK compartment to be in the S/G2/M stages of the cell cycle compared with the LSK compartment in vector controls treated with tamoxifen (Figure 5C). This suggests that constitutive AKT signaling induces cycling of HSCs, leading to a transient relative increase in immunophenotypic short-term HSCs, followed by apoptosis of HSCs and an expansion of immature myeloid cells in the BM and spleen. Taken together, these data suggest that myr-AKT skews HSC balance away from self-renewal and toward exhaustion and differentiation.
Short-term induction of AKT signaling causes expansion of the LSK compartment and increased LSK cycling. BMT assay with myr-AKT-ER or vector control retrovirus, followed by tamoxifen induction after engraftment for 3 days. (A) Multiparameter flow cytometric analysis of the Thy1.1-gated LSK and progenitor BM populations. The experiment was repeated 3 times, with 3 or 4 mice per group in each experiment. (B) Analysis of the Thy1.1-gated CD34−LSK BM subpopulation of myr-AKT-ER mice and vector control mice. The Student paired 2-tailed t test was used to compare the percentage Thy1.1+ CD34− LSK cells between samples. (C) Cell-cycle analysis of Thy1.1-gated BM LSKs from myr-AKT-ER mice or vector control mice. Hoechst and pyronin Y were used to resolve the G0, G1, and S/G2/M stages of the cell cycle. The experiment was repeated 3 times, with 2 to 4 mice per group in each experiment.
Short-term induction of AKT signaling causes expansion of the LSK compartment and increased LSK cycling. BMT assay with myr-AKT-ER or vector control retrovirus, followed by tamoxifen induction after engraftment for 3 days. (A) Multiparameter flow cytometric analysis of the Thy1.1-gated LSK and progenitor BM populations. The experiment was repeated 3 times, with 3 or 4 mice per group in each experiment. (B) Analysis of the Thy1.1-gated CD34−LSK BM subpopulation of myr-AKT-ER mice and vector control mice. The Student paired 2-tailed t test was used to compare the percentage Thy1.1+ CD34− LSK cells between samples. (C) Cell-cycle analysis of Thy1.1-gated BM LSKs from myr-AKT-ER mice or vector control mice. Hoechst and pyronin Y were used to resolve the G0, G1, and S/G2/M stages of the cell cycle. The experiment was repeated 3 times, with 2 to 4 mice per group in each experiment.
Decreased cobblestone formation by myr-AKT–transduced BM
Because mice transplanted with myr-AKT–expressing BM become ill and die by 6 to 8 weeks after transplantation, we were unable to perform the traditional 16-week competitive repopulation assay to assess long-term HSC function in vivo. Therefore, we used the in vitro long-term culture-initiating cell (LTC-IC) assay to examine the long-term stem cell activity of myr-AKT–transduced BM. Cobblestones that remain after 4 weeks in the coculture assay have been previously shown to contain long-term stem cell activity.21 In this assay, BM transduced with myr-AKT-GFP or MIG retrovirus was sorted for GFP+ cells, and then 500 000 GFP-sorted cells were cocultured for 4 weeks with irradiated OP9 stromal cells. The cultures were examined at 2 weeks and 4 weeks for cobblestone formation. After 4 weeks, the contents of each well were plated into M3434 methylcellulose media, and colonies were counted 1 week later. We found that BM cells transduced with myr-AKT were able to form cobblestones initially, but very few cobblestones were observed after 4 weeks (data not shown). Therefore, the number of colonies in methylcellulose from myr-AKT BM seen at 5 weeks was greatly reduced compared with the colonies from control vector BM (Figure 6A). Taken together, these results demonstrate that myr-AKT affects both short-term HSC function and long-term HSC activity based on the LTC-IC assay.
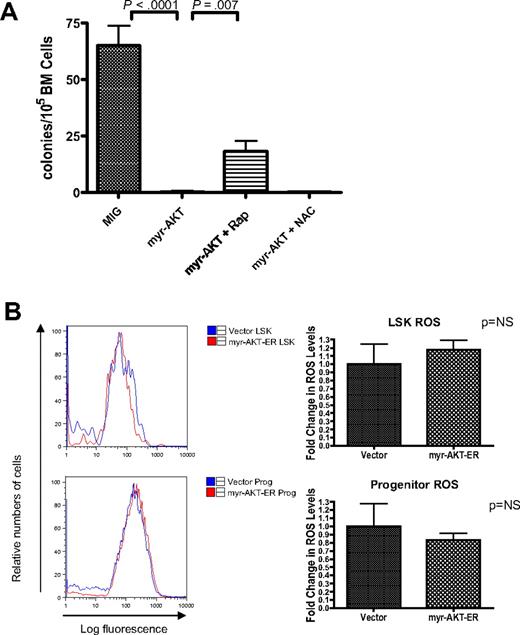
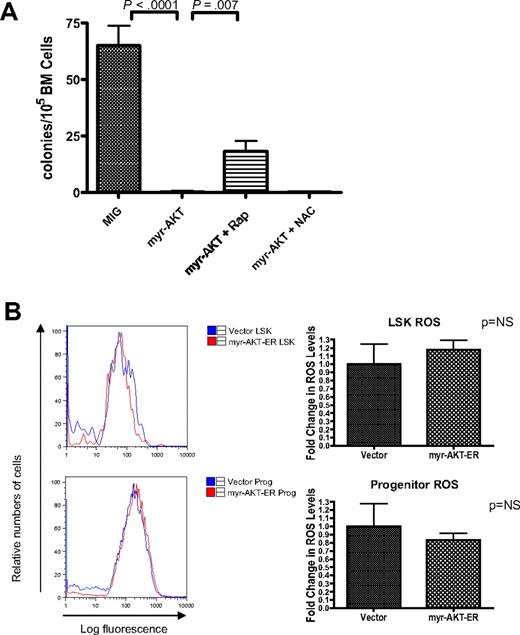
HSC depletion of myr-AKT–transduced BM is dependent on mTOR signaling but not on increased ROS. (A) Rapamycin but not N-acetylcysteine (NAC) rescues cobblestone-forming activity of myr-AKT–transduced BM in the LTC-IC assay. A total of 500 000 retrovirally transduced GFP-sorted BM cells/well were cocultured for 4 weeks with 300 000 OP9 stromal cells. After 4 weeks in coculture, cells were trypsinized and plated into M3434 methylcellulose media, and colonies were scored after 7 days. Rapamycin (Rap) or NAC was added at the time of initial plating, and treatment was continued for 4 weeks. Each drug experiment was performed with at least 5 replicates. (B) ROS levels in the LSK compartment after short-term induction of AKT signaling in vivo. Induction of myr-AKT expression using the myr-AKT-ER BMT system was performed as previously described. Thy1.1+ LSK and progenitor cells were sorted from the BM, and freshly sorted cells were stained with DCF-DA to determine relative levels of ROS. The experiment was performed twice, with 3 or 4 mice per group in each experiment. Right bar graphs: Fold change in DCF-DA peak intensity of sorted LSK and progenitor cells. The values for vector samples were normalized to 1 for the analysis.
HSC depletion of myr-AKT–transduced BM is dependent on mTOR signaling but not on increased ROS. (A) Rapamycin but not N-acetylcysteine (NAC) rescues cobblestone-forming activity of myr-AKT–transduced BM in the LTC-IC assay. A total of 500 000 retrovirally transduced GFP-sorted BM cells/well were cocultured for 4 weeks with 300 000 OP9 stromal cells. After 4 weeks in coculture, cells were trypsinized and plated into M3434 methylcellulose media, and colonies were scored after 7 days. Rapamycin (Rap) or NAC was added at the time of initial plating, and treatment was continued for 4 weeks. Each drug experiment was performed with at least 5 replicates. (B) ROS levels in the LSK compartment after short-term induction of AKT signaling in vivo. Induction of myr-AKT expression using the myr-AKT-ER BMT system was performed as previously described. Thy1.1+ LSK and progenitor cells were sorted from the BM, and freshly sorted cells were stained with DCF-DA to determine relative levels of ROS. The experiment was performed twice, with 3 or 4 mice per group in each experiment. Right bar graphs: Fold change in DCF-DA peak intensity of sorted LSK and progenitor cells. The values for vector samples were normalized to 1 for the analysis.
Increased levels of ROS cannot explain the impaired HSC function in myr-AKT mice
In mice with deletions of the FOXO transcription factors, which are important targets of AKT, the LSK compartment is depleted through increased cycling and apoptosis.15 In these mice, elevated levels of ROS were demonstrated as a mechanism for the HSC exhaustion phenotype. We decided to examine ROS levels using DCF-DA staining of LSK cells and progenitors from myr-AKT-ER transplantation mice, to determine whether increased oxidative stress is a probable mechanism to explain the HSC phenotype we observe. Surprisingly, we did not observe any statistically significant difference in the ROS levels in the Thy1.1-gated LSK or progenitor compartments of myr-AKT-ER mice compared with control empty vector mice after 3 days of induction with tamoxifen (Figure 6B). Consistent with this observation, we did not observe any rescue of cobblestone formation by myr-AKT-GFP–transduced BM in the presence of the antioxidant N-acetylcysteine (Figure 6A). This suggests that oxidative stress may not be the most important mechanism for HSC extinction in the myr-AKT model system.
Rapamycin rescues cobblestone formation by myr-AKT–transduced BM
Another important pathway downstream of AKT signaling is the mTOR pathway, which can control translation and cell growth when activated. The ability of rapamycin, an inhibitor of mTOR, to rescue both the disease phenotype and the HSC phenotype of mice with a conditional deletion of Pten suggests that the mTOR pathway is also important in modulating Pten-deficient HSC function.12 To determine whether activation of the AKT pathway leads to a reduction in self-renewal through activation of the mTOR pathway, we added rapamycin in the LTC-IC assay. Interestingly, we found that rapamycin partially rescued cobblestone formation and colony formation by myr-AKT BM (Figure 6A).
Rapamycin treatment causes increased survival in myr-AKT mice
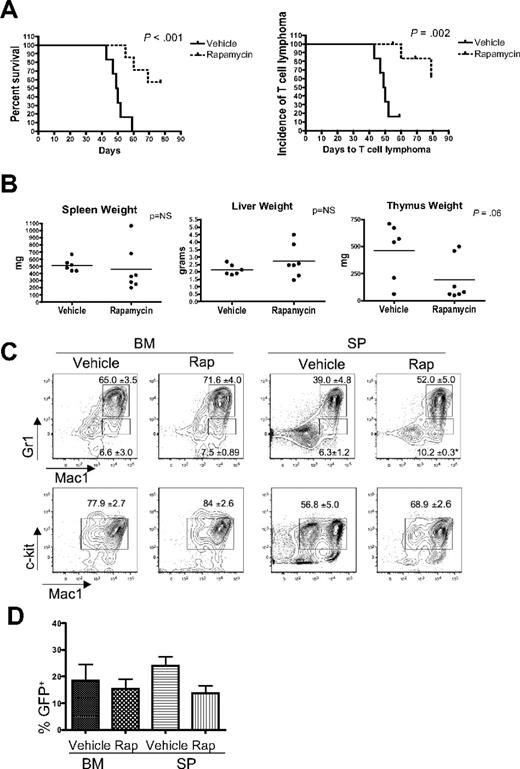
Rapamycin has been reported to inhibit the growth and survival of leukemia cells, and mTOR inhibitors have demonstrated activity in preclinical studies and in early clinical trials in patients with hematologic malignancies.12,22-26 To determine whether the mTOR axis is important for the survival of leukemic cells in vivo in our system, we treated myr-AKT transplantation mice with rapamycin daily starting at 4 weeks after transplantation. We found that rapamycin significantly increased the latency of the disease in myr-AKT mice compared with vehicle treatment (Figure 7A). When we examined organ weights and performed flow cytometry analysis of BM and spleens from rapamycin-treated myr-AKT animals, we found that rapamycin decreased the incidence of thymic T-cell lymphoma, with a trend toward decreased thymus weights, but did not affect the incidence or severity of the MPD or AML (Figure 7A-C). The degree of proliferation of myr-AKT–transduced cells, evidenced by the percentage of GFP+ cells in the BM and spleens of animals at the time of death, was not significantly different between the rapamycin and vehicle groups (Figure 7D). Two of 7 rapamycin-treated animals did develop thymic T-cell lymphoma, suggesting resistant disease.
Rapamycin treatment reduces the incidence of T-cell lymphoma and leads to increased survival in myr-AKT mice. (A) Kaplan-Meier survival curve of myr-AKT mice given daily intraperitoneal injections of vehicle (n = 6) or 4 mg/kg rapamycin (n = 7), starting at 4 weeks after transplantation. The curve on the left represents overall survival, whereas the curve on the right shows the incidence of T-cell lymphoma, here defined as an enlarged thymus weighing more than 200 mg. (B) Organ weights of vehicle- and rapamycin-treated myr-AKT mice at the time of death. (C) Flow cytometric analysis of the myeloid lineages of BM and spleen (SP) single-cell suspensions from representative vehicle- and rapamycin-treated myr-AKT mice. All were gated for GFP+ cells. Values are mean ± SEM. *P < .05. (D) Percentage of GFP+ cells in the BM and spleen of vehicle- and rapamycin-treated myr-AKT mice.
Rapamycin treatment reduces the incidence of T-cell lymphoma and leads to increased survival in myr-AKT mice. (A) Kaplan-Meier survival curve of myr-AKT mice given daily intraperitoneal injections of vehicle (n = 6) or 4 mg/kg rapamycin (n = 7), starting at 4 weeks after transplantation. The curve on the left represents overall survival, whereas the curve on the right shows the incidence of T-cell lymphoma, here defined as an enlarged thymus weighing more than 200 mg. (B) Organ weights of vehicle- and rapamycin-treated myr-AKT mice at the time of death. (C) Flow cytometric analysis of the myeloid lineages of BM and spleen (SP) single-cell suspensions from representative vehicle- and rapamycin-treated myr-AKT mice. All were gated for GFP+ cells. Values are mean ± SEM. *P < .05. (D) Percentage of GFP+ cells in the BM and spleen of vehicle- and rapamycin-treated myr-AKT mice.
Discussion
AKT is constitutively phosphorylated in AML patient samples, but the clinical significance of this activation is unknown. Our murine BMT with AKT activation in the hematopoietic system reveals that expression of myr-AKT is sufficient to induce MPD and T-cell lymphoma with high frequency, and AML with a lower penetrance. Therefore, phosphorylation of AKT is not simply a marker seen in AML blasts but is an important mechanism of transformation. The MPD phenotype we observe in myr-AKT mice is consistent with the recently reported role of AKT in promoting neutrophil and monocyte development.27 However, AML is an infrequent event in our activated AKT model. This contrasts with the Pten deletion mouse model, in which a preceding MPD rapidly progresses to either AML or T-ALL in equal proportions.12,13 There are several possibilities to explain the low penetrance of AML seen in our myr-AKT model. One hypothesis is that additional genetic lesions are required in addition to activation of AKT signaling for the full transformation to AML. In the Pten deletion model, cytogenetic studies revealed that the development of AML probably requires additional molecular alterations.28 However, because of the field effect, in which every cell is deficient in Pten, these additional mutations may be produced at a higher rate. Our BMT model of pathologic AKT phosphorylation mimics the progression of human leukemia, in which relatively few mutated cells may acquire additional mutations in a background that contains mostly wild-type cells.
In addition, the contrast in the rate of AML progression between mice with Pten deletions and mice with activated AKT may be the result of differences in downstream signaling induced by loss of Pten in contrast to those induced by the myr-AKT. For example, the inactivation of Pten may lead to activation of parallel pathways, such as the JNK pathway. A recent study in prostate cancer cells observed that the JNK pathway, which is up-regulated by the loss of Pten, may cooperate with the AKT pathway in the induction of prostate carcinoma.29 It is possible that other pathways downstream of Pten could also cooperate with AKT in the induction of AML, or independently promote AML. Interestingly, mice with FOXO deletions never develop AML, suggesting that the repression of FOXO activity by AKT is not sufficient for leukemogenesis, although other types of malignancies develop in these mice.14,15 This suggests that alternative or additional downstream targets of AKT are required for leukemic transformation.
The lymphoblastic CD4+/CD8+ T-cell lymphoma we observe in myr-AKT mice is consistent with previous studies in which myr-AKT was expressed in thymocytes using a T-cell–specific Lck promoter.30,31 Likewise, mice with Pten deletions develop T-ALL, and mice with FOXO deletions develop T-cell lymphoma with a long latency. This observation is also consistent with the recent report of frequent alterations in AKT and other members of the PI3K/AKT pathway in human T-ALL.32 It is unclear why we observe a higher penetrance of T-cell lymphoma than AML in myr-AKT mice, but our Southern analysis of T-cell lymphoma samples from myr-AKT mice suggests that additional mutations introduced by retroviral insertion may play a role.
Because of the increased cycling and apoptosis of LSK cells observed in myr-AKT mice and the impaired engraftment and cobblestone formation of myr-AKT expressing BM, we conclude that activated AKT is unfavorable for HSC function. Additional molecular events may be necessary to compensate for the deleterious effects of AKT activation on the HSCs to allow for AML to develop. The HSC phenotype that we observe in myr-AKT mice closely resembles the HSC phenotype of mice that harbor conditional deletion of FoxOs in the hematopoietic lineage.12,13,15 For example, the MPDs observed in both mouse models and increased cycling with a paradoxical increase in apoptosis in the LSK cells are observed both with constitutive AKT activation and with FoxO loss. This result is surprising, given the previously described role of AKT in inhibiting apoptosis. The effect seen on stem cells in this study may be the result of supraphysiologic levels of activation of AKT signaling in these cells, and to the particular sensitivity of HSCs to tight regulation of AKT signaling. Taken together, these results argue that the FoxO transcription factors contribute to maintenance of HSC homeostasis, but not to leukemogenesis. However, we did not find any change in ROS levels in LSK cells or progenitors, and the antioxidant N-acetylcysteine was unable to rescue cobblestone formation in myr-AKT–transduced BM. This suggests that increased oxidative stress through repression of FoxOs is not an important mediator of HSC extinction by myr-AKT.
The role for mTOR signaling has been shown to be essential for LSKs in the context of Pten deletion.12,13 Furthermore, the LSK extinction phenotype of Pten-deleted mice could be rescued by treatment with rapamycin. This is consistent with a recent study in which TSC1 deletion was found to induce rapid cycling in HSCs, leading to increased frequency of HSCs and impaired reconstitution.16 Consistent with these studies, we observed partial rescue of cobblestone formation of myr-AKT–expressing BM by rapamycin, suggesting that tight regulation of mTOR signaling is necessary for cobblestone formation.
The inhibition of mTOR is being actively pursued as a strategy for the treatment of both AML and T-ALL, with moderate success in preclinical and early clinical trials.12,22,25,26 Consistent with these prior observations, we did observe a significant survival benefit when myr-AKT mice were treated with rapamycin starting at 4 weeks after transplantation. However, we only observed a decrease in the incidence of thymic T-cell lymphoma, with no change in the incidence or severity of MPD or AML. Together with the fact that we detected a higher level of ribosomal protein S6 phosphorylation in myr-AKT thymocytes than in myr-AKT splenocytes, this observation suggests a stronger dependence of T cells than myeloid cells on mTOR signaling. The lack of effect of rapamycin on the MPD and AML disease in our model contrasts with the antileukemic effect of rapamycin seen in the Pten deletion model.12 However, this may be explained by a difference in the timing of rapamycin administration. In Pten-deleted mice, rapamycin was given before disease was established, whereas we began treating myr-AKT mice 4 weeks after BMT. Indeed, when rapamycin was administered after disease initiation in Pten-deleted mice, leukemia progression was unaffected.12 Interestingly, rapamycin does still affect the progression of T-cell lymphoma in our myr-AKT model. However, we observed a few cases of resistant T-cell lymphoma in rapamycin-treated animals. This resistance to rapamycin may be explained by the activation of alternative pathways through either retroviral integration or de novo mutations, and could be an interesting avenue of future investigation.
Taken together, our analysis of mice with activated AKT in the hematopoietic system has revealed that elevated AKT signaling plays an important role in both myeloid and lymphoid leukemogenesis and in HSC maintenance. In addition, this study has important implications for the utility of AKT and mTOR as targets for leukemia therapy. This myr-AKT BMT model of disease will be a useful model system for examination of theresistance mechanisms to mTOR inhibitors, as well as for testing other inhibitors of AKT signaling in leukemia.
The online version of this article contains a data supplement.
The publication costs of this article were defrayed in part by page charge payment. Therefore, and solely to indicate this fact, this article is hereby marked “advertisement” in accordance with 18 USC section 1734.
Acknowledgments
The authors thank Jean Zhao for providing the myr-AKT1 cDNA; Claudia Tenen and Danielle Tenen for assistance with preparation of the myr-AKT and myr-AKT-ER retroviral constructs; Sandra Moore, Allison Coburn, Dana Cullen, Elizabeth McDowell, Brian Ball, Sebastian Shterental, and Kristina Brumme for technical assistance with BMTs; Benjamin Lee for assistance with interpretation of histology slides; Demetri Kalaitzidis, Stephen Sykes, and Ross Levine for critical reading of the manuscript; and all of the members of the Gilliland laboratory for helpful discussions.
This work was supported in part by the American Society of Hematology Fellow Scholar Award (K.G.), the Ruth L. Kirschtein NRSA Award (K.G.), and the Howard Hughes Medical Institute (D.G.G.).
National Institutes of Health
Authorship
Contribution: M.G.K. and K.G. designed and performed research, analyzed data, and wrote the manuscript; D.G.G. planned research and assisted with data analysis; and R.O., J.J.G., T.K., M.G., and M.P. assisted with experiments.
Conflict-of-interest disclosure: D.G.G. is now an employee of Merck Research Laboratories. The majority of this work was completed prior to his change in employment. The remaining authors declare no competing financial interests.
Correspondence: Kira Gritsman, Department of Cancer Biology, Dana-Farber Cancer Institute, 44 Binney St, Smith 970C, Boston, MA 02115; e-mail: kgritsman@partners.org.

