Key Points
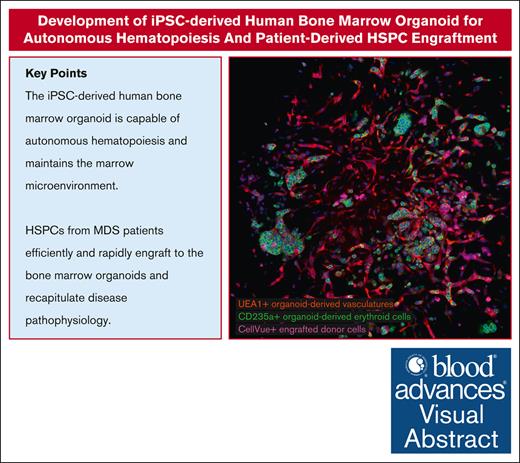
The human bone marrow organoid is capable of autonomous hematopoiesis and maintains the marrow microenvironment.
HSPCs from patients with MDS efficiently and rapidly engraft into bone marrow organoids and recapitulate disease pathophysiology.
Visual Abstract
Current efforts in translational studies in hematology often rely on immunodeficient mouse models for engrafting patient-derived hematopoietic stem and progenitor cells (HSPCs), yet these models often face challenges in effectively engrafting cells from patients with various diseases, such as myelodysplastic syndromes (MDSs). In this study, we developed an induced pluripotent stem cell (iPSC)–derived human bone marrow organoid model that closely replicates the bone marrow microenvironment, facilitating the engraftment of HSPCs derived from patients with MDS, thereby mirroring the patients' distinct disease characteristics. Specifically, using advanced microscopy, we verified the development of a complex 3-dimensional network of endothelial, stromal, and hematopoietic cells within organoids, resembling the autonomous human marrow microenvironment. Furthermore, we showed that HSPCs derived from the donor bone marrow of normal individuals or patients with MDS can migrate to and proliferate within the organoid vascular niche while maintaining self-renewal and original genetic profiles. Within the organoids, the differentiation patterns of MDS HSPCs were significantly distinct from those of multilineage hematopoiesis in normal HSPCs, which can be correlated with the clinical manifestations of the disease. These findings underscore the significance of the organoid model in studying human hematopoiesis and the pathophysiology of hematologic diseases, thereby offering new avenues for personalized medicine and therapeutic interventions.
Introduction
One of the significant challenges in the study of hematologic diseases is to find appropriate model systems that closely recapitulate human pathophysiology in vivo. The development of immune-deficient mouse models, including NSG, NOD.Cg-Prkdcscid Il2rgtm1Wjl Tg(CMV-IL3,CSF2,KITLG)1Eav/MloySzJ (NSGS), and more recent C;129S4-Rag2tm1.1Flv Csf1tm1(CSF1)FlvCsf2/Il3tm1.1(CSF2,IL3)Flv Thpotm1.1(TPO)Flv Il2rgtm1.1FlvTg(SIRPA)1Flv/J (MISTRG) mice, revolutionized the field by facilitating the engraftment of human hematopoietic stem and progenitor cells (HSPCs) in the humanized bone marrow microenvironment in immunodeficient mice.1-5 However, it remains a major obstacle to engrafting HSPCs from many diseases, such as myelodysplastic syndromes (MDSs), into these models.6-9 Disparities in immune responses and differences in the bone marrow microenvironment between humans and mice often lead to results that may not accurately translate to human conditions.
The human bone marrow organoid is a more suitable model for studying human hematopoiesis on a tissue scale. Prototype bone marrow organoids developed over the past decades have applied biomimetics to replicate the 3-dimensional (3D) architecture of human bone marrow.10,11 They are often supplemented with feeder cells and/or exogenously provided growth factors to recreate the bone marrow microenvironment.12-14 Despite these efforts, these models lack the self-sustainability of autonomous hematopoiesis and faithful recapitulation of the bone marrow environment. Recent advancements in the field using human induced pluripotent stem cell (iPSC)–derived bone marrow organoid models resolve many of these issues by closely mimicking the complex cellular composition and functionality of the native bone marrow.15-17 However, the efficiency of these iPSC-derived organoids in engrafting some of the more challenging HSPCs has not been explored.
In this study, we developed an iPSC-derived human bone marrow organoid model capable of autonomous hematopoiesis and sustaining the bone marrow microenvironment. This system also enables efficient engraftment of HSPCs from patients with MDS into bone marrow organoids and mirrors the pathophysiology of the disease.
Methods
Development of iPSC-derived human bone marrow organoids
Human iPSCs were purchased from StemCell Technologies (SCTi003-A). iPSCs were cultured in a 6-well plate coated with Matrigel (Corning) in mTeSR plus medium and passaged every other day. Before bone marrow organoid differentiation, self-differentiated iPSC colonies were removed with pipette tips under a microscope. The remaining iPSCs were detached using ReLeSR and broken into cell clumps with gentle pipetting. Larger clumps were excluded using a 100 μm cell strainer (Corning). Smaller cell clumps were centrifuged and resuspended in mTeSR plus medium supplemented with 1× Rho-associated, coiled-coil containing protein kinase (ROCK) inhibitor (RevitaCell; Gibco). The cell clumps were then transferred to an ultra-low attachment (ULA) 6-well plate to form embryo bodies for 24 hours. The embryo bodies were further stimulated with bone morphogenetic protein 4 (BMP4), vascular endothelial growth factor A (VEGFA), and fibroblast growth factor 2 (FGF2) at 25 ng/mL and the interleukin-21 (IL-21) ligand at 5 ng/mL under hypoxia condition (1% O2) for 72 hours for mesoderm formation and angiogenesis induction. For hemogenic endothelium induction, embryo bodies were further simulated under normoxia for 2 days with the addition of stem cell factor (SCF) and FMS-like tyrosine kinase 3 (FLT3) at 25 ng/mL. Subsequently, the embryo bodies were embedded in a hydrogel composed of Geltrex (Gibco), VitroCol (Advanced Biomatrix), and Collagen IV (Advanced Biomatrix) in a 24-well plate. After 2 hours of solidification of the hydrogel in an incubator, APEL2 medium was supplemented with VEGFA, vascular endothelial growth factor C (VEGFC), FGF2, BMP4, FLT3, SCF, granulocyte colony-stimulating factor (G-CSF), thrombopoietin (TPO), erythropoietin (EPO) at 50 ng/mL, IL-3, and IL-6 at 20 ng/mL. After a 7-day hydrogel culture that allowed the embryo bodies to mature into self-assembling 3D structured organoids, the organoids were released from the matrix and individually seeded in a 96-well ULA plate in APEL2 medium supplemented with FGF2, SCF, FLT3, IL-3, TPO, and EPO 20 ng/mL until day 21.
Purification and preservation of human bone marrow HSPCs
CD34+ HSPCs were isolated from bone marrow aspiration samples under an institutional review board-approved protocol using the CD34 MicroBead Kit (Miltenyi Biotec, catalog no. 130-046-702) following the manufacturer's instructions. Briefly, the bone marrow aspirate was diluted with magnetic-activated cell sorting (MACS) buffer (2 mM EDTA in phosphate-buffered saline [PBS] with 0.5% bovine serum albumin) at a 1:5 ratio, and mononuclear cells were enriched using Ficoll-Paque density gradient medium (Cytiva; catalog no. 17144002). The enriched mononuclear cells were then processed using the CD34 MicroBead Kit to purify the CD34+ HSPCs. The purified CD34+ cells were resuspended in CryoStor CSB medium (StemCell Technologies; catalog no. 100-0237) and initially stored in a cooling box at −80°C for 12 hours before being transferred to liquid nitrogen for long-term storage.
Engraftment of patient-derived CD34+ HSPCs
The preserved patient-derived CD34+ HSPCs were thawed, labeled with CellVue Claret Far Red Membrane Label (Sigma-Aldrich) or CellTrace Far Red Cell Proliferation Kit (Invitrogen, C34564) as per the manufacturer's guidelines, and resuspended in 200 μL StemPro-34 medium (Gibco; catalog no. 10639011). To this suspension, 100 μL of ice-cold Matrigel (Corning; catalog no. CLS354277) was added. The medium was removed from day-21 matured organoids, and 30 μL of the cell suspension was applied directly to immerse the organoids, followed by a 30-minute incubation at 37°C. Subsequently, 150 μL of StemPro-34 medium containing SCF, FLT3, TPO, EPO, and IL-3 (10 ng/mL each) were added to promote engraftment. Engrafted organoids were analyzed via flow cytometry or imaging 3 days after engraftment.
Human bone marrow organoid imaging
Mature organoids were fixed in 2.5% glutaraldehyde in 0.1 M phosphate buffer for 72 hours for transmission electron microscopy (TEM) imaging. TEM was performed at the Center for Advanced Microscopy at Northwestern University.
For 3D confocal microscopy, organoids were fixed in 4% paraformaldehyde at room temperature for 1 hour, permeabilized, and blocked with 0.25% Triton X-100 in 10% goat serum (Thermo Fisher Scientific, catalog no. 50197Z) on an orbital shaker for 2 hours. The organoids were then dehydrated in saturated sucrose at 4°C for 24 hours before immunostaining with the primary and secondary antibodies (supplemental Table 1). After staining, the organoids were immersed in 60% (volume-to-volume ratio) glycerol and 2.5 M fructose for 1 hour for tissue clearing. For imaging, organoids were placed in glass-bottom dishes (Nunc) and submerged in a clearing buffer for confocal Z-stack imaging. Imaging was conducted using a Nikon AXR laser scanning confocal system with a 20× water immersion objective (CFI Apo LWD Lambda S 20XC WI), capturing Z-steps at 0.85 μm intervals across a total Z-distance of at least 120 μm. Z-stack images were processed using Imaris 10.0 (Oxford Instruments) for cell surface rendering.
Human bone marrow organoid flow cytometry
Organoids with or without engrafted patient-derived HSPCs were collected for flow cytometry. Each assay consisted of 10 organoids, which were pooled in MACS buffer (2 mM EDTA in PBS with 0.5% bovine serum albumin) in 15 mL centrifuge tubes. After 2 washes in MACS buffer, organoids underwent collagenase digestion using 0.25% collagenase (StemCell Technologies; catalog no. 07902) at 37°C for 15 minutes to facilitate disassociation into single-cell suspensions. This was achieved by gentle pipetting every 5 minutes during digestion and subsequent filtration through a 40 μm cell strainer. The resulting single-cell suspensions were centrifuged, resuspended in 200 μL of MACS buffer, and stained with fluorophore-conjugated primary antibodies at a 1:200 dilution (refer to supplemental Table 2 for antibody specifics). Stained cells were analyzed on a BD Symphony A1 flow cytometer, as previously reported,18-20 with data processing and cell population gating conducted in FlowJo using isotype control antibodies to define gating strategies.
Cytogenetic analysis
Conventional cytogenetic analyses of organoid-derived cells were performed using the G-banding method. After 2 washes in MACs buffer, organoids underwent collagenase digestion using 0.25% collagenase (StemCell Technologies) at 37°C for 15 minutes to facilitate disassociation into single-cell suspensions for downstream analysis. Fresh cells were harvested from 24-hour unstimulated cultures following the standard protocol, which included incubation with colcemid, followed by treatment with hypotonic solution and cell preservation in Carnoy fixative. Harvested cell suspensions were dropped onto slides and stained for G-banding with a trypsin-Giemsa solution. The karyotype was described according to the International System for Human Cytogenetic Nomenclature (ISCN 2020).
Renal capsule xenografting of the human bone marrow organoids
On day 21 after differentiation, mature human bone marrow organoids were implanted under the renal capsule of 12-week-old immunodeficient NOD.Cg-PrkdcscidIl2rgtm1Wjl/SzJ (NSG) mice (The Jackson Laboratory, 005557). One organoid was implanted per mouse on the left kidney. The implantation procedure followed the method described previously.21 The presence of human hematopoietic cells was assessed by peripheral blood flow cytometry analysis as described previously.22,23
Single-cell RNA sequencing of the human bone marrow organoids
Ten mature organoids were pooled for single-cell RNA sequencing assay. The organoids were digested into a single-cell suspension using 0.25% collagenase (StemCell Technologies; catalog no. 07902) in a 37°C incubator. The resulting cell suspension was filtered through a 40 μm cell strainer before loading onto the 10× Genomics Chromium platform for single-cell encapsulation and complementary DNA library preparation. Complementary DNA from ∼1 × 10⁴ encapsulated cells was sequenced on an Illumina MiSeq platform. The resulting data were analyzed using the Seurat package in R.
Proliferation and survival analysis of engrafted HSPCs
The proliferation of engrafted MDS HSPCs was assessed using the CellTrace Far Red Cell Proliferation Kit (Invitrogen; catalog no. C34564). CD34+ HSPCs derived from 3 different patients with MDS were pooled together to obtain a sufficient cell number for the engraftment assay. A total of 1 × 10⁶ pooled CD34+ HSPCs were labeled with CellTrace reagent following the manufacturer's instructions. A total of 5 × 10³ labeled cells were engrafted into each independent organoid in a well of a ULA 96-well plate, with a total of 120 organoids engrafted. Additionally, 40 organoids were engrafted for the secondary engraftment assay. For each flow cytometry assay, 10 organoids were digested into single-cell suspensions and stained with DAPI (4ʹ,6-diamidino-2-phenylindole) and PE-cyanine7-conjugated anti-human CD34 antibody (BioLegend; catalog no. 343616). Three assays were performed on days 2, 5, 10, and 15 after the engraftment. Cell counting beads (Invitrogen; catalog no. C36950) were incorporated into the flow cytometry assay to quantify the absolute number of CellTrace+ cells.
Secondary engraftment of HSCPs
For the secondary engraftment assay, 40 organoids from the initial engraftment were harvested on day 3 after engraftment. The organoids were digested into single-cell suspensions and stained with PE-cyanine7-conjugated anti-human CD34 antibody (BioLegend; catalog no. 343616) for fluorescence-activated cell sorting (FACS). CD34 and CellTrace double-positive cells were sorted and immediately engrafted into 12 new organoids, each containing ∼5 × 10³ double-positive cells. The secondary engrafted organoids were cultured for an additional 7 days, after which they were harvested for whole-mount imaging and flow cytometry analysis.
Whole-exome DNA sequencing of the engraftment-derived hematopoietic cells
CD34+ HSPCs derived from 3 independent patients with MDS were labeled with CellVue membrane stain and subsequently engrafted into human bone marrow organoids. A total of 5 × 10³ HSPCs were engrafted into each organoid, with at least 30 organoids engrafted per patient-derived sample. After 10 days of culture after engraftment, CellVue+ cells were sorted by FACS for DNA extraction. The extracted DNA was used for library preparation using the IDT xGen Exome Hyb Panel v2 (IDT; catalog no. 10005151) for whole-exome sequencing. The sequencing data were analyzed on the Illumina BaseSpace cloud computational cluster using DRAGEN Somatic pipeline v4.2.
Prussian blue and Wright-Giemsa staining of engrafted organoid
Ten organoids engrafted with MDS HSPCs carrying the SF3B1 p.(H662Q) mutation were harvested on day 10 after engraftment. The organoids were digested into a single-cell suspension using collagenase and washed twice with MACS buffer. The resulting single-cell suspension was resuspended in 500 μL of PBS, and 100 μL of this suspension was used to prepare a cytospin slide. The slides were subsequently stained with Prussian blue or Wright-Giemsa.
Institutional approvals
All animal studies followed the Guidelines for the Care and Use of Laboratory Animals and were approved by the Institutional Animal Care and Use Committee of Northwestern University. Total bone marrow cells from patients with MDS were obtained following informed consent under the institutional review board-approved protocols at Northwestern University.
Results
Establishment of the human iPSC-derived bone marrow organoids
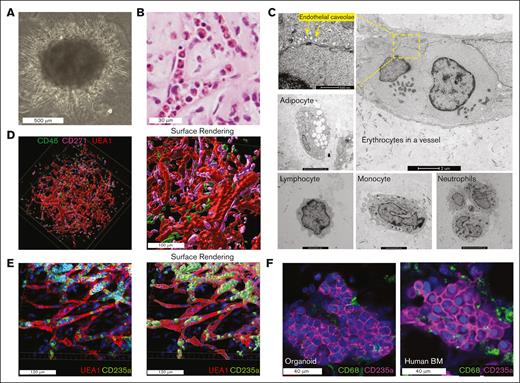
To model human hematopoiesis and the bone marrow microenvironment, we used human iPSCs and differentiated them into bone marrow organoids over 21 days (see Methods). By day 21, these organoids formed dense spheres ∼1000 μm in diameter (Figure 1A). Histological analysis confirmed their similarity to human bone marrow, with hematopoietic cells inside the microvasculature (Figure 1B). This was further confirmed by a TEM study, in which hematopoietic cells, such as erythrocytes, were readily detected in the vessel. Other bone marrow components, including endothelial cells, neutrophils, monocytes, lymphocytes, and adipocytes, were also detected (Figure 1C). Using whole-mount imaging, we observed a 3D endothelial network interconnected with stromal and hematopoietic cells (Figure 1D). Cells of a specific lineage, such as erythroid cells, were located adjacent to and within sinusoidal vessels (Figure 1E). Many erythroblasts also formed tight erythroid islands with features consistent with those found in primary human marrow core biopsies (Figure 1F).
Human iPSC-derived bone marrow organoid mimics human bone marrow structure. (A) Wide-field picture of a mature human bone marrow organoid in culture on day 21. (B) Hematoxylin and eosin (H&E) staining of bone marrow organoid cultured on day 21 demonstrates the presence of hematopoietic cells within the sinusoids. (C) Representative pictures of TEM reveal diverse cell types within bone marrow organoids cultured on day 21. (D) 3D whole-mount imaging of human bone marrow organoids cultured on day 21 (left) with the cell surface rendered via Imaris (right). Organoids were immunostained for CD45+ hematopoietic cells and CD271+ mesenchymal stromal cells, with biotinylated UEA1 highlighting the endothelial cells. (E) 3D imaging reveals erythroblasts, stained for CD235a, encapsulated within UEA1-positive sinusoidal vessels (left). The cell surface rendering picture is on the right. (F) Comparison of confocal images between organoid-derived erythroblasts (day 21 culture) and those obtained from a human bone marrow core biopsy.
Human iPSC-derived bone marrow organoid mimics human bone marrow structure. (A) Wide-field picture of a mature human bone marrow organoid in culture on day 21. (B) Hematoxylin and eosin (H&E) staining of bone marrow organoid cultured on day 21 demonstrates the presence of hematopoietic cells within the sinusoids. (C) Representative pictures of TEM reveal diverse cell types within bone marrow organoids cultured on day 21. (D) 3D whole-mount imaging of human bone marrow organoids cultured on day 21 (left) with the cell surface rendered via Imaris (right). Organoids were immunostained for CD45+ hematopoietic cells and CD271+ mesenchymal stromal cells, with biotinylated UEA1 highlighting the endothelial cells. (E) 3D imaging reveals erythroblasts, stained for CD235a, encapsulated within UEA1-positive sinusoidal vessels (left). The cell surface rendering picture is on the right. (F) Comparison of confocal images between organoid-derived erythroblasts (day 21 culture) and those obtained from a human bone marrow core biopsy.
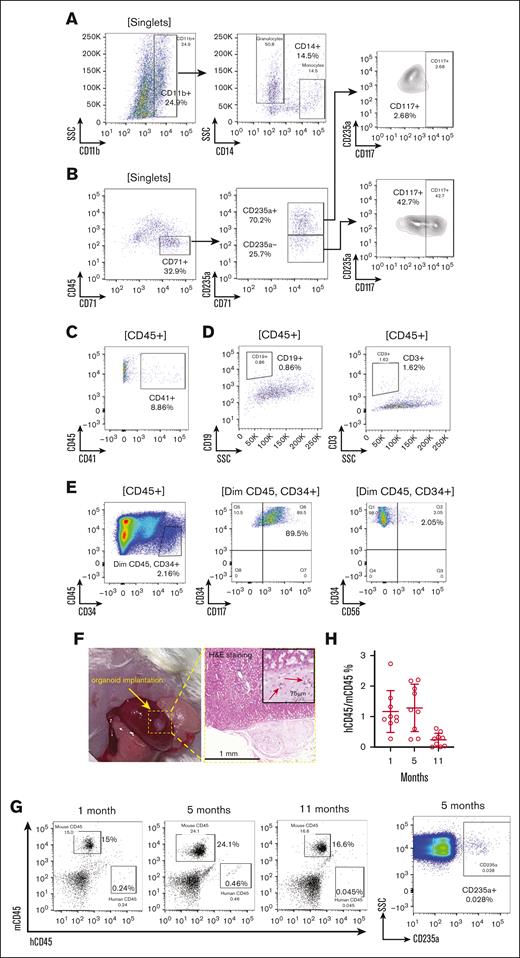
We next performed flow cytometry assays, which validated multilineage hematopoiesis and demonstrated that the organoids closely replicate human bone marrow composition, including granulocytes, monocytes, erythrocytes, lymphocytes, and HSPCs (Figure 2). Organoid-derived myeloid cells expressed CD11b and CD14 in myeloid cells, including monocytes (Figure 2A). The erythroid cells exhibited mixed stages of differentiation. Early erythrocytes (CD71+ and CD235a–) showed higher expression of progenitor cell marker CD117, which was predominantly negative in CD71+ and CD235a+ late-stage erythroblasts (Figure 2B). CD41+ megakaryocytic population was also readily detectable (Figure 2C). However, the lymphoid population remained ambiguous by flow cytometry (Figure 2D), likely due to the absence of peripheral lymphoid tissues. The organoid-derived CD34+ HSPCs exhibited a normal immunophenotype, expressing CD117 and lacking CD56 expression (Figure 2E). The composition of the organoids was further investigated using single-cell RNA sequencing. The uniform manifold approximation and projection (UMAP) plot revealed hematopoietic lineages at different stages of differentiation, as well as mesenchymal stromal cells, endothelial cells, and fibroblasts (supplemental Figure 1A-B). Importantly, the organoid maintained a normal karyotype, demonstrating its genomic integrity during the differentiation process (supplemental Figure 1C).
Human iPSC-derived bone marrow organoid supports autonomous hematopoiesis. (A-E) Validation of multilineage hematopoiesis within the organoid through flow cytometry. After digestion with collagenase into a single-cell suspension, organoid-derived cells were stained as indicated. Labels in the bracket symbols indicate the cell populations the corresponding panels were based on for analyses. The percentages of the indicated populations are presented. (F) Organoid implantation in NSG mice. The organoid was implanted under the renal capsule of the left kidney. H&E staining demonstrates successful engraftment 1-month after implantation. Red arrows indicate the vessel lumen enclosing red blood cells (RBCs). (G) Flow cytometry analysis of RBC-depleted peripheral blood at 1, 5, and 11 months after implantation to compare the percentages of human and mouse CD45+ leukocytes. CD235a+ human erythroid cells were also tested at 5 months using non–RBC-depleted samples. (H) Quantitative analysis of the ratio of human and mouse CD45+ cells in panel G. Each data point represents an NSG mouse implanted with human bone marrow organoid. SSC, side scatter.
Human iPSC-derived bone marrow organoid supports autonomous hematopoiesis. (A-E) Validation of multilineage hematopoiesis within the organoid through flow cytometry. After digestion with collagenase into a single-cell suspension, organoid-derived cells were stained as indicated. Labels in the bracket symbols indicate the cell populations the corresponding panels were based on for analyses. The percentages of the indicated populations are presented. (F) Organoid implantation in NSG mice. The organoid was implanted under the renal capsule of the left kidney. H&E staining demonstrates successful engraftment 1-month after implantation. Red arrows indicate the vessel lumen enclosing red blood cells (RBCs). (G) Flow cytometry analysis of RBC-depleted peripheral blood at 1, 5, and 11 months after implantation to compare the percentages of human and mouse CD45+ leukocytes. CD235a+ human erythroid cells were also tested at 5 months using non–RBC-depleted samples. (H) Quantitative analysis of the ratio of human and mouse CD45+ cells in panel G. Each data point represents an NSG mouse implanted with human bone marrow organoid. SSC, side scatter.
To determine whether bone marrow organoids maintain their properties and functions in vivo over the long term, we implanted them into the renal capsules of immunodeficient NSG mice. The renal capsule provides a suitable microenvironment that supports vascularization, accessibility, immunodeficiency, and growth space necessary for the long-term survival and study of implanted bone marrow organoids in vivo.24 Gross examination and histologic analysis 1 month later confirmed successful implantation (Figure 2F). Human CD45+ leukocytes and CD235a+ erythrocytes were readily identified over 11 months by flow cytometry, albeit with reduced frequency over time (Figure 2G-H).
Engraftment of CD34+ HSPCs in the bone marrow organoids
One significant obstacle in hematologic translational studies is the lack of appropriate human models. This is especially problematic in hematologic diseases, such as MDS, in which HSPCs from these patients are challenging to engraft in immunodeficient mice. This highly replicable and high-fidelity bone marrow organoid system prompted us to investigate whether HSPCs from patients with various forms of MDS could be effectively engrafted into organoids.
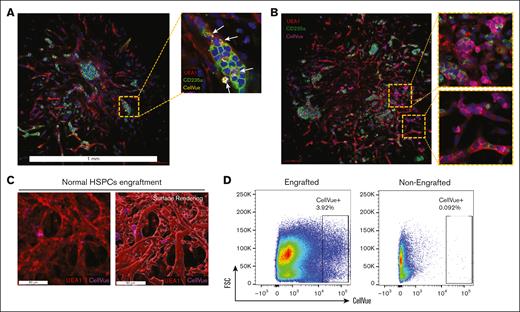
We first engrafted HSPCs derived from normal bone marrow by incubating 5 × 10³ CellVue-labeled CD34+ cells with each single organoid. After 72 hours, we collected the organoids, washed them vigorously to remove nonengrafted donor cells, and performed whole-mount imaging analysis. We found that the engrafted CellVue+ donor cells were readily detected across the parenchyma of the bone marrow organoid. The engrafted cells were often embedded among the organoid-derived hematopoietic cells, notably in erythroid islands (Figure 3A). The engrafted cells also formed focal proliferative clusters, demonstrating a robust fitness to the organoid niche (Figure 3B). 3D surface rendering revealed engrafted cells within and surrounding the ulex europaeus agglutinin 1 (UEA1)-positive vessels (Figure 3C; supplemental Figure 2A). Flow cytometry further confirmed the engraftment of CellVue-labeled donor cells (Figure 3D). These data demonstrate the capability of the niche microenvironment in the bone marrow organoids to support engrafted donor HSPCs and establish a foundation for using the organoid to model human hematologic diseases.
Donor HSPCs engraft within the bone marrow organoids. (A) Confocal imaging demonstrates engraftments of CellVue-labeled donor cells: 5 × 10³ CellVue-labeled CD34+ HSPCs derived from a normal bone marrow sample were coincubated with an organoid in a 96-well plate for 3 days before imaging. Arrows indicate CellVue+ cells reside within an erythroid island. (B) Confocal imaging demonstrates engraftments and focal proliferation of CellVue-labeled donor cells: 5 × 10³ CellVue-labeled CD34+ HSPCs derived from a normal bone marrow sample were coincubated with an organoid in a 96-well plate for 3 days before imaging. Scale bar, 100 μm. (C) 3D imaging reveals HSPCs from normal bone marrow samples engraft within the vascular niches of organoids. (D) Flow cytometry analysis of organoids engrafted with CellVue-labeled HSPCs, as in panel A. Ten organoids were pooled together for each flow cytometry assay. Non-engrafted organoids were used as controls.
Donor HSPCs engraft within the bone marrow organoids. (A) Confocal imaging demonstrates engraftments of CellVue-labeled donor cells: 5 × 10³ CellVue-labeled CD34+ HSPCs derived from a normal bone marrow sample were coincubated with an organoid in a 96-well plate for 3 days before imaging. Arrows indicate CellVue+ cells reside within an erythroid island. (B) Confocal imaging demonstrates engraftments and focal proliferation of CellVue-labeled donor cells: 5 × 10³ CellVue-labeled CD34+ HSPCs derived from a normal bone marrow sample were coincubated with an organoid in a 96-well plate for 3 days before imaging. Scale bar, 100 μm. (C) 3D imaging reveals HSPCs from normal bone marrow samples engraft within the vascular niches of organoids. (D) Flow cytometry analysis of organoids engrafted with CellVue-labeled HSPCs, as in panel A. Ten organoids were pooled together for each flow cytometry assay. Non-engrafted organoids were used as controls.
MDS HSPCs engraft into the bone marrow organoids and recapitulate clinical manifestations
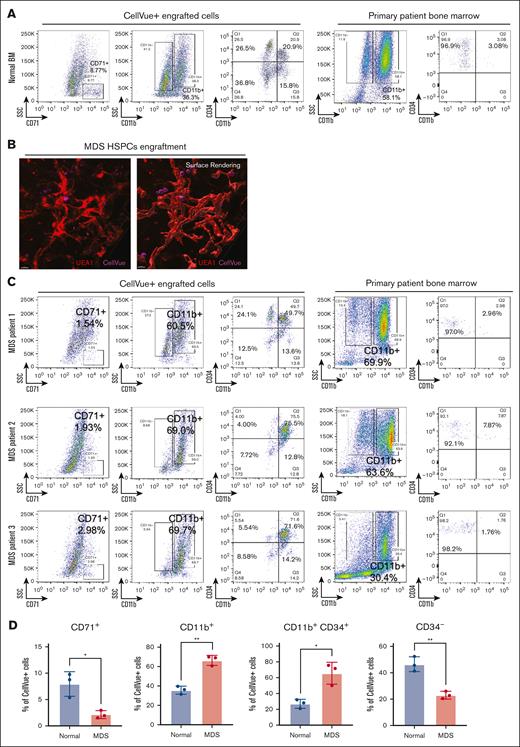
With this system, we next investigated donor HSPC-derived hematopoiesis within bone marrow organoids using CD34+ HSPCs from patients with different subtypes of MDS and compared them with their counterparts from individuals with normal bone marrow. Flow cytometry analyses 72 hours after 3 independent normal HSPC engraftment assays revealed differentiation of the engrafted donor CD34+ HSPCs to CD71+ erythroid and CD11b+ myeloid cells and downregulation of CD34 expression (Figure 4A; supplemental Figures 2B and 3). Notably, a subset of CD34+ cells gained CD11b expression compared with the state when they were initially purified from the primary bone marrow, indicating a possible differentiation trajectory to myeloid cells after engraftment (Figure 4A; supplemental Figure 2C).
Donor HSPCs engraftments recapitulate disease pathophysiology. (A) Flow cytometry analyses show multilineage differentiation within organoids of CellVue-labeled donor HSPCs. Each organoid was engrafted with 5 × 10³ CD34+ HSPCs derived from a normal bone marrow sample. Ten organoids were pooled for each assay. The patient’s primary bone marrow sample was analyzed, as shown on the right panels, to confirm that the CD34+ cells do not coexpress lineage markers. The percentages of the indicated populations are presented. (B) 3D imaging reveals HSPCs from the bone marrow samples of a patient with MDS engraft within the vascular niches of the organoids. (C) Same as panel A, except that CD34+ HSPCs derived from 3 different patients with MDS were engrafted separately. (D) Statistical analysis of CellVue+ engraftments, with each point representing an independent flow cytometry assay using CD34+ HSPCs from a distinct patient sample. Ten organoids were pooled for each assay. n = 3 in each group. Student t test, ∗P < .05; ∗∗P < .01.
Donor HSPCs engraftments recapitulate disease pathophysiology. (A) Flow cytometry analyses show multilineage differentiation within organoids of CellVue-labeled donor HSPCs. Each organoid was engrafted with 5 × 10³ CD34+ HSPCs derived from a normal bone marrow sample. Ten organoids were pooled for each assay. The patient’s primary bone marrow sample was analyzed, as shown on the right panels, to confirm that the CD34+ cells do not coexpress lineage markers. The percentages of the indicated populations are presented. (B) 3D imaging reveals HSPCs from the bone marrow samples of a patient with MDS engraft within the vascular niches of the organoids. (C) Same as panel A, except that CD34+ HSPCs derived from 3 different patients with MDS were engrafted separately. (D) Statistical analysis of CellVue+ engraftments, with each point representing an independent flow cytometry assay using CD34+ HSPCs from a distinct patient sample. Ten organoids were pooled for each assay. n = 3 in each group. Student t test, ∗P < .05; ∗∗P < .01.
We next chose 3 patients with MDS with different clinical presentations to test their engraftment-derived hematopoiesis within the organoids. Patient 1 was diagnosed with MDS with low blasts based on the fifth edition of the World Health Organization classification of hematolymphoid tumors,25 or MDS, not otherwise specified with multilineage dysplasia based on the International Consensus Classification of myeloid neoplasms.26 Patient 1 showed mutations in TET2, U2AF1, and DNMT3A on next-generation sequencing and trisomy 8 on cytogenetic studies. Bone marrow morphologic analyses revealed multilineage dysplasia, mainly in the erythroid and megakaryocytic lineages (supplemental Figure 4). Clinically, patient 1 showed persistent but mild macrocytic anemia without other cytopenia (supplemental Figure 5). Patient 2 was diagnosed with MDS with low blasts and an SF3B1 mutation based on the World Health Organization or MDS with mutated SF3B1 based on the International Consensus Classification. Next-generation sequencing studies showed additional ASXL1 and TET2 mutations. Bone marrow biopsies showed dyserythropoiesis and frequent ring sideroblasts (supplemental Figures 4 and 6). Clinically, patient 2 had persistent and moderate macrocytic anemia, leukopenia, and mild thrombocytopenia (supplemental Figure 5). Patient 3 was diagnosed with MDS with increased blasts (10%-15% blasts) carrying ASXL1, KRAS, and U2AF1 mutations, as well as chromosome 5q deletion. Bone marrow biopsy showed multilineage dysplasia and frequent blasts (supplemental Figure 4). The clinical picture of patient 3 was also the worst among all 3 cases and showed marked anemia, thrombocytopenia, and leukocytosis with circulating blasts (supplemental Figure 5).
CD34+ cells derived from MDS bone marrow samples were able to efficiently engraft into the vascular niche within the organoids, as demonstrated by confocal microscopy (Figure 4B). Flow cytometry assays further confirmed engraftment and, more importantly, reflected the patients' clinical and pathologic presentations. The engrafted donor cells from all 3 patients with MDS showed significantly reduced erythroid differentiation compared with the normal control (Figure 4C-D). The differentiation profiles of CD11b+ myeloid cells in the organoids correlated with those obtained from patients’ primary bone marrow flow cytometry findings. Although cells from all 3 patients with MDS showed significant retention of CD34 expression, the level of CD34 reduction, which reflects the differentiation of HSPCs, was more compromised in patients 2 and 3. This is consistent with the worse clinical presentation and cytopenia in these 2 patients compared with those in patient 1 (Figure 4C-D).
We repeated the engraftment assays using samples from 2 different patients with MDS and compared the differentiation profiles of the engrafted MDS HSPCs with the clinical flow cytometry profiles during the diagnosis of these patients. We found that these 2 flow cytometry profiles were highly consistent in their CD34 percentage and CD56 expression levels. In these cases, patient A1 was diagnosed with MDS, multilineage dysplasia, and increased blasts. Flow cytometry of engrafted bone marrow organoids also showed increased blasts (∼3%) and aberrant CD56 expression (supplemental Figure 7A-C). Patient A2 was diagnosed with low-risk MDS with no increase in aberrant blasts, which was also reflected in the engrafted organoids (supplemental Figure 8). These results were also reproducible, as demonstrated by the similar flow cytometry profiles in 2 independent engraftment experiments for patient A1 (supplemental Figure 7B-C).
The engrafted MDS HSPCs maintain self-renewal capacity and genetic profiles
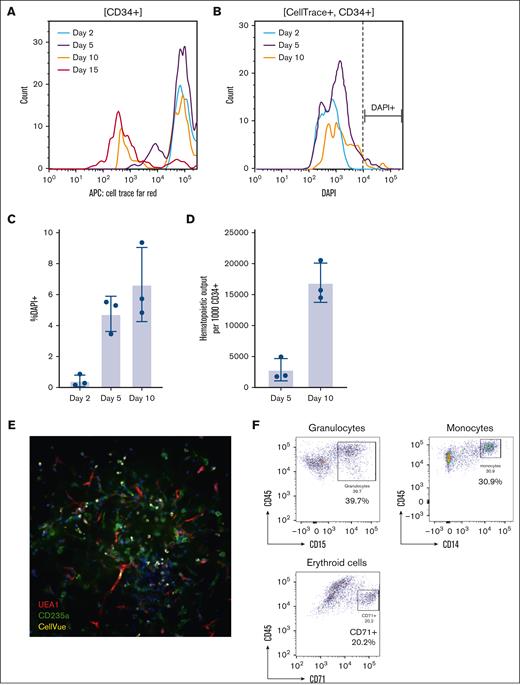
We analyzed the proliferation and survival of engrafted CD34+ HSPCs using pooled samples from 3 additional patients with MDS. We observed a progressive reduction in CellTrace signal starting on day 5. By day 15, the CellTrace signal decreased to the level of the nonstained control, indicating that the organoid was able to maintain the self-renewal of the engrafted MDS HSPCs (Figure 5A). The CD34+ HSPCs engrafted in the organoids showed a significant survival advantage (Figure 5B-C) compared with those cultured in liquid media in which no surviving CD34+ cells were detected after 5 days. Additionally, the total number of CellTrace-positive cells increased, with ∼16 000 hematopoietic cells generated from 1000 engrafted CD34+ HSPCs on day 10 after engraftment (Figure 5D). We further tested the self-renewal capacity of the engrafted MDS HSPCs using a secondary engraftment assay. Indeed, CD34+ and CellTrace+ cells purified from engrafted primary organoids exhibited similar efficiencies in lodging to the appropriate niches and differentiation in different batches of organoids (Figure 5E-F).
Proliferation and survival analyses of engrafted CD34+ HSPCs in human bone marrow organoids. (A) The CellTrace proliferation assay of engrafted CD34+ HSPCs on days 2, 5, 10, and 15. CD34+ HSPCs (1 × 10⁶) were pooled from 3 independent MDS samples and stained with CellTrace Far Red dye. CD34+ stained HSPCs (5 × 10³) were engrafted into each organoid and at least 10 organoids were pooled for each flow cytometry assay. The CellTrace intensity of engrafted CD34+ cells was tested on days 2, 5, 10, and 15 after engraftment. (B-C) Cell death of the engrafted CD34+ cells was assessed using DAPI (B) and quantified in panel C. (D) The total output of hematopoietic cells per 1000 engrafted CD34+ HSCPs was assessed using cell-counting beads. (E) Secondary engraftment of CD34+ HSPCs. CellTrace+ HSPCs were sorted using FACS on day 3 after primary engraftment. Live sorted HSPCs (5 × 10³) were engrafted into each human bone marrow organoid. The secondary engraftment was assessed with whole-mount 3D imaging. (F) Flow cytometry analysis of the indicated cell lineages in the CellTrace+ engrafted donor cells in the secondary engrafted organoids. The percentages of the indicated populations are presented. APC, antigen-presenting cell; DAPI, 4′,6-diamidino-2-phenylindole.
Proliferation and survival analyses of engrafted CD34+ HSPCs in human bone marrow organoids. (A) The CellTrace proliferation assay of engrafted CD34+ HSPCs on days 2, 5, 10, and 15. CD34+ HSPCs (1 × 10⁶) were pooled from 3 independent MDS samples and stained with CellTrace Far Red dye. CD34+ stained HSPCs (5 × 10³) were engrafted into each organoid and at least 10 organoids were pooled for each flow cytometry assay. The CellTrace intensity of engrafted CD34+ cells was tested on days 2, 5, 10, and 15 after engraftment. (B-C) Cell death of the engrafted CD34+ cells was assessed using DAPI (B) and quantified in panel C. (D) The total output of hematopoietic cells per 1000 engrafted CD34+ HSCPs was assessed using cell-counting beads. (E) Secondary engraftment of CD34+ HSPCs. CellTrace+ HSPCs were sorted using FACS on day 3 after primary engraftment. Live sorted HSPCs (5 × 10³) were engrafted into each human bone marrow organoid. The secondary engraftment was assessed with whole-mount 3D imaging. (F) Flow cytometry analysis of the indicated cell lineages in the CellTrace+ engrafted donor cells in the secondary engrafted organoids. The percentages of the indicated populations are presented. APC, antigen-presenting cell; DAPI, 4′,6-diamidino-2-phenylindole.
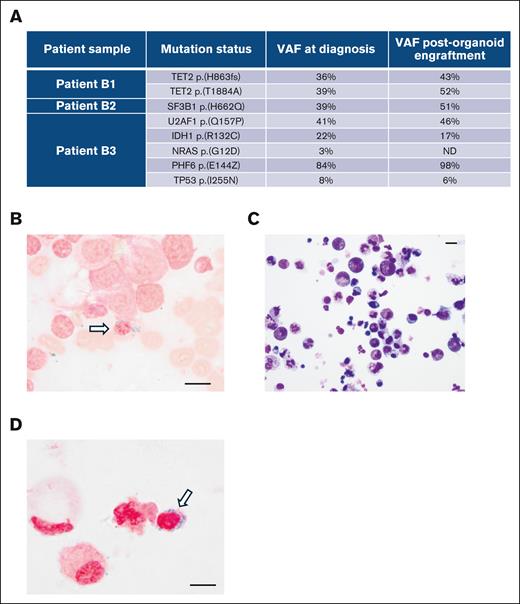
To determine whether the engrafted MDS HSPCs retained their genetic profiles during proliferation and differentiation in organoids, we engrafted CD34+ HSPCs from 3 independent MDS samples into organoids. On day 10 after engraftment, we collected CellVue+ cells by FACS and conducted whole-exome DNA sequencing of the sorted cells. Whole-exome DNA sequencing revealed that engraftment-derived cells maintained the mutations identified through next-generation sequencing assays during diagnosis. The variant allele frequencies between the diagnostic samples and organoid-engrafted cells were similar (Figure 6A). Patient B2, who carried the SF3B1 mutation and exhibited ring sideroblasts in a bone marrow smear (Figure 6B), was further analyzed. We digested the organoids engrafted with HSPCs from patient B2 into a single-cell suspension and performed Wright/Giemsa (Figure 6C) and Prussian blue (Figure 6D) staining on the cytospin slides. Ring sideroblasts were readily identified in these stains (Figure 6D). These results indicate that the organoid can provide a microenvironment for MDS HSPCs to maintain their pathological characteristics, both genetically and morphologically.
The engraftment-derived hematopoietic cells retain the genetic and morphologic profiles of the donor cells. (A) Whole-exome DNA sequencing of engraftment-derived hematopoietic cells from day 10 after engraftment. Three patients with MDS with the indicated mutations during diagnosis were analyzed. (B) Prussian blue staining of the bone marrow smear sample from patient B2 during diagnosis. (C) Wright-Giemsa staining of the cytospin sample from organoids on day 10 after engraftment with CD34+ HSPCs from patient B2. (D) Prussian blue staining of the cytospin sample from organoids on day 10 after engraftment with CD34+ HSPCs from patient B2. Scale bars, 10 μm. ND, not detected; VAF, variant allele frequency.
The engraftment-derived hematopoietic cells retain the genetic and morphologic profiles of the donor cells. (A) Whole-exome DNA sequencing of engraftment-derived hematopoietic cells from day 10 after engraftment. Three patients with MDS with the indicated mutations during diagnosis were analyzed. (B) Prussian blue staining of the bone marrow smear sample from patient B2 during diagnosis. (C) Wright-Giemsa staining of the cytospin sample from organoids on day 10 after engraftment with CD34+ HSPCs from patient B2. (D) Prussian blue staining of the cytospin sample from organoids on day 10 after engraftment with CD34+ HSPCs from patient B2. Scale bars, 10 μm. ND, not detected; VAF, variant allele frequency.
Discussion
Our study introduces a replicable human bone marrow organoid model that not only is capable of autonomous hematopoiesis but also supports the growth and multilineage differentiation of engrafted HSPCs. This development represents a step forward in our understanding and utilization of organoids for studying human hematopoiesis and related disease pathophysiology in the human context. The efficient and rapid engraftment of patient-derived HSPCs, especially those from MDS, is particularly important, given that the field has been stagnant with ineffective engraftment of MDS cells in animal models. In addition, this technology promotes the field by providing a platform to study the ex vivo effects of different therapies for bone marrow-related diseases to predict in vivo efficacies.
The representation of human hematopoietic cells in the circulation of organoid-bearing NSG mice remains low and their numbers decrease over time. This decline limits the interpretation of long-term (>5 months) in vivo engraftment. The low abundance of human hematopoietic cells may be due to the implantation of only 1 organoid per mouse. Nevertheless, the primary focus of this study was the ex vivo modeling of MDS using an iPSC-derived bone marrow organoid system. The successful engraftment of MDS HSPCs in bone marrow organoids was confirmed by a secondary engraftment assay. This system provides a robust platform for studying the pathophysiology of MDS and for testing potential therapeutic interventions in a controlled ex vivo environment, bypassing the need for an animal model.
In this study, we used a lipophilic dye to label the cell membrane for the identification and tracking of MDS HSPCs. This technique offers rapid and stable labeling and can be easily combined with other fluorescent antibodies for flow cytometry and imaging studies. However, a notable limitation is the gradual fading of the fluorescent signal over time, which hinders long-term studies on engrafted donor cells. Alternative cell tracking systems, such as genetic barcoding or utilizing donor cells and bone marrow organoids from different sexes, could be explored in such cases.
Acknowledgments
The authors thank the Stem Cell Core Facility of Northwestern University for providing the induced pluripotent stem cell culture platform and the Center for Advanced Microscopy at Northwestern University for performing the transmission electron microscopy assays.
This work was supported by the National Institute of Diabetes and Digestive and Kidney Disease grant R01-DK124220 and the National Heart, Lung, and Blood Institute grants R01-HL148012, R01-HL150729, and R01-HL169507 to P.J. K.R. is a recipient of the Leukemia & Lymphoma Society Special Fellow Award and the EvansMDS Young Investigator Award. H.B. is the recipient of the F32 Ruth L. Kirschstein Postdoctoral Individual National Research Service Award (F32-HL170648). P.J., K.R., and E.L. are coinventors of a pending patent (U.S. patent application 63/691,853) related to data in this article.
Authorship
Contribution: K.R., E.L., I.A., Y.L., X.H., H.B., P.W., K.T., A.J., and J.Y. performed the experiments and interpreted the data; M.S., Y.-H.C., and P.J. analyzed the clinical data; and K.R., E.L., and P.J. designed the experiments, interpreted the data, and wrote the manuscript.
Conflict-of-interest disclosure: The authors declare no competing financial interests.
Correspondence: Kehan Ren, Department of Pathology, Feinberg School of Medicine, Northwestern University, 303 East Chicago Ave, Ward 3-230, Chicago, IL 60611; email: kehan.ren@northwestern.edu; and Peng Ji, Department of Pathology, Feinberg School of Medicine, Northwestern University, 303 East Chicago Ave, Ward 3-230, Chicago, IL 60611; email: peng-ji@fsm.northwestern.edu.
References
Author notes
K.R. and E.L. contributed equally to this study.
The data reported in this article have been deposited in the Gene Expression Omnibus database (accession number GSE274755).
The full-text version of this article contains a data supplement.

