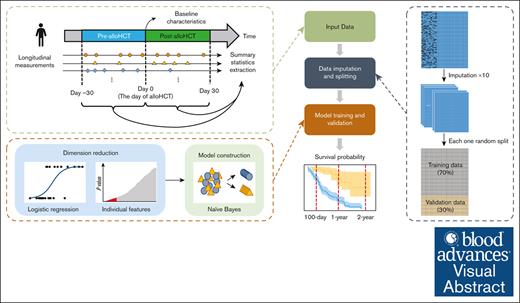
We developed a risk-prediction model using machine learning, incorporating clinical measurements performed before and after allo-HCT.
By using longitudinal data, we were able to improve short- and long-term mortality risk prediction after allo-HCT.
Visual Abstract
Serial prognostic evaluation after allogeneic hematopoietic cell transplantation (allo-HCT) might help identify patients at high risk of lethal organ dysfunction. Current prediction algorithms based on models that do not incorporate changes to patients’ clinical condition after allo-HCT have limited predictive ability. We developed and validated a robust risk-prediction algorithm to predict short- and long-term survival after allo-HCT in pediatric patients that includes baseline biological variables and changes in the patients’ clinical status after allo-HCT. The model was developed using clinical data from children and young adults treated at a single academic quaternary-care referral center. The model was created using a randomly split training data set (70% of the cohort), internally validated (remaining 30% of the cohort) and then externally validated on patient data from another tertiary-care referral center. Repeated clinical measurements performed from 30 days before allo-HCT to 30 days afterwards were extracted from the electronic medical record and incorporated into the model to predict survival at 100 days, 1 year, and 2 years after allo-HCT. Naïve-Bayes machine learning models incorporating longitudinal data were significantly better than models constructed from baseline variables alone at predicting whether patients would be alive or deceased at the given time points. This proof-of-concept study demonstrates that unlike traditional prognostic tools that use fixed variables for risk assessment, incorporating dynamic variability using clinical and laboratory data improves the prediction of mortality in patients undergoing allo-HCT.
Introduction
Allogeneic hematopoietic cell transplantation (allo-HCT) can potentially cure some individuals with hematological disorders. However, treatment-related morbidity and mortality remain major causes of therapeutic failure after allo-HCT. Organ dysfunction, opportunistic infections, and graft-versus-host disease (GVHD) are the most common causes of death in the first 100 days after allo-HCT.1 However, organ failure can be mitigated with prompt recognition and early intervention, leading to improved long-term outcomes.2,3 Serial evaluation of patients after allo-HCT for known modifiable risk factors or predictive biomarkers might help identify patients at high risk of organ dysfunction or other potentially lethal complications, enabling early interventions.
Several risk scores for predicting post–allo-HCT mortality, such as the HCT–comorbidity index (HCT-CI), disease risk index (DRI), disease-risk stratification system, and European Society for Blood and Marrow Transplantation risk score, have been validated for aiding clinical decision-making.4-6 However, the predictive accuracy of these scores remains suboptimal, especially for pediatric recipients of allo-HCT.7-10 None of them include dynamic longitudinal post–allo-HCT assessments, which could enhance the discriminatory power of the biological variables available before allo-HCT. However, incorporating numerous additional pre–allo-HCT and post–allo-HCT variables to predict the mortality risk over time would require a complex algorithm, making the statistical analysis challenging.
We sought to overcome these limitations by developing an algorithm to predict overall survival (OS) after allo-HCT that was not only based on baseline biological variables collected before allo-HCT but also incorporated the changes in patients’ clinical status after allo-HCT, thus providing a longitudinal frame of reference for risk prediction. We hypothesized that by using longitudinal data in the form of clinical and laboratory values, in addition to baseline variables, we could improve short-term and long-term mortality risk prediction for allo-HCT recipients, compared with risk prediction using baseline variables alone. We further planned to use machine learning (ML) methodology to accomplish this, using a data-driven strategy that identified underlying patterns in the observations and integrated them appropriately and precisely, instead of using a priori assumptions or predefined statistical methods.
Methods
Study design
This was a retrospective study conducted to model OS after allo-HCT for pediatric patients. The primary objective was to predict OS at 100 days after allo-HCT. Secondary objectives included predicting OS at 1 and 2 years after allo-HCT. For these respective objectives, mortality was defined as death from any cause by 100 days, 1 year, and 2 years after allo-HCT. Each end point of interest was treated as a binary outcome. To leverage patients’ longitudinal clinical information before and after allo-HCT for OS prediction, the observation window for incorporating repeated clinical measurements in the model was set from 30 days before allo-HCT to 30 days afterwards. Clinical measurements outside this window were not included in this model. The predictive timeline is illustrated in Figure 1. The study was approved by the St Jude Children’s Research Hospital (St Jude) Institutional Review Board and followed the Transparent Reporting of a multivariable prediction model for Individual Prognosis or Diagnosis reporting guideline for prediction algorithm development.11 It was conducted in accordance with the Declaration of Helsinki.
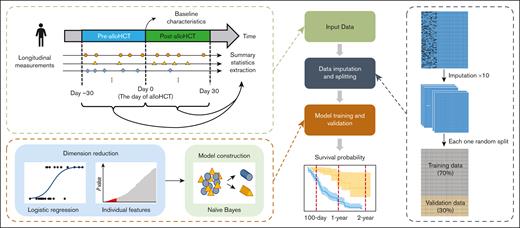
Overall workflow of data analysis. Baseline variables and summary statistics of longitudinal measurements collected in the period from 30 days before allo-HCT to 30 days afterwards in the St Jude data set were included in the analysis. A total of 10 replicates of multiple imputation were performed for the missing baseline variables. Each imputed data set was randomly split into 70% training data and 30% validation data for model construction and validation. Establishing the ML model involved 2 steps: dimension reduction and model construction. Dimension reduction was performed by univariate logistic regressions. The top 50 variables with the smallest P values were selected into model construction. The ML algorithm used for classification was a naïve-Bayes, which classifies subjects as predicted to be deceased or alive based on the conditional probabilities. The constructed ML model was assessed on the validation data set according to different evaluation metrics (eg, Kaplan-Meier plots).
Overall workflow of data analysis. Baseline variables and summary statistics of longitudinal measurements collected in the period from 30 days before allo-HCT to 30 days afterwards in the St Jude data set were included in the analysis. A total of 10 replicates of multiple imputation were performed for the missing baseline variables. Each imputed data set was randomly split into 70% training data and 30% validation data for model construction and validation. Establishing the ML model involved 2 steps: dimension reduction and model construction. Dimension reduction was performed by univariate logistic regressions. The top 50 variables with the smallest P values were selected into model construction. The ML algorithm used for classification was a naïve-Bayes, which classifies subjects as predicted to be deceased or alive based on the conditional probabilities. The constructed ML model was assessed on the validation data set according to different evaluation metrics (eg, Kaplan-Meier plots).
Study population
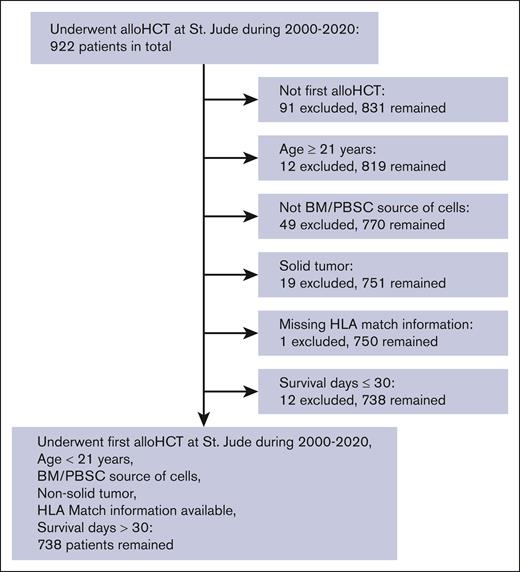
Patients were eligible for inclusion in the internal training and validation cohorts if they underwent their first allo-HCT at St Jude between 2000 and 2020. An external validation cohort consisted of patients undergoing their first allo-HCT at Memorial Sloan Kettering Cancer Center (MSKCC) between 2012 and 2020. Additional inclusion/exclusion criteria and details of the numbers of patients who met the various criteria are shown in Figure 2. Because this was a pragmatic study, the sample size was determined by the number of eligible patients who underwent allo-HCT during the study period and not by a priori power calculations. Of the 922 patients who underwent allo-HCT at St Jude between 2000 and 2020, 738 met the eligibility criteria and were included in the study cohort.
CONSORT diagram showing inclusion/exclusion criteria. A total of 922 patients who underwent allo-HCT at St Jude between 2000 and 2020 were eligible for analysis. Inclusion criteria encompassed having undergone their first allo-HCT, age < 21 years, use of bone marrow (BM) or peripheral blood stem cells (PBSCs) as the cell source, a primary diagnosis other than solid tumor, HLA match information available, and survival >30 days. A total of 738 eligible patients satisfied these criteria and remained in the study cohort.
CONSORT diagram showing inclusion/exclusion criteria. A total of 922 patients who underwent allo-HCT at St Jude between 2000 and 2020 were eligible for analysis. Inclusion criteria encompassed having undergone their first allo-HCT, age < 21 years, use of bone marrow (BM) or peripheral blood stem cells (PBSCs) as the cell source, a primary diagnosis other than solid tumor, HLA match information available, and survival >30 days. A total of 738 eligible patients satisfied these criteria and remained in the study cohort.
Variables
Baseline variables, including recipient and donor characteristics, as well as disease-related and allo-HCT–related factors, were extracted from electronic medical records (EMRs) and a curated institutional transplant database. Baseline variables are summarized in Table 1. Multiple imputation using chained equations12 was performed on the baseline variables to address potential bias and increased variance in parameter estimates resulting from unknown predictors. All longitudinal variables were extracted from the EMRs, except for GVHD-related data, which were extracted from the curated transplant database. Nonnumeric longitudinal variables, such as microbial surveillance, imaging reports, and measurement device descriptions, were excluded from the analysis, given their subjective nature. To model the trajectory of the longitudinal data over the observation window, the repeated measurements were summarized in 6 summary statistics.13 Longitudinal summary statistics with missingness after discretization were removed. The 46 longitudinal variables that were initially considered, and their summary statistics that were finally included in the analysis are listed in supplemental Table 1.
Baseline characteristics and survival outcomes of patients in the entire St Jude data set, the St Jude training and validation data sets, and the MSKCC data set
| Characteristic . | St Jude full cohort (N = 738) . | St Jude training cohort (n = 517) . | St Jude internal validation cohort (n = 221) . | MSKCC external validation cohort (N = 218) . |
|---|---|---|---|---|
| Transplantation period | ||||
| 2000-2004 | 183 (25%) | 125 (24%) | 58 (26%) | |
| 2005-2009 | 179 (24%) | 118 (23%) | 61 (28%) | |
| 2010-2014 | 181 (25%) | 133 (26%) | 48 (22%) | 91 (42%) |
| 2015-2020 | 195 (26%) | 141 (27%) | 54 (24%) | 127 (58%) |
| Recipient characteristics | ||||
| Time from diagnosis to allo-HCT, d | 222 (122-688) | 218 (120-681) | 225 (127-748) | 365 (0-822) |
| Unknown | 50 | |||
| Recipient age at allo-HCT, y | 9.8 (3.9-15.0) | 10.0 (4.0-15.0) | 9.5 (3.6-14.7) | 10 (3-15) |
| Recipient sex | ||||
| Female | 303 (41%) | 209 (40%) | 94 (43%) | 83 (38%) |
| Male | 435 (59%) | 308 (60%) | 127 (57%) | 135 (62%) |
| Recipient race | ||||
| Black | 138 (19%) | 100 (19%) | 38 (17%) | 38 (18%) |
| White | 517 (70%) | 361 (70%) | 156 (71%) | 130 (63%) |
| Other | 82 (11%) | 56 (11%) | 26 (12%) | 38 (18%) |
| Unknown | 1 | 0 | 1 | 12 |
| Recipient ethnicity | ||||
| Hispanic or Latino | 140 (19%) | 104 (20%) | 36 (16%) | 40 (19%) |
| Not Hispanic or Latino | 593 (81%) | 408 (80%) | 185 (84%) | 171 (81%) |
| Unknown | 5 | 5 | 0 | 7 |
| Donor characteristics | ||||
| Donor sex | ||||
| Female | 332 (47%) | 237 (48%) | 95 (45%) | 43 (50%) |
| Male | 370 (53%) | 256 (52%) | 114 (55%) | 43 (50%) |
| Unknown | 36 | 24 | 12 | 132 |
| Donor-recipient sex | ||||
| Female-female | 146 (21%) | 96 (19%) | 50 (24%) | 16 (19%) |
| Male-male | 225 (32%) | 151 (31%) | 74 (35%) | 27 (31%) |
| Female-male | 145 (21%) | 105 (21%) | 40 (19%) | 16 (19%) |
| Male-female | 186 (26%) | 141 (29%) | 45 (22%) | 27 (31%) |
| Unknown | 36 | 24 | 12 | 132 |
| Donor-recipient relatedness | ||||
| Matched related | 125 (27%) | 82 (25%) | 43 (30%) | 64 (29%) |
| Matched unrelated | 144 (31%) | 101 (31%) | 43 (30%) | 72 (33%) |
| Mismatched related | 172 (37%) | 127 (39%) | 45 (31%) | 26 (12%) |
| Mismatched unrelated | 30 (6.4%) | 18 (5.5%) | 12 (8.4%) | 56 (26%) |
| Unknown | 267 | 189 | 78 | |
| Disease characteristics | ||||
| Diagnosis | ||||
| ALL | 224 (30%) | 156 (30%) | 68 (31%) | 62 (28%) |
| AML | 246 (33%) | 183 (35%) | 63 (29%) | 52 (24%) |
| CML | 30 (4.1%) | 22 (4.3%) | 8 (3.6%) | 4 (1.8%) |
| Myelodysplastic syndrome | 35 (4.7%) | 22 (4.3%) | 13 (5.9%) | 13 (6.0%) |
| Other leukemias | 14 (1.9%) | 10 (1.9%) | 4 (1.8%) | 7 (3.2%) |
| Lymphoma | 24 (3.3%) | 12 (2.3%) | 12 (5.4%) | 11 (5.0%) |
| Aplastic anemia | 51 (6.9%) | 38 (7.4%) | 13 (5.9%) | 15 (6.9%) |
| Sickle cell anemia | 27 (3.7%) | 18 (3.5%) | 9 (4.1%) | 3 (1.4%) |
| Other nonmalignant disorder | 87 (12%) | 56 (11%) | 31 (14%) | 51 (23%) |
| Disease status at allo-HCT | ||||
| Active (malignant) | 109 (18%) | 71 (17%) | 38 (21%) | 16 (7.3%) |
| Active (nonmalignant) | 165 (28%) | 112 (27%) | 53 (30%) | 69 (32%) |
| Remission (malignant) | 324 (54%) | 238 (57%) | 86 (49%) | 133 (61%) |
| Unknown | 140 | 96 | 44 | |
| Transplant characteristics | ||||
| Preparative regimen | ||||
| Myeloablative | 345 (67%) | 245 (68%) | 100 (66%) | 192 (88%) |
| Reduced intensity | 140 (27%) | 99 (28%) | 41 (27%) | 7 (3.2%) |
| Nonmyeloablative | 27 (5.3%) | 16 (4.4%) | 11 (7.2%) | 19 (8.7%) |
| Unknown | 226 | 157 | 69 | |
| Product type | ||||
| Marrow | 447 (61%) | 313 (61%) | 134 (61%) | 85 (39%) |
| PBSC | 291 (39%) | 204 (39%) | 87 (39%) | 133 (61%) |
| Mortality outcomes | ||||
| Deaths by 100 d after allo-HCT | 60 (8.1%) | 42 (8.1%) | 18 (8.1%) | 8 (3.7%) |
| Deaths by 1 y after allo-HCT | 187 (25%) | 121 (23%) | 66 (30%) | 25 (11%) |
| Deaths by 2 y after allo-HCT | 233 (32%) | 154 (30%) | 79 (36%) | 43 (20%) |
For categorical variables, n (%) is shown; for numerical variable, median (interquartile range) is shown.
ALL, acute lymphocytic leukemia; AML, acute myeloid leukemia; CML, chronic myelogenous leukemia; PBSC, peripheral blood stem cell.
Model development and validation
Naïve-Bayes, which is a supervised classification technique used to classify subjects by assigning class labels based on conditional probability, was used to model OS.14 Details of the model development and validation are provided in the supplemental Methods. The predictive performance of the established naïve-Bayes model was first validated on the internal validation data set based on several performance metrics described in the supplemental Methods. External validation of our established predictive models was then performed using the validation data set from MSKCC.
Sensitivity analyses
Two separate sensitivity analyses were performed to test the robustness of our prediction model pipeline. First, because patients with active disease or primary refractory leukemia who are included in the current St Jude data set are not considered candidates for allo-HCT at many institutions, the predictive model was retrained by excluding these patients and those with missing disease status from the St. Jude data set. Second, to incorporate organ function details available at baseline or before allo-HCT, another model was created that incorporated any laboratory data collected between days −30 and −7 as a part of the baseline variables. This new model emulates HCT-CI, which incorporates organ function assessments available at the time of allo-HCT. The performance metrics were then recalculated for the St Jude validation data set, using the models established in these 2 sensitivity analyses.
Results
Patient characteristics
The baseline characteristics and survival outcomes of patients in the entire St Jude cohort (N = 738), the St Jude training data set (n = 517) and St Jude validation data set (n = 221), and the MSKCC cohort (N = 218) are listed in Table 1. The median follow-up duration for the entire cohort was 4 years (range, 0.1-21.7 years). The St Jude training and validation data sets were similar with respect to the baseline variables. There were several significant differences between the St Jude and MSKCC cohorts: the St Jude cohort had greater proportions of White recipients; recipients with mismatched related donors; and patients who received a transplant for acute leukemia or had active disease at the time of allo-HCT, received reduced-intensity conditioning, or received a bone marrow graft (P < .05 for all comparisons). At each observation time point, the proportion of deceased patients was greater in the St. Jude cohort than in the MSKCC cohort.
Prediction of OS
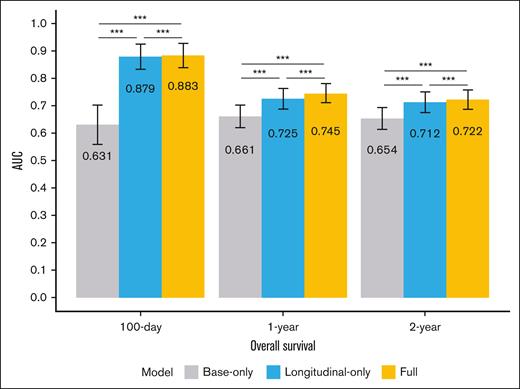
We created 3 naïve-Bayes–based models using the St Jude training data set for predicting the 100-day, 1-year, and 2-year OS: (1) a base-only model with all the baseline variables; (2) a longitudinal-only model with only the longitudinal variables among the top 50 selected predictors; and (3) the full model with the top 50 selected predictors, including both baseline and longitudinal variables. The performance of these ML models was first internally validated on the St Jude validation data set and then externally validated on the MSKCC data set. Figure 3 illustrates the mean area under the curve (AUC) values, obtained by bootstrapping 500 times on the St Jude validation data set, based on the predictions of the 3 models for the different end points. The longitudinal-only and full models significantly outperformed the base-only model in predicting all 3 end points of interest, with substantially higher AUC values that were all significantly different (Figure 3).
AUC values of the prediction models (ie, the base-only, longitudinal-only, and full models) when predicting different end points of interest (100-day, 1-year, and 2-year OS) with the St Jude validation data set. The AUC values were obtained by performing bootstrapping 500 times on the validation data. The numbers within the bars are mean AUC values, and the asterisks indicate the significance of the AUC test results (∗∗∗P < .001).
AUC values of the prediction models (ie, the base-only, longitudinal-only, and full models) when predicting different end points of interest (100-day, 1-year, and 2-year OS) with the St Jude validation data set. The AUC values were obtained by performing bootstrapping 500 times on the validation data. The numbers within the bars are mean AUC values, and the asterisks indicate the significance of the AUC test results (∗∗∗P < .001).
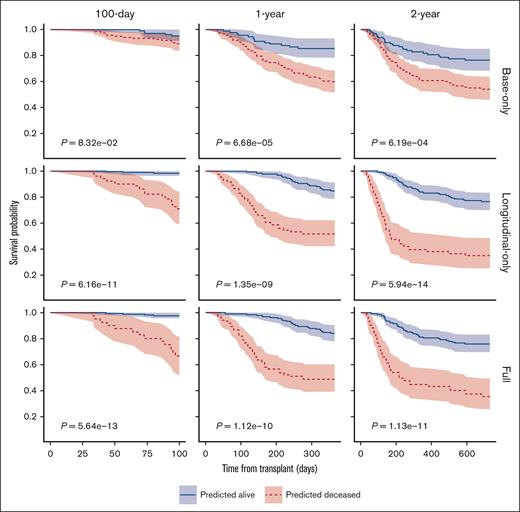
To evaluate further the performance of the models in predicting OS at different time points, we plotted the survival probabilities of patients classified as deceased or alive by the models based on the internal validation data set, using Kaplan-Meier plots (Figure 4). When predicting OS at 100 days, the longitudinal-only and full models improved the stratification of the patients classified as deceased or alive, with the P values obtained from the log-rank tests being 6.16 × 10⁻¹¹ and 5.64 × 10⁻¹³, respectively, significantly lower than that of the base-only model (P = 8.32 × 10⁻²; a smaller P value indicates better stratification). The full and longitudinal models similarly outperformed the base-only model by achieving better stratification of patients classified as deceased or alive at 1 and 2 years.
Kaplan-Meier plots of 100-day, 1-year, and 2-year OS of patients predicted to be deceased or alive in the St. Jude validation data set, based on the prediction by different models. The P values were obtained by log-rank tests. The shaded areas represent the 95% confidence intervals.
Kaplan-Meier plots of 100-day, 1-year, and 2-year OS of patients predicted to be deceased or alive in the St. Jude validation data set, based on the prediction by different models. The P values were obtained by log-rank tests. The shaded areas represent the 95% confidence intervals.
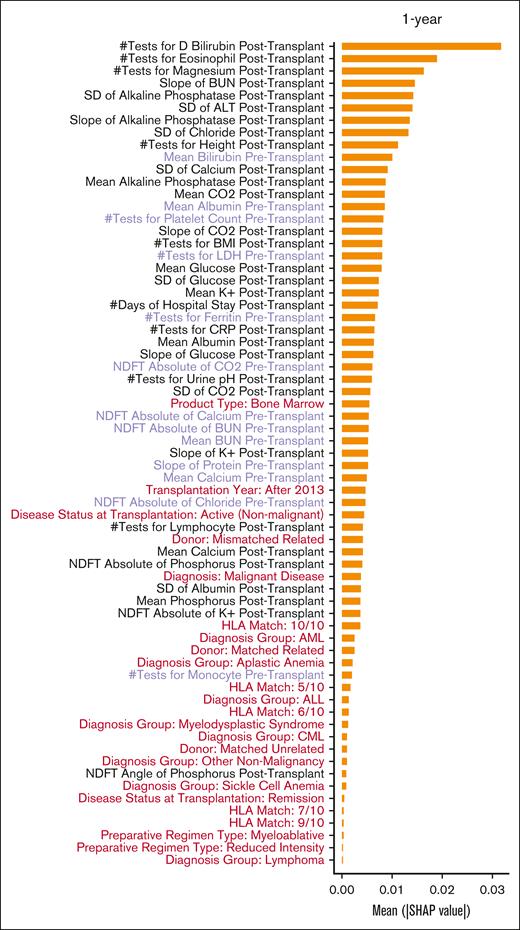
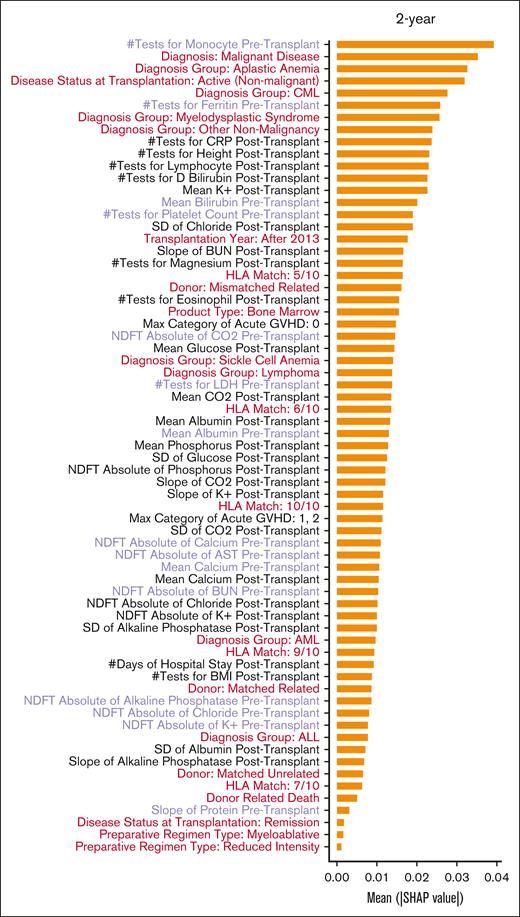
Figure 5 shows a detailed ranking based on the Shapley Additive exPlanations (SHAP)15 values of the predictive importance of the baseline and longitudinal predictors in the full model when predicting different end points of interest. Only 1 baseline variable (transplantation year) and a few pre–allo-HCT laboratory values, such as mean serum albumin, total protein, bilirubin, calcium levels, slope of the change in blood urea nitrogen, and total protein and albumin, were among the important variables for predicting 100-day OS. All other predictors that ranked higher in terms of SHAP values for the 100-day OS prediction were longitudinal variables collected after allo-HCT. Although several other baseline variables, such as graft source and donor, degree of HLA match, and disease diagnosis and status, emerged as being among the more important variables for predicting longer-term OS (at 1 and 2 years after transplant), the longitudinal laboratory values remained among the most important predictors of survival.
SHAP values of variables included in the full models predicting 100-day, 1-year, and 2-year OS. The SHAP values were calculated as the average across the replicates and bootstraps. Baseline variables are in red, longitudinal variables collected before allo-HCT are in purple, and longitudinal variables collected after allo-HCT are in black. Abbreviations: ALL: acute lymphocytic leukemia; ALT: alanine aminotransferase; AML: acute myeloid leukemia; AST: aspartate aminotransferase; BMI: body mass index; BUN: blood urea nitrogen; CML: chronic myeloid leukemia; CO2: carbon dioxide or bicarbonate; CRP: C reactive protein; D Bilirubin: direct Bilirubin; GVHD: graft versus host disease; HLA: human leucocyte antigen; K+: potassium; LDH: lactate dehydrogenase; NDFT: non-uniform discrete Fourier transform; SD: standard deviation.
SHAP values of variables included in the full models predicting 100-day, 1-year, and 2-year OS. The SHAP values were calculated as the average across the replicates and bootstraps. Baseline variables are in red, longitudinal variables collected before allo-HCT are in purple, and longitudinal variables collected after allo-HCT are in black. Abbreviations: ALL: acute lymphocytic leukemia; ALT: alanine aminotransferase; AML: acute myeloid leukemia; AST: aspartate aminotransferase; BMI: body mass index; BUN: blood urea nitrogen; CML: chronic myeloid leukemia; CO2: carbon dioxide or bicarbonate; CRP: C reactive protein; D Bilirubin: direct Bilirubin; GVHD: graft versus host disease; HLA: human leucocyte antigen; K+: potassium; LDH: lactate dehydrogenase; NDFT: non-uniform discrete Fourier transform; SD: standard deviation.
Sensitivity analyses
Detailed results of the sensitivity analyses are provided in the supplemental Results. Briefly, in the first sensitivity analysis, after excluding patients with active or refractory disease or missing disease status from the model training, the full model performed the best of the 3 in predicting 100-day OS, and it outperformed the base-only model in predicting 1-year and 2-year OS (supplemental Figures 1 and 2). In the second sensitivity analysis, the predictive ability of the new base-plus model, which incorporated the latest available laboratory data collected between days −30 and −7 as a part of the baseline variables, surpassed that of the base-only model. However, the longitudinal-only and full models, which include more comprehensive longitudinal information, still outperformed the base-plus model in predicting all 3 end points of interests (100-day, 1-year, and 2-year OS) (compare supplemental Figures 3 and 4 with Figures 3 and 4).
External validation
Detailed results of the external validation are provided in the supplemental Material. Briefly, the full model outperformed the others in predicting 100-day and 1-year OS in the MSKCC cohort (supplemental Figures 5 and 6). Although the full-model AUC was slightly smaller than that obtained with the base-only model when predicting long-term OS (ie, 2-year OS), the overall results are consistent with our findings based on the St Jude validation cohort.
A demonstration of the validated model is available at https://sjbiostat.shinyapps.io/pedsHCT/.
Discussion
This cohort study showed that ML models developed by incorporating longitudinal data collected from 30 days before to 30 days after allo-HCT can accurately predict short-term (100-day), intermediate-term (1-year), and long-term (2-year) OS of pediatric patients undergoing their first allo-HCT. When compared with models constructed from baseline variables alone, the ML models incorporating longitudinal data were better at discriminating between patients predicted to be deceased or alive at the given time points. Importantly, unlike traditional prognostic tools that use fixed variables for risk assessment, our model incorporates dynamic variability in the clinical and laboratory data, which is critical for improving mortality prediction.
Risk stratification of patients based on biological and clinical factors to predict treatment outcomes and guide treatment decisions is a cornerstone of modern oncology. Many such risk-prediction models are currently used in allo-HCT practice. The HCT-CI assigns weights to a composite of 17 baseline organ function criteria present before allo-HCT to predict nonrelapse mortality after allo-HCT.5 Adding more comorbidities while adapting the HCT-CI for pediatric patients did not enhance its discriminative capacity.16 Although adding pre–allo-HCT laboratory assessments such as ferritin, albumin, and platelet count augmented the HCT-CI,17 it only improved the concordance statistic of the score marginally.18 These observations not only suggest the limitations of using only the fixed baseline variables at the time of allo-HCT for risk prediction but also indicate that including biomarkers might be key to improving prediction capabilities. The DRI and disease-risk stratification system use a patient clinical status agnostic approach to risk-categorize patients based on the disease diagnosis, clinical status, or molecular and cytogenetic data.6,19 The European Society for Blood and Marrow Transplantation risk score combines some components of the HCT-CI (age) and DRI (disease stage) and adds some new allo-HCT–related factors (donor details) to the model.4 Although the score remains predictive of outcomes, the incidence of treatment-related mortality is strongly influenced by the allo-HCT conditioning regimen intensity.4 Notably, none of these risk scores incorporate the impact of the conditioning regimen intensity on the patients into the prediction algorithm, even though the conditioning regimen is well-known to be an important predictor of post–allo-HCT outcomes.20 Additionally, their predictive accuracy is limited because of the inherent shortcomings of the components included and the statistical methodology used.7-10
The advent of artificial intelligence and ML offers the opportunity to integrate health data from various sources into personalized patient risk assessments. Many ML methods are readily applicable to complex clinical scenarios, including high-dimensional or even unstructured data involving complex interactions. Early attempts to apply ML algorithms to EMR data have demonstrated their power to accurately predict short-term mortality in general medicine21,22 and oncology settings.23-26 Similar attempts have been made to use large data sets to predict short-term mortality and complications such as GVHD after allo-HCT in adult patients.13,27-30 But to our knowledge, none have integrated longitudinal assessments in outcome prediction. Here, we created a naïve-Bayes model that incorporated numeric longitudinal laboratory values and clinical data to supplement the predictive ability of baseline demographic, disease-related, and allo-HCT–related factors that are traditionally used for survival prediction. Naïve-Bayes was chosen for the model construction mainly because it does not require extensive training data and because it is highly scalable with numerous predictors.14 It is fast and can be used to make real-time predictions, which will be crucial for its future implementation as a clinical decision-making tool.
Adding the longitudinal variables significantly improved the predictive ability of the model compared with using baseline variables alone. The AUC values of the receiver operating characteristic curves were consistently higher for the models incorporating the longitudinal variables than for the model including baseline variables only. The improvement in OS prediction with the inclusion of longitudinal information does, however, tend to decrease over time from the 100-day prediction to the 2-year prediction. This decrease in the discriminatory power of the models incorporating the longitudinal variables at later time points after allo-HCT is probably due to the relatively short window of observation for the longitudinal variables, which was limited to 30 days after allo-HCT for all prediction time points in this study. By extending the window of observation of longitudinal variables to, perhaps, 6 months after allo-HCT or later, we may further improve the prediction of OS at 1 and 2 years after allo-HCT.
By examining the SHAP values of individual variables, we identified significant predictors that contributed to a given patient being classified as deceased or alive. Many variables with known prognostic implications, such as disease diagnosis, disease status, donor-recipient HLA matching, graft source, and serum albumin and ferritin levels before allo-HCT, were highly predictive of outcomes in the different models. Unsurprisingly, variables such as markers of liver function (serum albumin, total protein, and serum bilirubin) and kidney function (blood urea nitrogen), serum electrolytes, lactate dehydrogenase levels, and blood glucose, collected before or after allo-HCT, also proved to be highly predictive. When the SHAP values were compared across prediction time points, the SHAP values of the different longitudinal measurements, most of which were collected after allo-HCT, were much higher than those of the baseline variables, suggesting that the longitudinal variables are much more important for predicting OS. In certain instances, risk factors that were not explicitly indicated in the model also were noted to be highly predictive. For example, the number of tests performed to check for direct bilirubin after allo-HCT ranked very highly in the models predicting 100-day and 1-year mortality. Veno-occlusive disease or sinusoidal obstruction syndrome of the liver is a known complication of allo-HCT that is associated with high mortality. One of the signs of development of veno-occlusive disease in a patient after allo-HCT is rising serum bilirubin. It is likely that clinicians caring for patients at risk of developing veno-occlusive disease assessed their direct bilirubin more often than patients who were not at such risk. Even though veno-occlusive disease was not explicitly included as a risk factor for mortality in this model, the ML algorithm was able to identify this trend and thus included the number of tests for direct bilirubin after allo-HCT as a prominent predictor in the model. Although some of these covariates (such as the number of tests performed for direct bilirubin assessment or the standard deviation of CO2 and chloride which may indicate acid-base imbalance) might be quite obvious clinically, some others (such as number of tests for magnesium after allo-HCT) may not be as biologically relevant immediately. This is one of the main strengths as well a noted limitation of data-driven methods: the algorithms can identify predictors that otherwise would not be selected based on our current knowledge, but sometimes the underlying biological mechanism may not be apparent. More importantly, these observations suggest not only that dynamic longitudinal variables can supplement the predictive ability of the static baseline variables but also that these long-term measurements reflecting changes in clinical status have much more discriminatory power to identify patients who are likely to have poor outcomes, even at distal time points. This provides an excellent window of opportunity during which intensive supportive-care measures to prevent further organ dysfunction or improve organ function might be instituted, thereby improving patient outcomes. Our future endeavors will focus on predicting these adverse events, such as organ dysfunction, and complications such as GVHD after allo-HCT, which eventually lead to mortality, therefore helping clinicians institute appropriate measures to mitigate these adversities.
The results of this study must be considered in light of the following limitations. First, this was a retrospective analysis based on data routinely collected during patient care. Accordingly, several baseline variables were missing for some patients, and these had to be imputed to generate a complete data set for training and validation. Although using multiple imputations, rather than a single “best guess,” might have enhanced the model calibration and avoided over-fitting on imputed values, any nonrandom missingness may still bias results. Second, the model was developed on a data set from a single academic quaternary-care referral center, which may limit its generalizability. However, we validated our results on an external data set with very different patient characteristics (from MSKCC) with similar prediction accuracy, highlighting the model’s robustness. Even though the St Jude and MSKCC data sets differed significantly in several critical baseline variables, the model was highly discriminatory when applied to the MSKCC data set, underscoring the fundamental principles on which the model is based. Third, this model did not include recipients of allogeneic umbilical cord blood grafts or autologous hematopoietic stem cell rescue or those who received an allo-HCT for a solid tumor as the indication. There were too few patients in the training cohort who met these criteria and, hence, limited outcome information can be robustly and reliably extracted from these covariates. Hence, these patients were excluded from the model development, and the results may not be generalizable to them.
To our knowledge, this is the first report of ML being used to identify allo-HCT recipients at risk of short-term or long-term mortality by incorporating longitudinal data collected during clinical care before and after allo-HCT. This proof-of-concept study highlights the importance of incorporating longitudinal post–allo-HCT data in these prediction algorithms. Prospective validation of this model will enable the development of a clinical decision support tool to complement clinical intuition and enable clinicians to deliver evidence-informed care based on real-time patient data and thereby improve clinical outcomes.
Acknowledgments
The authors thank Keith A. Laycock for scientific editing of the manuscript.
Y.Z., J.S., D.C.S., C.L., Y.S., S.S.M., S.N., B.M.T., L.T., and A.S. are supported for their work at St Jude Children’s Research Hospital by the American Lebanese Syrian Associated Charities and National Institutes of Health/National Cancer Institute grant (P30 CA021765). R.S. was supported by a Memorial Sloan Kettering Cancer Center Core grant (P30 CA008748) from the National Institutes of Health/National Cancer Institute.
The content is solely the responsibility of the authors and does not necessarily represent the official views of the National Institutes of Health.
Authorship
Contribution: Y.Z., J.S., L.T., and A.S. conceptualized the study, developed methods, implemented computational algorithms, performed data analysis, interpreted results, and wrote the manuscript; D.K. cleaned and processed the data and helped with the implementation of the study procedures; all other authors provided inputs to the study design and critically reviewed the data, the results, and the manuscript draft; and all authors approved the final version of the manuscript.
Conflict-of-interest disclosure: A.S. has received consultant fees from Spotlight Therapeutics, Medexus Inc, Vertex Pharmaceuticals, Sangamo Therapeutics, and Editas Medicine; is a medical monitor for a Resource for Clinical Investigations in Blood and Marrow Transplantation (RCI BMT) clinical trial for which he receives financial compensation; received research funding from CRISPR Therapeutics and honoraria from Vindico Medical Education; and is also the St Jude Children’s Research Hospital site principal investigator for clinical trials of genome editing for sickle cell disease sponsored by Vertex Pharmaceuticals/CRISPR Therapeutics (NCT03745287), Novartis Pharmaceuticals (NCT04443907), and Beam Therapeutics (NCT05456880) (the industry sponsors provide funding for the clinical trials, which includes salary support paid to the investigator’s institution and A.S. has no direct financial interest in these therapies). The remaining authors declare no competing financial interests.
Correspondence: Akshay Sharma, Department of Bone Marrow Transplantation and Cellular Therapy, St Jude Children’s Research Hospital, 262 Danny Thomas Pl, MS 1130, Memphis, TN 38105; email: akshay.sharma@stjude.org.
References
Author notes
∗Y.Z., J.S., and D.K. contributed equally to this study and are joint first authors.
†L.T. and A.S. contributed equally to this study and are joint last authors.
Deidentified data set and data dictionary are available upon request from the corresponding author, Akshay Sharma (akshay.sharma@stjude.org).
All R codes used for analysis are deposited in Github at https://github.com/yiwangz/SS_learning/MLinHCT.
The full-text version of this article contains a data supplement.

