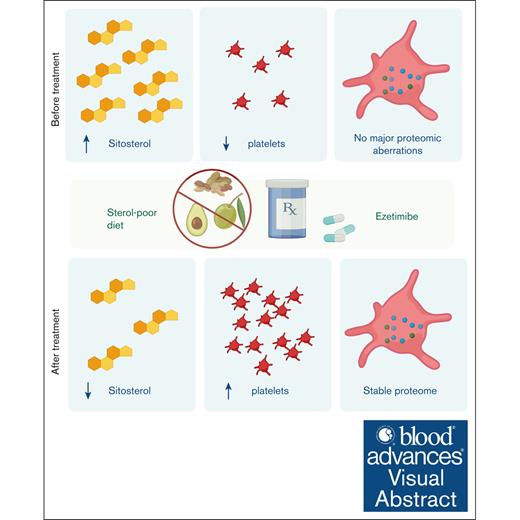
Two pedigrees with suspected chronic immune thrombocytopenia had ABCG5 variants causing sitosterolemia, a metabolic lipid disorder.
The platelet proteomic landscape remains longitudinally stable in the mutant ABCG5 protein before and after the medical intervention.
Visual Abstract
Sitosterolemia is a rare autosomal recessive genetic disorder in which patients develop hypercholesterolemia and may exhibit abnormal hematologic and/or liver test results. In this disease, dysfunction of either ABCG5 or ABCG8 results in the intestinal hyperabsorption of all sterols, including cholesterol and, more specifically, plant sterols or xenosterols, as well as in the impaired ability to excrete xenosterols into the bile. It remains unknown how and why some patients develop hematologic abnormalities. Only a few unrelated patients with hematologic abnormalities at the time of diagnosis have been reported. Here, we report on 2 unrelated pedigrees who were believed to have chronic immune thrombocytopenia as their most prominent feature. Both consanguineous families showed recessive gene variants in ABCG5, which were associated with the disease by in silico protein structure analysis and clinical segregation. Hepatosplenomegaly was absent. Thrombopoietin levels and megakaryocyte numbers in the bone marrow were normal. Metabolic analysis confirmed the presence of strongly elevated plasma levels of xenosterols. Potential platelet proteomic aberrations were longitudinally assessed following dietary restrictions combined with administration of the sterol absorption inhibitor ezetimibe. No significant effects on platelet protein content before and after the onset of treatment were demonstrated. Although we cannot exclude that lipotoxicity has a direct and platelet-specific impact in patients with sitosterolemia, our data suggest that thrombocytopenia is neither caused by a lack of megakaryocytes nor driven by proteomic aberrations in the platelets themselves.
Introduction
Hematologic disease affecting the number of platelets is a common manifestation of numerous underlying conditions. Thrombocytopenia can be caused by underdevelopment, immune-mediated processes, chemotherapy, and infection-related and genetic defects, among others. An accurate identification of the causes of thrombocytopenia is necessary for its adequate management; however, this can be challenging given the high degree of heterogeneity in severity and clinical manifestations.1
Inherited thrombocytopenia consists of a group of disorders with defects in genes regulating megakaryocyte differentiation and platelet production.2,3 Although previously considered a rare disorder, it is now thought that the frequency of inherited thrombocytopenia may be underestimated.4 The variable clinical expression of inherited thrombocytopenia contributes to its underdiagnosis.5 Some patients are asymptomatic, and the relatively mild bleeding symptoms in others can frequently be overlooked until a low platelet count is detected often as part of a routine blood test.
Mediterranean stomatocytosis can exhibit macrothrombocytopenia and mild hemolysis with red cell stomatocytosis.6,7 This condition is a hematologic manifestation of sitosterolemia, a rare autosomal recessive metabolic disorder characterized by the accumulation of dietary sterols.8,9 Sitosterolemia is caused by mutations in ABCG5 and ABCG8, 2 genes encoding members of the adenosine triphosphate (ATP)–binding cassette (ABC) transporter family,10 which form a dimeric complex transporting plant xenosterols out of the cell.4 ABCG5 and ABCG8 are expressed in hepatocytes and enterocytes where they play a fundamental role in lipid metabolism by mediating sitosterol efflux and preventing sterol accumulation.11 Loss of function of this complex leads to clinical variable phenotypes, such as premature atherosclerosis, atherosclerosis, splenomegaly, cardiovascular disease, and xanthoma formation in most cases, and rarely in purely hematologic defects marked by hemolytic anemia, platelet dysfunction, and thrombocytopenia.12 Hematologic abnormalities (hemolytic anemia and macrothrombocytopenia) may be present in 25% to 35% of patients, in whom it is usually associated with the main clinical features, as occurs in 70% of the cases.13
In healthy individuals, cholesterol levels are rather stable and hardly influenced by daily intake. In contrast, individuals affected by sitosterolemia show increased intestinal absorption and decreased biliary excretion of dietary sterols, hypercholesterolemia, and premature coronary atherosclerosis.14 Sitosterolemia is the only form of hypercholesterolemia that responds to the dietary restriction of foods rich in plant sterols, such as vegetable oils, margarine, wheat germs, nuts, seeds, avocado, and chocolate.15,16 Hypercholesterolemia in patients with sitosterolemia is responsive to bile acid sequestrants but not to statins.17 Hence, medical intervention consists of a sterol-free diet and the sterol absorption inhibitor, ezetimibe.18,19
Hematologic abnormalities (hemolytic anemia and/or macrothrombocytopenia) are present in a minority of patients with sitosterolemia.13,20 It has been suggested that the hematologic abnormalities in sitosterolemia are caused by the accumulation of circulating sterols in the blood cell membranes.21 How xenosterol accumulation affects platelet numbers in sitosterolemia and why in only some individuals is not understood. Bleeding abnormalities and macrothrombocytopenia in a mouse model of sitosterolemia are thought to be caused by direct plant sterol incorporation into the platelet membrane and premature clearance.21 However, it has also been suggested that the direct lipotoxicity exerted on circulating cells and blood components could account for low platelet numbers.22,23 Nevertheless, the impact of sitosterolemia on platelet content remains unknown. Recent advancements in mass spectrometry–based platelet proteomics have provided novel insights that have improved our understanding of the biological processes that regulate platelets in health and disease.24
In this study, we aimed to characterize the effect of ABCG5 mutations for their impact on the platelet proteome and assess the effect of the aforementioned medical intervention. Therefore, we characterized the platelet proteome in the hematologic presentation of sitosterolemia in 4 individuals from 2 unrelated pedigrees with ABCG5 mutations. Patients were followed up for a year after receiving ezetimibe treatment and dietary restriction of sterols, after which sitosterol levels decreased and platelet counts increased. We assessed the effect of medical intervention on platelet content by comparing the time points before and after treatment using mass spectrometry–based proteomics to better understand the hematologic presentation of sitosterolemia.
Methods
Blood collection and platelet preparation
Heparinized venous blood was collected from 4 healthy donors and 4 patients with homozygous sitosterolemia before and after treatment with informed consent, following Dutch regulations and the Declaration of Helsinki. Platelets were prepared as previously described.25 In short, platelet-rich plasma was obtained by centrifuging whole blood for 20 minutes at 120 g. To isolate platelets, platelet-rich plasma was centrifuged for 10 minutes at 2000 g. The pellet was resuspended in a buffer comprising 36 mmol/L citric acid, 103 mmol/L NaCl, 5 mmol/L KCl, 5 mmol/L EDTA, 5.6 mmol/L D-glucose, and 10% (volume/volume [v/v]) anticoagulant citrate dextrose A (BD, Plymouth, United Kingdom) at pH 6.5. Approximately 100 × 1010 cells were lysed in 8M urea and 100mM Tris and sonicated for 10 minutes. Proteins (5-20 μg) were reduced and alkylated using dithiothreitol and iodoacetamide, followed by trypsin digestion. Peptides weredesalted with Empore-C18 Stage Tips and eluted with 0.5% (v/v) acetic acid and 80% (v/v) Acetonitrile.
Mass spectrometry and data analysis
Liquid chromatography–tandem mass spectrometry was performed as described previously.26 Platelet samples were analyzed in triplicate. All data were acquired using the Xcalibur software. Raw files were processed using MaxQuant (2.0.1.0) and UniProt database containing reviewed proteins only (2040 entries, downloaded on 8 April 2021). The output files were further analyzed in R (v.2022.02.3). Contaminants and reverse values were filtered. Proteins were included in the analysis if they were present in at least 60% of the control samples or in patients in this study. Missing values were replaced with random values from a downshifted normal distribution (width = 0.3 standard deviations [SDs] and down shift = 1.8 SDs of nonmissing data). Statistical analysis was performed using the limma package, and proteins were considered significant when presenting an absolute log2fold change of >1 and a P value of <.05. The results were censored for comparisons in which all conditions contained imputed values to limit potential false positives owing to the imputation strategy. Gene ontology (GO) over representation analysis and enrichment maps were performed using the ClusterProfiler package.27 Protein modules were defined using the weighted gene coexpression network analysis (WGCNA).28
Results
Patient mutation and hematologic parameters
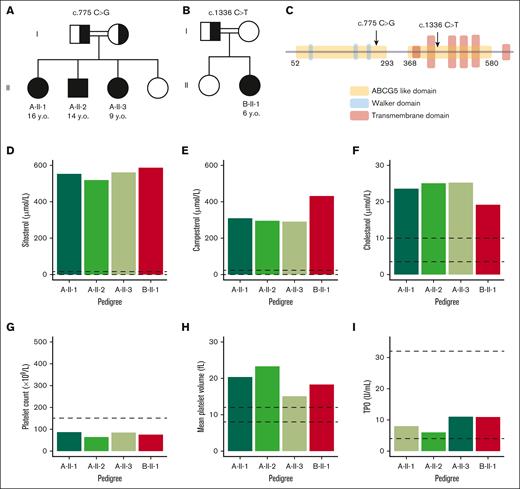
We identified 2 families with sitosterolemia, initially diagnosed with chronic immune thrombocytopenia. Targeted next-generation sequencing panel testing showed homozygous gene variants in ABCG5 (Figure 1A-B). These mutations were predicted to cause a splice defect (c.775-3C>G) and a premature stop codon (c.1336C>T) before the transmembrane coils in pedigrees A and B, respectively (Figure 1C). Pedigree A showed the first family with 3 affected homozygous siblings: A-II-1 (aged 16 years), A-II-2 (aged 14 years), A-II-3 (aged 9 years), and 1 unaffected (Figure 1A). Pedigree B showed the second family with 1 affected homozygous sibling, B-II-1 (aged 6 years), and 1 unaffected (Figure 1B). In both pedigrees, parents were consanguineous and heterozygous for the variants. Only individuals homozygous for the ABCG5 gene variant presented sitosterol levels >500 μmol/L (Figure 1D), with similar abnormalities in campesterol and cholestanol levels (Figure 1E-F).
Patients’ genetics and hematologic characteristics before treatment. (A-B) Family pedigrees: double line shows a consanguineous union; filled symbol, affected individuals; half-filled symbols, heterozygous unaffected carrier; open symbols, not affected. (A) Pedigree A with propositus A-II-1, A-II-2, and A-II-3. (B) Pedigree B with propositus B-II-1. (C) Molecular annotation of the ABCG5 variants reported here. (D-F) Sterol levels in plasma. (D) Sitosterol. (E) Campesterol. (F) Cholestanol. (G) Platelet count. (H) Mean platelet volume. (I) Thrombopoietin (TPO). Dotted lines show the normal plasma parameters.
Patients’ genetics and hematologic characteristics before treatment. (A-B) Family pedigrees: double line shows a consanguineous union; filled symbol, affected individuals; half-filled symbols, heterozygous unaffected carrier; open symbols, not affected. (A) Pedigree A with propositus A-II-1, A-II-2, and A-II-3. (B) Pedigree B with propositus B-II-1. (C) Molecular annotation of the ABCG5 variants reported here. (D-F) Sterol levels in plasma. (D) Sitosterol. (E) Campesterol. (F) Cholestanol. (G) Platelet count. (H) Mean platelet volume. (I) Thrombopoietin (TPO). Dotted lines show the normal plasma parameters.
Any bleeding diathesis in our patients was absent, but patients presented a platelet count below 100 × 109/L (Figure 1G) and a mean platelet volume (MPV) larger than 12 fL (Figure 1H). We did not observe altered thrombopoietin levels in any of the patients (Figure 1I). Moreover, bone marrow samples of propositus B-II-1 showed normal numbers of megakaryocytes (supplemental Table 1). The patients did not present with hemolytic anemia or other sitosterolemia-related symptoms, such as cardiovascular complications. Hepatosplenomegaly was also absent.
Effects of ezetimibe and dietary sterol restriction on sitosterol levels and thrombocytopenia
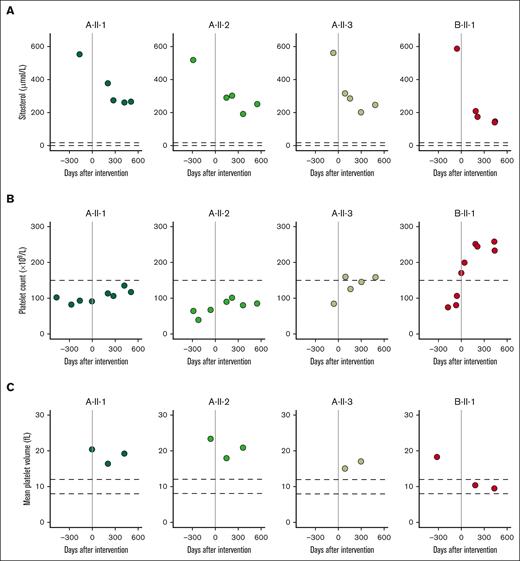
Treatment with the sterol absorption inhibitor ezetimibe combined with a sterol-poor diet was prescribed. We performed longitudinal monitoring after starting ezetimibe treatment combined with dietary restrictions for ∼1 year. This treatment regimen significantly reduced sitosterol blood levels (Figure 2A; P value = 1.81 × 10⁻⁷) and simultaneously increased platelet counts significantly (Figure 2B; P value = .017). As expected, sitosterol levels and platelet count were inversely correlated, with a Pearson coefficient of –0.63 (supplemental Figure 1A). After a year of follow-up, all affected individuals are without complaints to date. Notably, the index case in pedigree B (B-II-1) exhibited a more robust response to treatment and was the only patient who reached a normal MPV (Figure 2C). In contrast, index cases in pedigree A exhibited more modest changes, and only A-II-3 reached a normal platelet count. Treatment in our patients reduced lipid levels to subnormal concentrations while normalizing hematologic parameters at the same time.
Longitudinal hematologic parameters before and after treatment. Patients were followed up for ∼1 year, with samples collected throughout this time. (A) Sitosterol plasma levels. (B) Platelet count. (C) MPV.
Longitudinal hematologic parameters before and after treatment. Patients were followed up for ∼1 year, with samples collected throughout this time. (A) Sitosterol plasma levels. (B) Platelet count. (C) MPV.
Depth and stability of platelet proteomic profiling
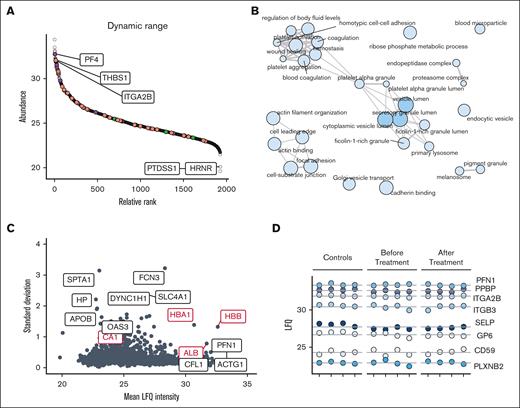
The protein products of the ABCG5 and ABCG8 genes form a dimeric ATP-binding cassette protein (sterolin).11 ABCG5 and ABCG8 serve specifically to exclude noncholesterol sterol entry at the intestinal level and are involved in sterol excretion at the hepatobiliary level.11 To investigate the effect of elevated plasma sterols on platelet protein content, we opted for a proteomics approach to analyze the platelets before and ∼1 year after treatment of all patients (homozygous subjects) and to compare them with healthy controls. First, we inspected the depth of the measured platelet proteome. Plotting label-free quantification intensities against ranked abundance illustrated that the dynamic range of the platelet proteome spanned >10 orders of magnitude (Figure 3A). The main platelet proteins, such as ITGA2B (integrin alpha 2b), as well as staple alpha granule components THBS1 (thrombospondin-1) and PF4 (platelet factor 4) were abundantly present. Low-abundant proteins included HRNR (hornerin) and PTDSS1 (phosphatidylserine synthase 1). Notably, no sterolins were detected in the control or patient platelets, corroborating that its function is mostly relevant at the level of the digestive tract. GO term enrichment of all quantified proteins confirmed the overrepresentation of platelet-associated terms, such as platelet aggregation and platelet alpha granules (Figure 3B). Next, the sample variance and reproducibility were examined. The SD was calculated and compared with the relative median label-free quantification intensities. (Figure 3C). Most proteins (99%) presented an SD smaller than 2, including potential copurified plasma proteins CA1 (carbonic anhydrase 1) and hemoglobins (HBA1 and HBB). Proteins with the highest observed SDs included low-abundant proteins and potential blood contaminants such as red cell–derived SPTA1 (spectrin alpha erythrocytic 1). PFN1 (profilin-1) and ACTG1 (actin cytoplasmic 1) presented the lowest abundance. Further examination of typical platelet proteins across the dynamic range of measured proteins confirmed their stability (Figure 3D). Together, these findings show the robustness of the proteomics method and highlight the comparability of platelet specimens from (pediatric) patients with sitosterolemia and healthy (adult) controls.
Proteomic depth and stability. (A) Dynamic range of quantified proteins; label-free quantification (LFQ) intensities are shown. (B) GO term enrichment network of all quantified proteins. The node size is proportional to the number of proteins associated with GO annotation. Node color intensity denotes P values, whereas edge width denotes term similarities based on Jaccard’s similarity. (C) Scatterplot of SD and mean protein abundances. (D) LFQ intensities of proteins covering the range of measurement. Lines denote the mean intensities.
Proteomic depth and stability. (A) Dynamic range of quantified proteins; label-free quantification (LFQ) intensities are shown. (B) GO term enrichment network of all quantified proteins. The node size is proportional to the number of proteins associated with GO annotation. Node color intensity denotes P values, whereas edge width denotes term similarities based on Jaccard’s similarity. (C) Scatterplot of SD and mean protein abundances. (D) LFQ intensities of proteins covering the range of measurement. Lines denote the mean intensities.
Assessment of the effects of ezetimibe and dietary sterol restriction on platelet proteomes
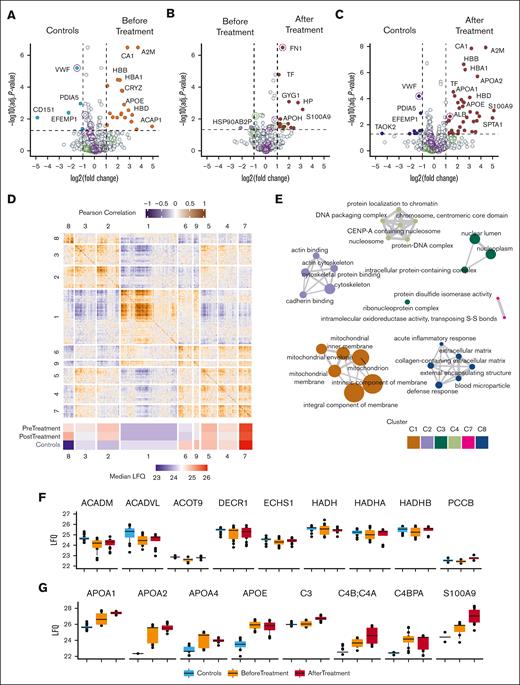
Bleeding abnormalities and macrothrombocytopenia in sitosterolemia are thought to be predominantly due to direct plant sterol incorporation into the platelet membrane, resulting in platelet hyperactivation and premature clearance.21 To investigate the underlying mechanism responsible for platelet aberrations in sitosterolemia, in particular its impact on the proteome, we first compared the platelet proteome in our patients before treatment with platelets from healthy controls using label-free proteomics. The patients’ platelet proteome exhibited a differential abundance of 30 proteins, including CD151, EFEMP1, and von Willebrand factor, which were lower in patients (Figure 4A; supplemental Table 2). CD151 is a membrane known to form a complex with integrins and to regulate cell adhesion and migration.29 Notably, no other membrane proteins detected were differentially expressed (supplemental Figure 2). Conversely, several proteins in the platelet proteome were significantly upregulated at the time of diagnosis, including A2M (alpha-2-macroglobulin) and the apolipoproteins APOA1, APOA2, and APOE. Hence, some proteins that seem to be more abundant in patient platelets were potential plasma contaminants or derived from other contaminating blood components (eg, hemoglobin alpha and beta chains [HBA1, HBB] and erythrocyte-derived CA1). GO enrichment analysis revealed that cholesterol/sterol transfer activity, lipoprotein particle receptor, and protein lipid complex binding molecular functions were increased in patients regardless of treatment (supplemental Figure 3A-C). These data suggest a cellular response to the high plasma lipid levels, which, despite significantly dropping after treatment, remained higher than normal levels.
Proteomic landscape of platelets from controls and patients before and after treatment. (A) Volcano plot comparing the platelet proteomes of patients with sitosterolemia before treatment and healthy controls. Upregulated proteins in patients are shown in orange, whereas downregulated proteins are shown in blue. (B) Volcano plot comparing proteomic profiles of patients before and after treatment. Upregulated proteins after the treatment are shown in red. (C) Volcano plot comparing the platelet proteomes of patients with sitosterolemia after treatment and healthy controls. Upregulated proteins in patients are shown in red, whereas downregulated proteins are shown in dark blue. (A-C) Circles are drawn around granule-derived proteins: purple = alpha granules; green = dense granules. The difference in the expression is shown on the x-axis, and the logarithmic P value (–log(P value)) is shown on the y-axis. Dotted lines indicate the threshold of significance with the horizontal line marking a –log10 (adjusted P value) of 1, and the vertical dotted lines marking a log2(fold change) of 1. For a complete list of the significantly regulated proteins, refer to the supplemental Tables. (D) Heat map of Pearson correlation coefficient of the pairwise comparison of all quantified proteins in this study. The row and column splits are based on WGCNA-defined functional modules, which are numbered. Color gradients denote coefficients (purple: −1, white: 0, orange:1). A heat map of the median module intensity per condition is annotated below. Colors reflect the LFQ intensity. (E) GO term enrichment of functional modules. Color indicates module, node size indicates amount of proteins with a GO term annotation, and edge width denotes GO term similarities based on Jaccard’s similarity. (F-G) Box plots showing protein intensities (LFQ) of a selection of proteins in module 8 associated with an inflammatory response (F) or blood microparticles (G). The black dots represent the individual measurements.
Proteomic landscape of platelets from controls and patients before and after treatment. (A) Volcano plot comparing the platelet proteomes of patients with sitosterolemia before treatment and healthy controls. Upregulated proteins in patients are shown in orange, whereas downregulated proteins are shown in blue. (B) Volcano plot comparing proteomic profiles of patients before and after treatment. Upregulated proteins after the treatment are shown in red. (C) Volcano plot comparing the platelet proteomes of patients with sitosterolemia after treatment and healthy controls. Upregulated proteins in patients are shown in red, whereas downregulated proteins are shown in dark blue. (A-C) Circles are drawn around granule-derived proteins: purple = alpha granules; green = dense granules. The difference in the expression is shown on the x-axis, and the logarithmic P value (–log(P value)) is shown on the y-axis. Dotted lines indicate the threshold of significance with the horizontal line marking a –log10 (adjusted P value) of 1, and the vertical dotted lines marking a log2(fold change) of 1. For a complete list of the significantly regulated proteins, refer to the supplemental Tables. (D) Heat map of Pearson correlation coefficient of the pairwise comparison of all quantified proteins in this study. The row and column splits are based on WGCNA-defined functional modules, which are numbered. Color gradients denote coefficients (purple: −1, white: 0, orange:1). A heat map of the median module intensity per condition is annotated below. Colors reflect the LFQ intensity. (E) GO term enrichment of functional modules. Color indicates module, node size indicates amount of proteins with a GO term annotation, and edge width denotes GO term similarities based on Jaccard’s similarity. (F-G) Box plots showing protein intensities (LFQ) of a selection of proteins in module 8 associated with an inflammatory response (F) or blood microparticles (G). The black dots represent the individual measurements.
Next, we compared platelet proteomes before and ∼1 year after treatment (Figure 4B). Only 19 proteins showed significant changes in abundance, representing only 1.01% of the total proteins reliably quantified. Notably, HSP90AB2P was significantly downregulated. GO enrichment analysis of biological processes revealed that the response to toxic substances and lipoprotein remodeling increased (supplemental Figure 3D-F). Finally, we compared the proteome of the patients ∼1 year after treatment with that of the controls. Highlighted by the largely unaffected granule content (Figure 4A-C), the patient platelet proteome remained stable longitudinally, whereas sitosterol levels decreased and platelet counts increased, even to normal ranges in patients A-II-3 and B-II-1.
Prompted by the limited impact on the proteome, we explored whether there were networks of covarying protein trends in play. To this end, we used weighted gene coexpression network analysis (WGCNA) to define and analyze the coregulated and interconnected protein profiles.28 WGCNA resulted in 8 modules containing 61 to 614 proteins. We combined pairwise Pearson coefficients with module allocations to visualize a correlation map of proteins in this study and annotated the median expression of each module per grouped condition (Figure 4D). Modules 1 and 2 were the largest ones, whereas module 8 was the smallest. Module 8 was the most different between controls and patient treatment conditions. These proteins were annotated for their biological processes, as proteins within the same modules likely share biological functions (Figure 4E). This revealed that modules 1, 2, and 8 were enriched for mitochondria, cytoskeleton, and blood particles, respectively. Given that module 1 was enriched for mitochondria-related terms and the fact that lipid catabolism happens in the mitochondria, we examined the intensity profiles of proteins involved in fatty acid beta-oxidation, as annotated in the Reactome30 database (Figure 4F). Several members of this pathway presented lower levels than those in the controls. Some notable examples are medium-chain specific acyl-coenzyme A (CoA) dehydrogenase (ACADM), very long-chain specific acyl-CoA dehydrogenase (ACADV), acyl-CoA thioesterase 9 (ACOT9), and propionyl-CoA carboxylase beta chain (PCCB). These data suggest a potential impact of high sterol levels on the mitochondrial level, particularly affecting fatty acid beta-oxidation.
Based on the observation that the median intensities of module 8 were higher before and after treatment in patients than in healthy controls (Figure 4D), we inspected this module more closely. This module was largely composed of proteins enriching for acute inflammatory response, blood microparticles, extracellular matrix, and other potential copurified proteins. Comparing the protein levels of platelets after treatment with controls showed that apolipoproteins APOA1, APOA2, APOA4, and APOE remained at an increased expression level, suggesting prevalent microparticles such as lipoproteins and chylomicrons (Figure 4G). Plasma proteins such as S100A9 and complement-related proteins C3, C4A:C4B and C4BPA, that are known to be involved in inflammation, were also in module 8 and showed higher levels in patients that in controls, irrespective of treatment, which makes inflammation a very unlikely driver of thrombocytopenia, as suppported by low-C reactive protein levels (data not shown).
Individual proteomic trends
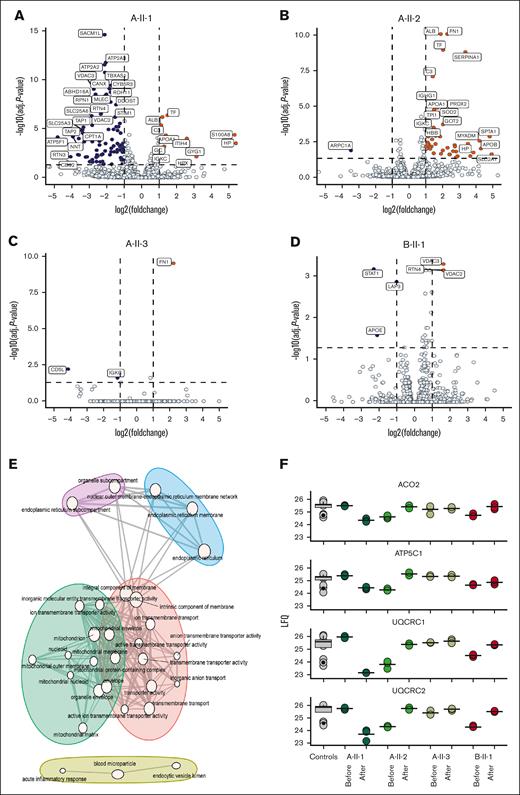
Principal component analysis showed patients did not group based on pedigree or treatment, suggesting that individual trends could provide further insight (supplemental Figure 4A). To identify interindividual differences in the platelet proteome in response to ezetimibe, the pre- and posttreatment proteomes were compared per individual (Figure 5A-D). Curiously, index cases A-II-3 and B-II-1, who presented the best response to treatment and reached a normal platelet count, showed the least amount of proteins changing over time, with only 3 to 6 proteins changing. This suggested that thrombocytopenia in our patients with sitosterolemia is not associated with proteomic aberrations. In total, 129 different proteins were significantly regulated, with most proteins changing in index cases A-II-1 and A-II-2. Nonetheless, to gain insight into the biological processes that might be affected by lipid content, we performed an enrichment analysis on the proteins that characterized individual trends (Figure 5E), as exemplified by voltage-dependent anion-selective channel protein 2 and voltage-dependent anion-selective channel protein 3, in individuals A-II-1 and B-II-1 (Figure 5A-D). Interestingly, GO terms associated mostly with mitochondria, endoplasmic reticulum, transporter activity, and inflammatory response. As expected, there was a noticeable overlap with the enrichment analysis of WGCNA modules. Based on these observations, we plotted some of the mitochondrial proteins showing individual trends (Figure 5F). Several of these proteins showed distinct expression profiles in the patients before and after treatment. Remarkably, this included acyl-CoA thioesterase 9 mitochondrial (ACOT9), which is involved in the catabolism of fatty acids, as well as proteins that are involved in mitochondrial respiration and ATP synthesis: ATP synthase subunit gamma (ATP5F1C) and cytochrome b-c1 complex subunits 1 and 2 (UQCRC1 and UQCRC2). Similar trends could be appreciated in these proteins, marked by an increase in A-II-2 and B-II-1 after treatment, a decrease in A-II-1, and no change in A-II-3. Together, these observations point at individual heterogeneity.
Proteomic landscape of platelets from controls and patients before and after treatment. Volcano plot comparing proteomic profiles before and after treatment of individual patients. (A) Index case A-II-1. (B) Index case A-II-2. (C) Index case A-II-3. (D) Index case B-II-1. Upregulated proteins in patients are shown in orange, whereas downregulated proteins are shown in dark blue. Difference in expression is shown on the x-axis, and the logarithmic P value (–log(P value)) is shown on the y-axis. Dotted lines indicate the threshold of significance with the horizontal line marking a –log10 (adjusted P value) of 1, and the vertical dotted lines marking a log2(fold change) of 1. (E) GO term enrichment of functional modules. Color indicates module, node size indicates amount of proteins with a GO term annotation, and edge width denotes GO term similarities based on Jaccard’s similarity. (F) Box plots showing the protein intensities (LFQ) of a selection of mitochondrial proteins. Black dots represent individual measurements.
Proteomic landscape of platelets from controls and patients before and after treatment. Volcano plot comparing proteomic profiles before and after treatment of individual patients. (A) Index case A-II-1. (B) Index case A-II-2. (C) Index case A-II-3. (D) Index case B-II-1. Upregulated proteins in patients are shown in orange, whereas downregulated proteins are shown in dark blue. Difference in expression is shown on the x-axis, and the logarithmic P value (–log(P value)) is shown on the y-axis. Dotted lines indicate the threshold of significance with the horizontal line marking a –log10 (adjusted P value) of 1, and the vertical dotted lines marking a log2(fold change) of 1. (E) GO term enrichment of functional modules. Color indicates module, node size indicates amount of proteins with a GO term annotation, and edge width denotes GO term similarities based on Jaccard’s similarity. (F) Box plots showing the protein intensities (LFQ) of a selection of mitochondrial proteins. Black dots represent individual measurements.
Discussion
Sitosterolemia is an autosomal disorder caused by mutations in ABCG5 or ABCG8.14 Dysfunction of either ABCG5 or ABCG8 results in intestinal hyperabsorption of all sterols, including cholesterol and plant sterols, due to an impaired ability to excrete sterols into the bile.6 Here, we characterized the platelet proteome of 4 individuals from 2 unrelated pedigrees who presented with a hematologic presentation of sitosterolemia using label-free quantitative mass-spectrometry. The effect of treatment on platelets was assessed by comparing the platelets isolated from patients with sitosterolemia before and after treatment. Limited proteomic changes across patients were found, highlighting that thrombocytopenia was not associated with proteomic aberrations in platelets. As reviewed previously,12,13,31,32 >100 sitosterolemia cases have been reported since its first description in 1974.8 A small number of patients presenting with hematologic abnormalities have been reported thus far, some of whom had been misdiagnosed with immune thrombocytopenic purpura or hemolytic anemia for which splenectomy was performed.13,33,34 To our knowledge, this is the first study to report the proteomic characterization of platelets in the context of sitosterolemia and the treatment effects of diet restriction combined with ezetimibe.
Here, the patients were prescribed ezetimibe combined with a low-sterol diet and followed for ∼1 year. Sitosterol levels dropped and platelet numbers increased. Our findings in the 2 unrelated pedigrees are in line with studies performed in experimental models in which the dietary and genetic components of macrothrombocytopenia have been assessed. Both Abcg5–/– and Abcg8–/– mice develop macrothrombocytopenia when fed a high-sterol diet.35-37 However, when fed a sterol-poor diet, these hematologic parameters normalized comparable with those of wild-type mice.37 Hematologic parameters also normalize in Abcg5–/– mice when treated with the sterol absorption inhibitor ezetimibe.37-39 Changes in MPV in our patients were not as clear upon treatment as those in the mouse model.
The platelet protein content was neither considerably different from that of the normal platelet proteome nor did we observe major proteomic alterations upon treatment, even though the platelet count increased. These observations were supported by the fact that the patients presented no bleeding diathesis even when their platelet count was lower than normal levels. Moreover, no significant differences were observed when comparing the content of platelet alpha or dense granules, highlighting the lack of platelet dysfunction.
As expected from the documented tissue expression pattern, both ABCG5 and ABCG8 were not detected in platelets. Available tissue expression data provide evidence that ABCG5 and ABCG8 are exclusively expressed in the liver as well as in the small and large intestine.40 This corroborates their main function in the digestive tract and liver, resulting in a change in microenvironment of sitosterolemia.11 Our data and those of several other studies point to the causative role of the microenvironmental abnormality instead of intrinsic platelet defects as the cause of the hematologic presentation of sitosterolemia.
We observed interesting trends at the level of mitochondrial proteins. First, mitochondrial proteins made up the largest module of covarying proteins, which showed overall lower trends in our patients. It has been previously proposed that phytosterols can target the mitochondria.41 Sitosterol in the mitochondria has been reported to alter cholesterol transport and metabolism, for example by competing with cholesterol and affecting the maintenance of mitochondrial membrane stability.42,43 Second, we observed lower levels of proteins involved in fatty acid beta-oxidation, such as ACADM, very long-chain specific acyl-CoA dehydrogenase, and PCCB in our patients. In accordance, in vitro experiments performed on cardiomyocytes supplemented with phytosterol induced a reduction in metabolic activity and cell growth.44 In addition, lipotoxicity has been previously suggested to promote mitochondrial dysfunction and lead to impaired trichloroacetic acid cycle–related enzymatic processing.45 Curiously, PCCB deficiency can give rise to propionic acidemia, in which patients may also develop thrombocytopenia, anemia, and neutropenia.46 Finally, we observed individual trends in proteins involved in mitochondrial metabolism and respiration, such as acyl-CoA thioesterase ACOT2, ATP synthase, and cytochrome subunits (UQCRC1 and UQCRC2). In some in vitro experiments, beta sitosterol has shown to induce mitochondrial modifications, such as cytosolic release of cytochrome C and to associate with an apoptotic mode of death.47 Interestingly, differential expression of mitochondrial proteins, such as thioesterase ACOT2, has been proposed to play compensatory roles contributing to heterogeneity in clinical severity in subjects with metabolic diseases such as ACADM.48 Together, these data indicate potential lipotoxicity at play.
Whether hematologic effects are caused by sitosterol accumulation (the most abundant accumulating xenosterol) or more bioactive, less abundant xenosterols, is as yet unknown. Xenosterol accumulation has been reported to affect the plasma membrane.13,36,37 We did not have data on the lipid content of the platelets. Future studies could use lipidomic strategies to evaluate the lipid content in blood cells. The mechanism of how xenosterolemia could affect platelet metabolism, particularly in the mitochondria, and platelet clearance also remains to be investigated. Taken together, with the normal megakaryocyte number and morphology as well as normal thrombopoietin levels, we propose that platelet development itself is not abnormal. Instead, proplatelet release, platelet clearance, and lipotoxicity are likely to be the driving factors of thrombocytopenia in sitosterolemia.
Acknowledgments
The authors thank Masja de Haas and Leendert Porcelijn for flow cytometry analysis. The authors are also grateful to the patients and their family members for their participation in the study.
J.D.C. is supported by the SYMPHONY consortium, which received funding from the Netherlands Organisation for Scientific Research (NWO) in the framework of the NWA-ORC Call grant agreement NWA.1160.18.038.
Authorship
Contribution: J.D.C., A.J.H., and T.W.K. wrote the manuscript; A.T.J.T. and M.M.B. performed cell isolation and clinical laboratory analysis; K.v.L. performed DNA analysis; J.D.C. and F.P.J.v.A. performed mass spectrometry analysis; J.D.C., A.J.H., A.B.M., and T.W.K. analyzed the data; T.W.K., M.H.S., and M.M.B. diagnosed and treated the patients and analyzed clinical data; and all authors read and approved the manuscript.
Conflict-of-interest disclosure: The authors declare no competing financial interests.
Correspondence: Arie J. Hoogendijk, Department of Molecular Hematology (Y328), Sanquin Research, Plesmanlaan 125, 1066 CX Amsterdam, The Netherlands; email: a.hoogendijk@sanquin.nl.
References
Author notes
The mass spectrometry proteomics data have been deposited to the ProteomeXchange Consortium via the PRIDE partner repository with the data set identifier PXD041248.
The full-text version of this article contains a data supplement.

