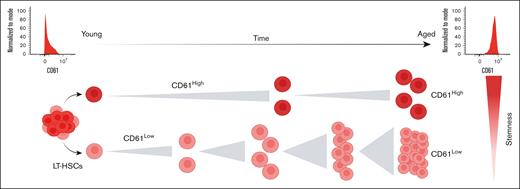
After transplantation, aged CD61High HSCs function similarly compared with young HSCs.
CD61 expression marks a functionally superior population of quiescent long-term HSCs.
Visual Abstract
Aging leads to a decline in function of hematopoietic stem cells (HSCs) and increases susceptibility to hematological disease. We found CD61 to be highly expressed in aged murine HSCs. Here, we investigate the role of CD61 in identifying distinct subpopulations of aged HSCs and assess how expression of CD61 affects stem cell function. We show that HSCs with high expression of CD61 are functionality superior and retain self-renewal capacity in serial transplantations. In primary transplantations, aged CD61High HSCs function similarly to young HSCs. CD61High HSCs are more quiescent than their CD61Low counterparts. We also show that in aged bone marrow, CD61High and CD61Low HSCs are transcriptomically distinct populations. Collectively, our research identifies CD61 as a key player in maintaining stem cell quiescence, ensuring the preservation of their functional integrity and potential during aging. Moreover, CD61 emerges as a marker to prospectively isolate a superior, highly dormant population of young and aged HSCs, making it a valuable tool both in fundamental and clinical research.
Introduction
Hematopoietic stem cells (HSCs) are at the top of the hematopoietic hierarchy and are defined by their unique regenerative potential and ability to give rise to all the blood lineages throughout the lifetime of an organism. Nevertheless, normal aging has been shown to lead to a gradual functional decline of the HSCs.1-3 Upon aging, murine HSCs lose their overall self-renewal and regenerative potential, skew toward the myeloid lineage, and expand in numbers.4-7
Long-term transplantation assays show that aged HSCs, when transplanted into a young bone marrow (BM) microenvironment, display a reduced functional activity, hence the age-related decrease in HSC activity seems to mainly be intrinsically driven.8 Numerous cell-intrinsic defects have been suggested to contribute to the decreased overall potential of aged HSCs, such as the loss of polarity,9,10 impaired autophagy,11,12 DNA damage accumulation,13,14 and epigenetic modifications.15,16 However, it has also been shown that an altered BM microenvironment affects the functional activity of aged HSCs. For example, aged HSCs transplanted into young recipients exhibited reduced myeloid skewing compared with those transplanted into old recipients.17 In addition, BM niche remodeling and localization of HSCs in their niche affect the aging process.18,19 HSC aging is thus a very heterogenous process influenced and regulated by numerous intrinsic and extrinsic mechanisms, with not every individual HSC being equally susceptible to, or affected by, the aging process.20-22 Interestingly, some individual aged HSCs have been shown to function as if they have not aged at all.4,6
Recently, we published a meta-analysis of 16 independent studies in which the transcriptomes of young and aged murine HSCs had been assessed. From these studies, we were able to derive an HSC aging signature, a robust list of genes that are differentially expressed upon murine HSC aging.23 This signature, consisting of ∼200 genes, included an abundance of novel genes previously not associated with aging nor with HSCs. Unexpectedly, almost 50% of the genes in the aging signature encode for membrane-associated genes, which suggests that communication between HSCs and the BM environment is altered during aging.
Itgb3, a membrane-associated gene that encodes for CD61, a widely expressed β-integrin from the integrin family,24,25 was upregulated in 9 of 12 studies used to establish the aging signature. CD61 acts in heterodimers with the α-integrins CD41 and CD51 and is known to regulate cell adhesion, cell signaling, and cell differentiation.26-28 Notably, it is the only member of the integrin family to be present in the aging signature. The role of CD61 in regulating HSCs has been studied previously, and CD61 has been reported to affect several HSC-niche communication pathways, including thrombopoietin-mediated HSC regulation,29 cell adhesion, and inflammation response.30 High expression of CD61 has also been shown to be correlated with a more quiescent subpopulation of HSCs in young mice.31 In contrast, it has also been shown that downregulation or deletion of CD61 in HSCs had little to no effect on the overall functionality of HSCs.29,32 CD61 has, to our knowledge, never been studied in the context of HSC aging.
Because we found CD61 to be 1 of the most robustly upregulated genes in aged HSCs, we aimed to assess whether altered expression of CD61 on aged HSCs coincides with stem cell functioning. Our study shows that CD61 expression identifies a functionally superior population of long-term HSCs (LT-HSCs). This is particularly prominent in aged LT-HSCs, in which CD61 expression can be used to prospectively isolate the most potent LT-HSCs.
Materials and methods
Mice
All experiments were approved by the Central Commission for animal testing and the local Animal Ethical Committee of the University of Groningen. Young (2-4 months old), middle-aged (10-12 months old), and aged (>22 months old) C57BL/6J mice were obtained from either Centrum voor Dierproeven, UMCG or Janvier laboratories, France. Mice were housed in temperature- and day cycle–controlled conditions.
Flow cytometry
BM was isolated from long bones, and erythrocytes were lysed. For cell isolation, the lysed BM cells were stained with antibodies used to detect stem cells. Cells were isolated on MoFlo Astrios or MoFlo XDP cell sorters.
In vitro experiments
Single-cell colony assay
Single LT-HSCs were sorted and cultured for 14 days in StemSpan supplemented with 100 U/mL penicillin, 100 μg/mL streptomycin, 10% Australian fetal calf serum, 300 ng/mL stem cell factor (SCF), 20 ng/mL interleukin-11, and 1 ng/mL Flt3 ligand. The size of the colonies was analyzed after 7 and 14 days.
Single-cell division assay
Single LT-HSCs were sorted and cultured for 2 days in StemSpan supplemented with cytokines (described earlier). The number of cells was analyzed after 48 hours.
γH2AX immunofluorescence staining
LT-HSCs (1000-2000 cells) were sorted on adhesion slide. Cells were fixed, permeabilized, and blocked. Cells were stained with primary α-γH2A histone family member X (H2AX) and secondary conjugated antibody, and the coverslip was mounted. The slide was imaged on a Leica Sp8 confocal microscope. The data were analyzed using Fiji Image J.
Cell cycle analysis
LT-HSCs were sorted, fixed, and stained following the manufacturer’s protocol. Cells were stained with α-Ki67 antibody and 4′,6-diamidino-2-phenylindole. Samples were analyzed on a BD fluorescence-activated cell (FAC) sorter Canto II or BD Symphony.
Inhibitor treatment
The inhibitor treatment was done in single-cell proliferation assays, division assays, and cell cycle analyses according to the protocol described earlier with medium supplemented with 50 ng/mL cyclo cyclic tripeptide Arg-Gly-Asp (RGDγK), 25 ng/mL tirofiban, or dimethyl sulfoxide (DMSO).
For single-cell expansion assays, HemEx-Type9A medium was supplemented with 100 ng/mL thrombopoietin, 10 ng/mL SCF, 50 ng/mL cycloRGDγK, and 25 ng/mL tirofiban or DMSO.
Quantitative polymerase chain reaction (qPCR) analysis
RNA was isolated by using a RNeasy Micro kit. The RNA was transcribed using SuperScript VILO complementary DNA Synthesis kit. The amplicons for CD61 and housekeeping gene Gapdh were amplified and quantified via qPCR using a LightCycler 480 Instrument.
Transplantation
CD61High and CD61Low LT-HSC transplantation
CD61High and CD61Low LT-HSCs were transplanted together with 2 × 10⁶ competitor W41 mouse (C57BL/6J-KitW-41J/J) BM cells into sex-matched, lethally irradiated (9 Gy) recipients. At 16 weeks after transplantation, donor-derived LT-HSCs were transplanted alongside 2 × 10⁶ competitor W41 mouse (C57BL/6J-KitW-41J/J) BM cells into sex-matched, lethally irradiated secondary recipients.
CD61KD LT-HSC transplantation
Transduction
LT-HSCs were isolated and plated 24 hours before transduction in HemEx-Type9A medium supplemented with 100 ng/mL thrombopoietin and 10 ng/mL SCF. The viral supernatant was added to the LT-HSCs the next day.
Transplantation
After 5 days, mCherry+ LT-HSCs were transplanted alongside 2 × 10⁶ competitor W41 BM cells into sex-matched, lethally irradiated recipients.
PB count
Peripheral blood (PB) was collected from the retro-orbital venous plexus in heparinized capillary tubes. PB (25 μL) was used for cell counting using Medonic CA-620.
RNA sequencing
Total RNA was isolated from 5000 LT-HSCs using an RNeasy Plus Micro kit (Qiagen, 74034) according to the manufacturer’s instructions. Library preparation was performed with SMART Ultra-Low Input kit version 4 (Takara) and Nextera XT Library Preparation kit (Illumina). Samples were sequenced using a NextSeq 5000 (Illumina) in the same flow cell and were pulled equimolarly.
Data analysis
Fastq files were quality-control checked using FastQC (0.11.9) and Picard (2.23.0). Reads were mapped to reference mouse genome (GENCODE, GRCm38, M21) using STAR (2.7.0d) with standard arguments and “--outFilterMatchNminOverLread 0.4 --outFilterScoreMinOverLread 0.4.” Unstranded read counts were used to perform differential expression analysis using DESeq2.
Statistical analysis
All experiments were performed as least 2 times. The number of mice or technical replicates is indicated in the figure legends. Data are shown as mean ± standard deviation. Unpaired, 2-tailed Student t test and 2-way analysis of variance with Šidák multiple comparison test were performed in GraphPad Prism versions 9.0 and 10.0. Significant P value was indicated as ∗P < .05, ∗∗P < .01, ∗∗∗P < .001, and ∗∗∗∗P < .0001.
Results
During aging expression of CD61 is specifically increased in the most primitive HSCs
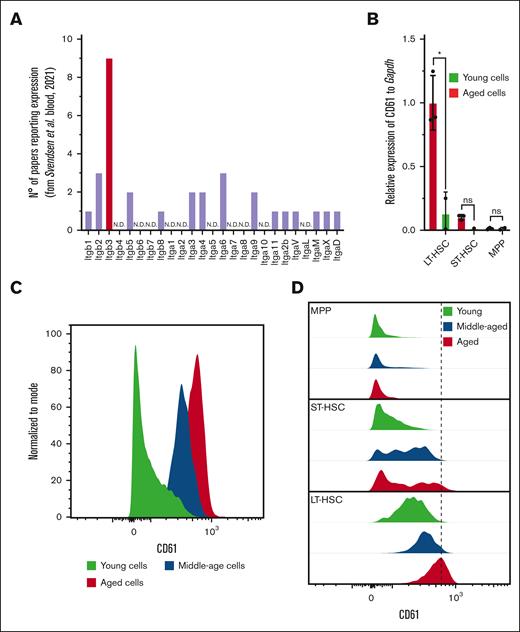
Recently, we published a transcriptome meta-analysis that revealed that Itgb3, the gene encoding for CD61, is the only consistently reported integrin family member that is differentially expressed on murine HSC aging (Figure 1A). Using quantitative reverse transcription PCR, we analyzed various subpopulations within the progenitor cell compartment (Lin−Sca1+c-Kit+) and found that Itgb3 is exclusively upregulated in the most primitive LT-HSCs (Lin−Sca1+c-Kit+CD150+CD48−; Figure 1B; supplemental Figure 1A). With FAC sorting (FACS), we confirmed that increased Itgb3 messenger RNA expression in aged LT-HSCs correlates with increased protein levels (Figure 1C-D).
CD61 expression in LT-HSCs. (A) Number of reports used in the aging signature, reporting differential expression of genes of the integrin family. (B) CD61 messenger RNA (mRNA) expression measured by reverse transcription PCR in LT-HSCs, short-term HSCs (ST-HSCs), and MPP isolated from young (2-4 months old) and aged (>22 months old) mice. (C) Protein level of CD61 on LT-HSCs from young (2-4 months old), middle-aged (10-12 months old) and aged (>22 months old) mice measured by flow cytometry. (D) Protein level of CD61 on LT-HSCs, ST-HSCs, and MPPs from young, middle-aged, and aged mice measured by flow cytometry. MPP, multipotent progenitor.
CD61 expression in LT-HSCs. (A) Number of reports used in the aging signature, reporting differential expression of genes of the integrin family. (B) CD61 messenger RNA (mRNA) expression measured by reverse transcription PCR in LT-HSCs, short-term HSCs (ST-HSCs), and MPP isolated from young (2-4 months old) and aged (>22 months old) mice. (C) Protein level of CD61 on LT-HSCs from young (2-4 months old), middle-aged (10-12 months old) and aged (>22 months old) mice measured by flow cytometry. (D) Protein level of CD61 on LT-HSCs, ST-HSCs, and MPPs from young, middle-aged, and aged mice measured by flow cytometry. MPP, multipotent progenitor.
Furthermore, to assess how expression of CD61 changes during the aging trajectory, we analyzed its expression at different ages. This revealed that CD61 expression increases gradually throughout the lifetime of a mouse (Figure 1C-D).
Aged CD61High and CD61Low express distinct transcriptomes
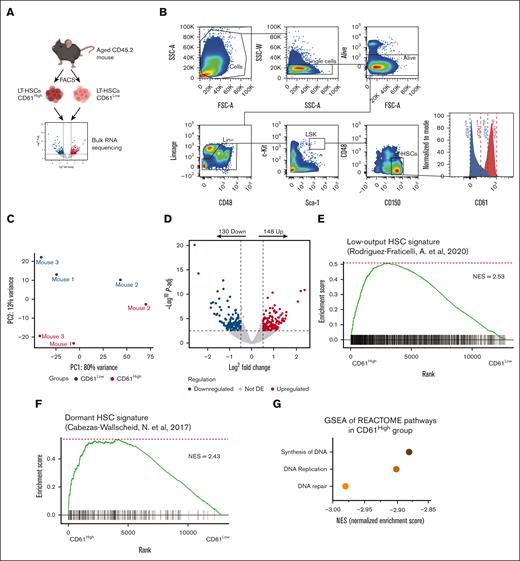
To better understand the role of CD61 upregulation in LT-HSCs upon aging, we performed RNA sequencing on purified aged LT-HSCs separated by CD61 expression. To this end we isolated the 10% highest (CD61High) and lowest (CD61Low) CD61-expressing LT-HSCs (Figure 2A and B).
Transcriptome analysis of aged CD61High and CD61Low LT-HSCs. (A) Schematic representation of the RNA-sequencing experiment (mice age, >22 months). (B) Sorting strategy for CD61High and CD61Low LT-HSCs. (C) MDS plot showing the principal coordinates (PC) analysis of CD61High and CD61Low LT-HSCs. (D) differentially expressed (DE) genes in aged CD61High and CD61Low LT-HSCs. Volcano plot showing distribution of the adjusted P value (−log10P value) and the fold changes (FC; logFC). Upregulated and downregulated genes are indicated in red and blue, respectively (P-adj < .01). (E) Signature enrichment plot from gene set enrichment analysis (GSEA) using a low-output HSC gene set in LT-HSCs from CD61High and CD61Low cells (GSE134242). (F) Signature enrichment plot from GSEA using a dormant HSC gene set in LT-HSCs from CD61High and CD61Low cells (GSE87814). (G) GSEA for the most downregulated pathways in CD61High LT-HSCs. NES, normalized enrichment score.
Transcriptome analysis of aged CD61High and CD61Low LT-HSCs. (A) Schematic representation of the RNA-sequencing experiment (mice age, >22 months). (B) Sorting strategy for CD61High and CD61Low LT-HSCs. (C) MDS plot showing the principal coordinates (PC) analysis of CD61High and CD61Low LT-HSCs. (D) differentially expressed (DE) genes in aged CD61High and CD61Low LT-HSCs. Volcano plot showing distribution of the adjusted P value (−log10P value) and the fold changes (FC; logFC). Upregulated and downregulated genes are indicated in red and blue, respectively (P-adj < .01). (E) Signature enrichment plot from gene set enrichment analysis (GSEA) using a low-output HSC gene set in LT-HSCs from CD61High and CD61Low cells (GSE134242). (F) Signature enrichment plot from GSEA using a dormant HSC gene set in LT-HSCs from CD61High and CD61Low cells (GSE87814). (G) GSEA for the most downregulated pathways in CD61High LT-HSCs. NES, normalized enrichment score.
Although Lin−Sca1+c-Kit+CD150+CD48− cells are highly purified, we found that within this population CD61High and CD61Low expressing cells differed significantly in their transcriptomic landscape (Figure 2C). We identified 278 genes that were significantly differentially expressed between CD61High and CD61Low LT-HSCs (Figure 2D). To compare CD61High and CD61Low LT-HSC transcriptome signatures, we performed gene set enrichment analysis for previously published LT-HSC gene signatures (Rodriguez-Fraticelli, 2020; Cabezas-Wallscheid, 2017). Interestingly, CD61High LT-HSCs showed enrichment for a dormant HSC signature, as well as a low-output HSC signature (Figure 2E-F). Both low-output and dormant HSCs are stem cell populations associated with superior reconstitution and self-renewal potential.33,34 We also found CD61High LT-HSCs to express a myeloid signature (supplemental Figure 2A), and the aging signature was enriched in these cells as well (supplemental Figure 2B-D). Additionally, gene set enrichment analysis showed enrichment of cell cycle–related pathways in CD61Low LT-HSCs, suggesting that these cells are actively cycling, compared with CD61High LT-HSCs (Figure 2G). Together, these data show that aged CD61High LT-HSCs are molecularly distinct from CD61Low LT-HSCs and exhibit a signature that is associated with superior stem cell functionality.
High expression of CD61 in aged LT-HSCs is associated with quiescence
The RNA-sequencing data revealed that aged LT-HSCs with differential CD61 expression are molecularly distinct. Next, we tested whether these molecular differences would translate into functional consequences (Figure 3A).
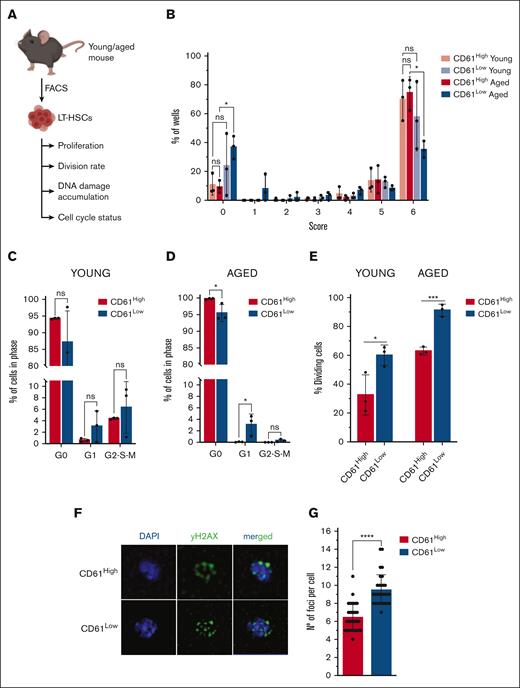
In vitro experiments. (A) Schematic representation of in vitro experiments performed with young and aged LT-HSCs. (B) Single-cell proliferation assay of young and aged CD61High and CD61Low LT-HSCs; size 0: no cells; size 1: 1 to 30 cells; size 2: 31 to 100 cells; size 3: 101 to 1000 cells; size 4: 5000 cells; size 5: 15 000 cells; size 6: 30 000 cells; and size 7: >30 000 cells. (C) Cell cycle analysis using Ki67/4′,6-diamidino-2-phenylindole (DAPI) staining of young CD61High and CD61Low LT-HSCs. (D) Cell cycle analysis using Ki67/DAPI staining of aged CD61High and CD61Low LT-HSCs. (E) Single-cell division assay of young and aged CD61High and CD61Low LT-HSCs. (F) DAPI/γH2AX immunofluorescent staining of aged CD61High LT-HSCs, CD61Low LT-HSCs and LT-HSCs. (G) Number of γH2AX foci per cell in CD61High and CD61Low aged LT-HSCs.
In vitro experiments. (A) Schematic representation of in vitro experiments performed with young and aged LT-HSCs. (B) Single-cell proliferation assay of young and aged CD61High and CD61Low LT-HSCs; size 0: no cells; size 1: 1 to 30 cells; size 2: 31 to 100 cells; size 3: 101 to 1000 cells; size 4: 5000 cells; size 5: 15 000 cells; size 6: 30 000 cells; and size 7: >30 000 cells. (C) Cell cycle analysis using Ki67/4′,6-diamidino-2-phenylindole (DAPI) staining of young CD61High and CD61Low LT-HSCs. (D) Cell cycle analysis using Ki67/DAPI staining of aged CD61High and CD61Low LT-HSCs. (E) Single-cell division assay of young and aged CD61High and CD61Low LT-HSCs. (F) DAPI/γH2AX immunofluorescent staining of aged CD61High LT-HSCs, CD61Low LT-HSCs and LT-HSCs. (G) Number of γH2AX foci per cell in CD61High and CD61Low aged LT-HSCs.
First, we analyzed the proliferation potential of CD61Low and CD61High LT-HSCs, isolated from young or aged mice, by sorting single LT-HSCs in a well and culturing these for 14 days. We analyzed the size of the colony that single LT-HSCs produced. After 14 days, young CD61High and CD61Low LT-HSCs proliferated equally (Figure 3B). However, when isolated from aged mice, CD61Low LT-HSCs proliferated significantly less, with a large fraction of cells not producing a colony at all (Figure 3B). Aged CD61High LT-HSCs proliferated not significantly different compared with cells isolated from young mice, confirming their “young-like” phenotype.
Because the transcriptome data suggested that CD61High and CD61Low LT-HSCs may differ in their cell cycle activity, we performed cell cycle analysis (supplemental Figure 3A). It showed that young CD61High and CD61Low LT-HSCs did not differ significantly in their cell cycle activity (Figure 3C). In contrast, in aged LT-HSCs essentially all CD61High LT-HSCs resided in G0 phase, whereas CD61Low cells were more abundant in G1 and G2-S-M phases (Figure 3D).
Next, we analyzed the division rate of young and aged CD61High and CD61Low LT-HSCs by sorting single cells into a well and counting the fraction of wells in which a cell division had occurred after 48 hours, that it, in which >1 cell was present. For both young and aged LT-HSCs we found CD61High cells to divide slower (Figure 3E). These functional data corroborate the molecular data and show that CD61High LT-HSCs are more quiescent. Furthermore, these results indicate that the relevance of CD61 is significantly enhanced with age.
LT-HSCs with low expression of CD61 accumulate significantly more DNA damage
Hypothesizing that the higher than usual proliferation rate of aged CD61Low LT-HSCs may result in increased accumulation of DNA damage and subsequent cell death, we analyzed levels of DNA damage in aged HSCs. We stained freshly isolated aged CD61High and CD61Low LT-HSCs with an anti-γH2AX antibody. Using confocal microscopy, we imaged cells and counted the number of γH2AX foci. Figure 3G shows a representative comparison between aged CD61High and CD61Low cells. The analysis revealed that CD61Low LT-HSCs exhibited a significantly larger number of foci per cell than CD61High cells (Figure 3F-G). Aged LT-HSCs with low CD61 expression accumulate more DNA damage, likely because of their higher division rate and proliferative potential. As expected, we observed less DNA damage in young LT-HSCs. Interestingly, in young LT-HSCs we did not detect significant differences in DNA damage accumulation in CD61High and CD61Low cells (supplemental Figure 3B-C). Consequently, increased DNA damage may trigger apoptosis, providing a possible explanation for their lower output in in vitro single-cell proliferation assays.
CD61-CD51 dimerization drives CD61-mediated maintenance of aged LT-HSCs quiescence
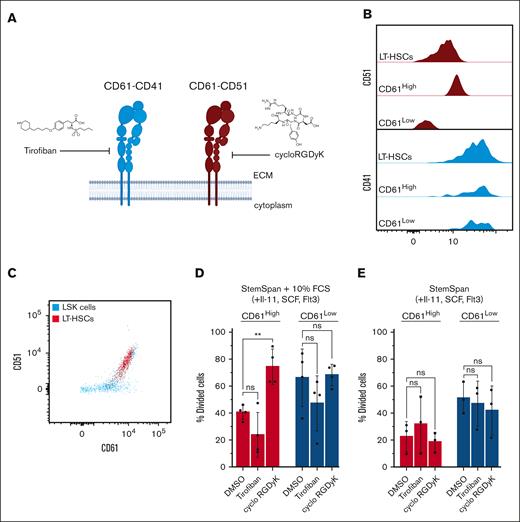
Integrins dimerize into distinct heterodimers and homodimers to facilitate biological processes. CD61 can heterodimerize with CD51 (Itgav) or CD41 (Itga2b)35 (Figure 4A). To further understand the mechanism of CD61-mediated LT-HSCs quiescence we explored which CD61 heterodimer is involved in this process.
Inhibitor studies. (A) Schematic representation of inhibition of CD61 signaling with small molecules. (B) Histogram representing coexpression of CD51 or CD41 with CD61 in aged LT-HSCs. (C) FACS plot showing coexpression of CD51 and CD61 on LSKs and LT-HSCs. (D) Single-cell division assay of aged CD61High and CD61Low LT-HSCs treated with tirofiban or cycloRGDγK in StemSpan with 5% serum supplementation and cytokines. (E) Single-cell division assay of aged CD61High and CD61Low LT-HSCs treated with tirofiban or cycloRGDγK in serum-free StemSpan supplemented with cytokines. IL-11, interleukin-11; LSK, Lin−Sca1+c-Kit.
Inhibitor studies. (A) Schematic representation of inhibition of CD61 signaling with small molecules. (B) Histogram representing coexpression of CD51 or CD41 with CD61 in aged LT-HSCs. (C) FACS plot showing coexpression of CD51 and CD61 on LSKs and LT-HSCs. (D) Single-cell division assay of aged CD61High and CD61Low LT-HSCs treated with tirofiban or cycloRGDγK in StemSpan with 5% serum supplementation and cytokines. (E) Single-cell division assay of aged CD61High and CD61Low LT-HSCs treated with tirofiban or cycloRGDγK in serum-free StemSpan supplemented with cytokines. IL-11, interleukin-11; LSK, Lin−Sca1+c-Kit.
We first determined whether either CD51 or CD41 is coexpressed with CD61 in aged LT-HSCs. As shown in Figure 4B-C, CD51 expression levels correlated with CD61 expression, not CD41. This suggests that specifically CD61-CD51 dimerization may occur in aged LT-HSCs, similar to that in young HSCs (supplemental Figure 4A).
We then cultured aged LT-HSCs in the presence of dimer-specific small-molecule inhibitors, tirofiban for CD61-CD41, and cycloRGDγK for CD61-CD51 (Figure 4B-C). Both inhibitors reportedly selectively inhibit the activity of their target dimer.36,37 We analyzed whether these inhibitors affected proliferation kinetics of aged CD61High and CD61Low LT-HSCs. As expected, tirofiban had a minimal effect, whereas cycloRGDγK supplementation induced increased cycling in LT-HSCs in serum-containing cultures (Figure 4D). Interestingly, this effect was restricted to (quiescent) CD61High stem cells, increasing their division rates comparable with those of CD61Low LT-HSCs. The release of quiescence was not detectable in unfractionated LT-HSCs, which suggests that CD61–CD51 heterodimerization occurs specifically in LT-HSCs with highest CD61 expression (supplemental Figure 4B-C). In serum-free cultures we did not observe effects on cell cycling in the presence of these inhibitors, suggesting that heterodimerization occurs only in the presence of a serum-containing ligand (Figure 4E). Cell cycle analysis confirmed that CD61High LT-HSCs treated with cycloRGDγK had a higher percentage of cells in G2-S-M phases than DMSO-treated control cells (supplemental Figure 4D).
CD61 expression marks a subpopulation of functionally superior aged LT-HSCs
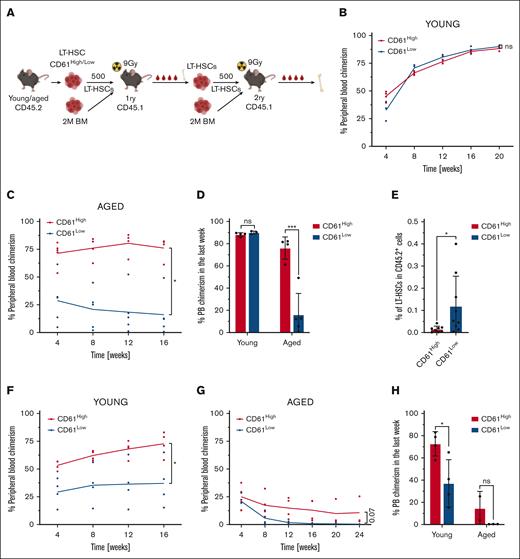
The transcriptomic data as well as in vitro experiments indicated that CD61 expression marks distinct populations of LT-HSCs. We then asked whether these differences would also translate in functional differences in in vivo assays. To this end we used competitive transplantation assays using freshly isolated CD61High and CD61Low LT-HSCs (CD45.2+). We transplanted 500 CD61High and 500 CD61Low LT-HSCs, along with 2 × 10⁶ whole BM cells obtained from W41 mice (C57BL/6J-KitW-41J/J), into lethally irradiated recipient mice (CD45.1+; Figure 5A). Chimerism levels in the PB of recipient mice were analyzed every 4 weeks for at least 16 weeks using FACS (supplemental Figure 5A). After 16 weeks, recipient mice were sacrificed and their BM analyzed. Next, 500 LT-HSCs collected from primary recipients were serially competitively transplanted into secondary recipients, and chimerism levels were analyzed for another 16 weeks. After the second 16-week period bones were harvested and analyzed.
Transplantation studies. (A) Schematic representation of competitive primary and secondary transplantation assays. (B) Competitive transplantation assay of 500 CD61High and CD61Low LT-HSCs from young mice into lethally irradiated recipients (mice per group, n = 4). Data from representative experiment are shown. (C) Competitive transplantation assay of 500 CD61High and CD61Low LT-HSCs from aged mice into lethally irradiated recipients (mice per group, n = 4). Data from representative experiment are shown. (D) PB chimerism levels, long term after transplantation in primary recipients of young and aged CD61High and CD61Low LT-HSCs. (E) Donor-derived LT-HSC frequency in the BM of primary recipients that received transplantation with aged donor CD61High and CD61Low LT-HSCs. (F) Secondary transplantation assay of 500 LT-HSCs derived from primary recipients that received transplantation with young CD61High and CD61Low LT-HSCs (mice per group, n = 4). Data from representative experiment are shown. (G) Secondary transplantation assay of 500 LT-HSCs derived from primary recipients that received transplantation with aged CD61High and CD61Low LT-HSCs (mice per group, n = 4). Data from representative experiment are shown. (H) PB chimerism levels, long term after transplantation in secondary recipients of young and aged CD61High and CD61Low LT-HSCs.
Transplantation studies. (A) Schematic representation of competitive primary and secondary transplantation assays. (B) Competitive transplantation assay of 500 CD61High and CD61Low LT-HSCs from young mice into lethally irradiated recipients (mice per group, n = 4). Data from representative experiment are shown. (C) Competitive transplantation assay of 500 CD61High and CD61Low LT-HSCs from aged mice into lethally irradiated recipients (mice per group, n = 4). Data from representative experiment are shown. (D) PB chimerism levels, long term after transplantation in primary recipients of young and aged CD61High and CD61Low LT-HSCs. (E) Donor-derived LT-HSC frequency in the BM of primary recipients that received transplantation with aged donor CD61High and CD61Low LT-HSCs. (F) Secondary transplantation assay of 500 LT-HSCs derived from primary recipients that received transplantation with young CD61High and CD61Low LT-HSCs (mice per group, n = 4). Data from representative experiment are shown. (G) Secondary transplantation assay of 500 LT-HSCs derived from primary recipients that received transplantation with aged CD61High and CD61Low LT-HSCs (mice per group, n = 4). Data from representative experiment are shown. (H) PB chimerism levels, long term after transplantation in secondary recipients of young and aged CD61High and CD61Low LT-HSCs.
First, we competitively transplanted CD61High and CD61Low LT-HSCs from young mice. In young LT-HSCs, differential expression of CD61 did not affect the reconstituting potential in primary transplantations (Figure 5B,D; supplemental Figure 5B-C). CD61High and CD61Low LT-HSCs isolated from young mice possessed comparable lineage contribution to all PB cell compartments (supplemental Figure 5D-F). However, when we performed these experiments using aged mice as donors, we did observe significant differences in chimerism levels among mice that received transplantation with CD61High or CD61Low LT-HSCs as early as 4 weeks after transplantation (Figure 5C-D; supplemental Figure 5G-H).
Aged CD61Low LT-HSCs produced significantly fewer PB cells than CD61High LT-HSCs. Chimerism levels in mice that received transplantation with aged CD61Low LT-HSCs remained <25%, whereas the contribution derived from aged CD61High cells gradually increased and were comparable with that of young HSCs (Figure 5B-C). The lineage contribution to different PB cell populations was similar between CD61High and CD61Low LT-HSCs (supplemental Figure 5I-K).
After 16 weeks, the BM of primary recipient mice was analyzed, and although no significant differences were found in the BM of recipient mice that received transplantation with young CD61High or CD61Low LT-HSCs, we discovered an average eightfold increase in the frequency of the donor-derived aged CD61Low LT-HSCs (Figure 5E). Because HSCs highly rely on their self-renewal/differentiation ratio and its balance to maintain their activity throughout the lifetime of the organism, we hypothesized that the reason for this increase is a higher proliferation rate of cells with decreased CD61 expression.
We performed secondary transplantations to determine self-renewal potential of LT-HSCs. Whereas young CD61Low LT-HSCs engrafted perfectly fine in primary recipients, upon secondary transplantation, young CD61Low LT-HSCs significantly declined in their repopulation capacity (Figure 5F,H; supplemental Figure 5L-M). Secondary transplantation of aged LT-HSCs revealed that CD61High LT-HSCs retain some self-renewal capacity, whereas aged CD61Low LT-HSCs showed a complete failure in reconstituting the hematopoietic system (Figure 5G-H; supplemental Figure 5N).
Although secondary transplantation of young and aged CD61High and CD61Low LT-HSCs showed differential reconstitution capacity, the contribution to distinct PB cell populations remained evenly distributed, both in primary and secondary transplantation (supplemental Figure 5D-F,I-K,O-T).
Because expression of CD150 has been associated with functional activity of HSCs,38 we assessed whether CD61 expression correlates with expression of CD150. We found no correlation between expression levels of CD61 and CD150 (supplemental Figure 5U). Thus, differential CD61 expression identifies functionally distinct LT-HSCs populations, independent of CD150 expression.
Collectively, our data show that CD61 marks a functionally superior stem cell population, both in young and aged mice. In aged mice, CD61 marks a population of LT-HSCs that performs functionally similar to young LT-HSCs.
Repression of CD61 in aged and young LT-HSCs leads to impairment of reconstitution potential
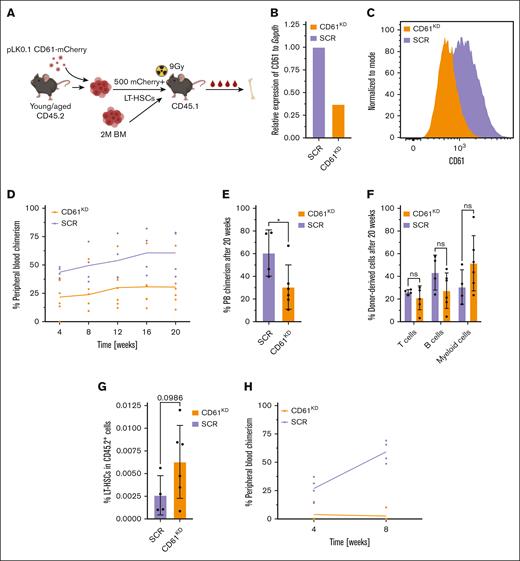
To further assess the role of CD61, we asked whether perturbation of CD61 expression would affect HSC functioning. We repressed CD61 in young and aged LT-HSCs using short-hairpin RNA (shRNA), with a scrambled shRNA as a negative control (Figure 6A). We isolated LT-HSCs and infected cells ex vivo with a lentiviral pLKO.1-shRNA-mCherry construct. After 5 days of culture, we transplanted mCherry+ cells into lethally irradiated recipients alongside 2 × 10⁶ whole BM W41 competitor cells. Downregulation of CD61 was confirmed both on transcriptome and protein level (Figure 6B-C).
Transplantation of CD61 repressed LT-HSCs. (A) Schematic representation of the shRNA-mediated CD61 repression. (B) CD61 mRNA levels after shRNA-mediated downregulation of CD61 in aged LT-HSCs. (C) CD61 protein levels after CD61 downregulation, 5 days after transduction. (D) Competitive transplantation assay of aged LT-HSCs after shRNA-mediated CD61 downregulation (CD61KD) compared with scrambled shRNA (SCR) control cells (mice per group, n = 4). Data from representative experiment are shown. (E) PB chimerism levels 20 weeks after transplantation. (F) Donor-derived T cells, B cells, and myeloid cells, 20 weeks after transplantation. (G) Donor-derived LT-HSC frequency in the BM of recipient mice 20 weeks after transplantation. (H) Competitive transplantation assay of young LT-HSCs after shRNA-mediated CD61 downregulation (CD61KD) compared with SCR control cells (mice per group; n = 4). Data from representative experiment are shown.
Transplantation of CD61 repressed LT-HSCs. (A) Schematic representation of the shRNA-mediated CD61 repression. (B) CD61 mRNA levels after shRNA-mediated downregulation of CD61 in aged LT-HSCs. (C) CD61 protein levels after CD61 downregulation, 5 days after transduction. (D) Competitive transplantation assay of aged LT-HSCs after shRNA-mediated CD61 downregulation (CD61KD) compared with scrambled shRNA (SCR) control cells (mice per group, n = 4). Data from representative experiment are shown. (E) PB chimerism levels 20 weeks after transplantation. (F) Donor-derived T cells, B cells, and myeloid cells, 20 weeks after transplantation. (G) Donor-derived LT-HSC frequency in the BM of recipient mice 20 weeks after transplantation. (H) Competitive transplantation assay of young LT-HSCs after shRNA-mediated CD61 downregulation (CD61KD) compared with SCR control cells (mice per group; n = 4). Data from representative experiment are shown.
Our data revealed that repression of CD61 expression in aged LT-HSCs is detrimental for their reconstitution potential (Figure 6D-E; supplemental Figure 6A). In contrast, to control cells that gradually increased their overall contribution to blood production, engraftment of CD61KD LT-HSCs remained stable throughout the whole duration of the experiment. Although the reconstitution potential of CD61KD was limited, the overall ratio of blood cells produced was comparable with that of the control, with a trend toward higher myeloid cells output (Figure 6F; supplemental Figure 6B). After 16 weeks, the BM of the recipient mice was analyzed. Interestingly, we found a twofold increase in the percentage of donor-derived LT-HSCs in CD61KD group, in comparison with the scrambled shRNA (Figure 6G). The observed results align closely with the findings from recipient mice that received transplantation with aged CD61Low LT-HSCs (Figure 5C,E).
Finally, we assessed whether perturbing CD61 expression levels in young LT-HSCs also affected functioning. Unexpectedly, downregulation of CD61 in young LT-HSCs almost completely diminishes their ability to replenish the hematopoietic system in a competitive transplantation experiment (Figure 6H). Collectively, we show that repression of CD61 expression is detrimental to the engraftment of young and aged LT-HSCs.
Discussion
In this study, we show that differential expression of CD61 identifies transcriptionally and functionally distinct populations of LT-HSCs within aged BM. Notably, we found that LT-HSCs exhibiting high levels of CD61 expression are more quiescent and are functionally superior compared with CD61Low LT-HSCs. Our findings demonstrate that CD61 is not only a marker that can be used to identify this superior LT-HSC population but is also essential for the proper functioning of both young and aged LT-HSCs. Additionally, we provide evidence that aged LT-HSCs expressing high levels of CD61 exhibit a phenotype similar to young-like LT-HSCs, suggesting that HSCs displaying increased CD61 expression demonstrate enhanced resilience to the aging process.
The role of CD61 has not been well studied in the context of HSC aging, although we have recently shown that it is 1 of the most robustly upregulated genes upon aging.23 It has been shown that young CD61High HSCs display enhanced quiescence and higher repopulation capacity,31 and our data confirm these findings. CD61-deficient mice are mostly embryonically lethal, but the few surviving mice exhibited a phenotype similar to our young CD61Low HSCs.29,39 Young CD61-deficient HSCs did not show distinct phenotypic changes in primary transplantation but lost their self-renewal ability and failed in secondary transplantation, reinforcing the essential role of CD61 expression in HSC self-renewal, possibly by preserving dormancy.29 It has been reported that although CD61 is dispensable for hematopoiesis, it is required for leukemogenesis.32
CD61 expression has been associated with myeloid skewing in aged HSCs,40 but our functional experiments did not show any myeloid skewing. However, we did find a myeloid signature in CD61High LT-HSCs, confirming that, at least on transcriptomic level, CD61High cells might have a myeloid bias40 (supplemental Figure 2A).
It remains unknown why CD61 is upregulated in the aged LT-HSC compartment. In aged BM, we observed increased expression of CD61 preferentially in the most primitive compartments, which coincided with an increase in the population of CD61High LT-HSCs.
Elevated expression of CD61 in primitive LT-HSCs could be the result of age-associated epigenetic alterations, which are known to occur in aged stem cells.15,16,41 In parallel investigations, we, therefore, explored whether the epigenetic status of the Itgb3 locus is altered in aged LT-HSCs. However, we have not been able to discern any significant modifications in overall chromatin accessibility; H3K4me3, H3K27me3, or H3K36me3; or DNA methylation patterns between young and aged LT-HSCs (data not shown).
We hypothesize that the age-dependent increase in the population of CD61High LT-HSCs may be the result of a selection process. During aging, dormant CD61High LT-HSCs may preferentially be retained within the aged BM environment, possibly as a result of the many dynamic changes of BM remodeling that occur during aging. Age-associated BM microenvironmental changes involve both cellular as well as noncellular constituents. One such change is the downregulation of a CD61 ligand, osteopontin, in the aged BM.42 As a supplementary investigation, we examined the CD61 levels in LT-HSCs from osteopontin-knockout mice and observed a twofold increase in its expression in comparison with that in wild-type mice of the same age, suggesting a potential interplay between CD61 and its ligand as a compensatory system in the context of aging (data not shown). This finding highlights the complexity of the interactions between CD61 and its various ligands within the extra cellular matrix during aging and might explain the favored CD61High expression in aged HSCs.
Our data also show that CD61High LT-HSCs are quiescent and are functionally superior, and that inhibition of CD61–CD51 heterodimerization induces cell cycling of CD61High HSCs. Upon aging, alterations in the BM niche may cause stress to the HSCs residing in it, and we propose that CD61–CD51-mediated maintenance of HSC dormancy is 1 way for the stem cells to retain their repopulating potential and protect themselves against the detrimental changes of the environment.
Finally, our study reveals that highly purified LT-HSCs can be further fractionated based on differential CD61 expression into populations of cells with distinct repopulating ability. This is particularly evident for aged LT-HSCs, but differential effects are also seen in young cells. Notably, a small population of aged CD61High HSCs demonstrated stem cell potential and self-renewal capacity that was comparable with that of their young counterparts. This finding supports the existence and allows for the prospective isolation of young-like stem cells within an aged stem cell compartment. As it has been well demonstrated that dormant HSCs engraft and repopulate better than cycling HSCs,34 we assume that CD61-mediated quiescence directly contributes to repopulating potential. In addition, it is likely that CD61High LT-HSCs have accumulated less replicative stress (supported also by lower levels of DNA damage), and are functionally younger and more potent. Furthermore, previous research has indicated that CD61 is transcriptionally upregulated upon human HSC aging.43 This finding suggests the potential significance of CD61 in the context of aged HSCs in humans as well. If our findings can be corroborated for human HSCs, this may open avenues to prospectively isolate functionally superior stem cells for clinical transplantations.
Acknowledgments
The authors thank University Medical Center Groningen Flow Cytometry Unit facility staff J. Teunis, T. Bijma, and G. Mesander for their assistance on cell sorting and analysis. The authors are very grateful to L. Bystrykh at European Research Institute for the Biology of Aging for assistance with data analysis and A. Svendsen for sharing the epigenetic data.
This work was supported by the ARCH (a European Union’s Horizon 2020 Research and Innovation Program) under Marie Skłodowska-Curie grant agreement 813091 and by the Netherlands Organisation for Scientific Research grant 12583.
Authorship
Contribution: N.S. and G.d.H. conceptualized the study, carried out the methodology, and reviewed and edited the manuscript; N.S., I.S.F., A.D-A., and E.W. performed the investigation; N.S. performed the formal analysis, curated the data, and wrote the original draft of the manuscript; and G.d.H. supervised the study.
Conflict-of-interest disclosure: The authors declare no competing financial interests.
Correspondence: Gerald de Haan, Sanquin Blood Supply Foundation, Division of Research, Plesmanlaan 125, 1066 CX Amsterdam, The Netherlands; email: g.de.haan@sanquin.nl.
References
Author notes
RNA-sequencing data are deposited in the Gene Expression Omnibus database (accession number GSE240650).
Data are available on request from the corresponding author, Gerald de Haan (g.de.haan@sanquin.nl).
The full-text version of this article contains a data supplement.

