Key Points
Positive selection for GPR56 and negative selection for NKG2D ligands enrich for LSCs in both CD34neg and CD34pos AMLs.
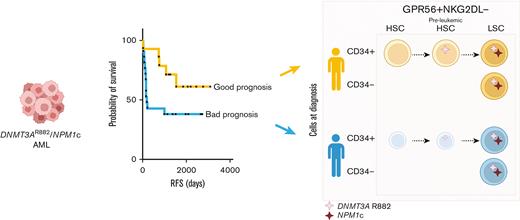
DNMT3AmutNPM1mut AML patients with retained functional normal and/or preleukemic HSCs at time of diagnosis have better clinical outcome.
Abstract
Acute myeloid leukemia (AML) is a heterogeneous disease characterized by high rate of relapse and mortality. Current chemotherapies whilst successful in eradicating blasts, are less effective in eliminating relapse-causing leukemic stem cells (LSCs). Although LSCs are usually identified as CD34+CD38- cells, there is significant heterogeneity in surface marker expression, and CD34- LSCs exist particularly in NPM1mut AMLs. By analyzing diagnostic primary DNMT3AmutNPM1mut AML samples, we suggest a novel flow cytometry sorting strategy particularly useful for CD34neg AML subtypes. To enrich for LSCs independently of CD34 status, positive selection for GPR56 and negative selection for NKG2D ligands are used. We show that the functional reconstitution capacity of CD34- and CD34+ LSCs as well as their transcriptomes are very similar which support phenotypic plasticity. Furthermore, we show that although CD34+ subpopulations can contain next to LSCs also normal and/or preleukemic hematopoietic stem cells (HSCs), this is not the case in CD34-GPR56+NKG2DL- enriched LSCs which thus can be isolated with high purity. Finally, we show that patients with AML, who retain at the time of diagnosis a reserve of normal and/or preleukemic HSCs in their bone marrow able to reconstitute immunocompromised mice, have significantly longer relapse-free and overall survival than patients with AML in whom functional HSCs are no longer detectable.
Introduction
Chemopersistent leukemic stem cells (LSCs) are the cause of relapse in patients with acute myeloid leukemia (AML).1,2 LSCs are historically defined as CD34+CD38- cells. However, CD34+ subpopulation can also include healthy hematopoietic stem cells (HSCs) and progenitor cells.3 In addition, the LSC immunophenotype is more heterogeneous than initially anticipated.4-7 This is particularly true for NPM1mut AML with low or absent CD34 expression5 in which LSCs are also present in the CD34- population.
Here, we suggest a novel sorting strategy particularly useful for CD34neg AMLs. Moreover, we show that retained functional normal/preleukemic HSCs are strongly associated with patient outcome.
Material and methods
Patient samples
DNMT3AmutNPM1mut AML samples were selected from the AML-SG and SAL biorepositories.
Fluorescence-activated cell sorting (FACS) and RNA sequencing (RNAseq)
Detailed protocols are described in the supplemental Methods.
Mice
Mice experiments were performed according to the German federal and state regulations (Tierversuchsantrag number G43/18, Z110/02).
Results and discussion
About 25% of human AMLs are characterized by a low frequency (<10%) of CD34+ cells by flow cytometry and are defined as CD34neg AMLs.8 Previous reports have shown that NPM1mut AMLs are enriched for this phenotype with almost 50% showing low to absent CD34 expression.5,9-11 Consequently, CD34neg AMLs could contain simultaneously LSCs without cell surface expression of CD34 as well as ones with CD34 expression.5,9,10 Therefore, isolation of functional LSCs from CD34neg AMLs is not trivial.
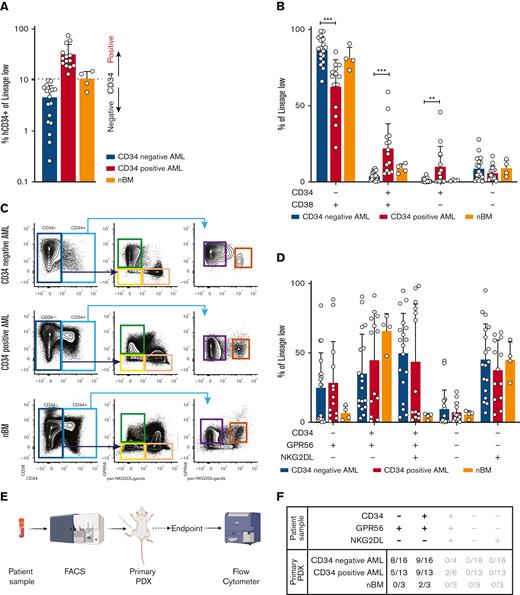
To test and validate alternative LSC isolation strategies, we retrospectively collected a genetically harmonized cohort of primary diagnostic samples from patients with DNMT3AmutNPM1mut AML (n = 46) (supplemental Table 1A-B). Because only 40% to 66% of AML samples engraft in mice,12 we first screened our cohort performing xenotransplantation assays. Of the 46 AML samples, 36 generated human engraftment and were used for further phenotypic and molecular characterization (supplemental Table 2). As expected, we observed a very heterogeneous CD34 expression ranging from 0.260% to 75% (Figure 1A). The cut-off to define CD34 positivity is controversial, ranging from 2%11 to 10%.8 We therefore classified our cohort in CD34neg and CD34pos AMLs using the average fraction of CD34+ cells in healthy bone marrow samples (nBM) as cut-off (Figure 1A, supplemental Methods). Consequently, phenotypic analyses using CD34 and CD38 showed a reduction of CD34+CD38+ and CD34+CD38- subpopulations in CD34neg AMLs, mirrored by an increase in CD34-CD38+ (Figure 1B). Because previous data showed the presence of LSCs with engrafting potential also in CD34- subpopulations, we hypothesized that a significant fraction of LSCs would be neglected if CD34 is the sole marker used to enrich for stem cells.
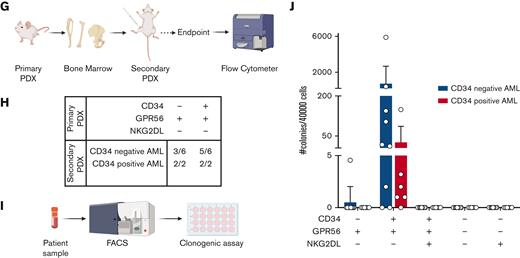
(A) Bar plot representing the fraction of CD34+ cells (relative to lineage low side scatter dim) in primary samples of patient with AML or healthy donors. The dashed line represents the mean frequency of CD34+ cells in healthy donors (range = 5.74%-14.80%). This value (10.5%) is used as threshold to categorize the AML samples in CD34neg AML (n = 18, CD34+ range: 0.26%- 9.83%, average: 4.57%, blue bar) and CD34pos AML (n = 14, CD34+ range: 13.1%-75%, average: 31.89%, red bar). (B) Bar plot showing the fraction of CD34-CD38+ (CD34neg AMLs: median = 87.5%, min = 66%, max = 98.9%; CD34pos AMLs: median = 69%, min = 22%, max = 85.4%; nBM: median = 80.3%, min = 73.3%, max = 90.7%), CD34+CD38+ (CD34neg AMLs: median = 3.48%, min = 0.24%, max = 8.85%; CD34pos AMLs: median = 19.75%, min = 5.48%, max = 59.1%; nBM: median = 8.7%, min = 5.34%, max = 12.3%), CD34+CD38- (CD34neg AMLs: median = 0.34%, min = 0.018%, max = 4.92%; CD34pos AMLs: median = 4.405%, min = 0.057%, max = 45.8%; nBM: median = 1%, min = 0.47%, max = 1.65%), CD34-CD38- (CD34neg AMLs: median = 6.04%, min = 0.39%, max = 27.9%; CD34pos AMLs: median = 3.85%, min = 0.57%, max = 16.9%; nBM: median = 8.83%, min = 3.46%, max = 15%) cells. Frequencies are calculated relative to lineage low side scatter dim. CD34neg AML (blue, n = 18), CD34pos AML (red, n = 14), and healthy donors (orange, n = 4). Multiple unpaired t test were used to calculate statistical differences: P value < .001: ∗∗∗, P value < .01: ∗∗. Error bars indicate standard deviations. (C) Schematic representation of novel sorting strategy using a combination of CD34, GPR56, and pan-NKG2DL. (D) Bar plot showing the fraction of CD34-GPR56+NKG2DL- (CD34neg AMLs: median = 26.95%, min = 0.16%, max = 84.2%; CD34pos AMLs: median = 18.1%, min = 0.92%, max = 88.5%; nBM: median = 6.24%, min = 1.59%, max = 12.6%), CD34+GPR56+NKG2DL- (CD34neg AMLs: median = 27.25%, min = 2.9%, max = 90.6%; CD34pos AMLs: median= 64.6%, min = 1.1%, max = 91.4%; nBM: median = 69.5%, min = 47.6%, max = 76.5%), CD34+GPR56+NKG2DL+ (CD34neg AMLs: median = 57.25%, min = 3.58%, max = 94.8%; CD34pos AMLs: median = 22.2%, min = 1.65%, max = 98.2%; nBM: median = 4.96%, min = 1.43%, max = 6.03%), CD34-GPR56-NKG2DL- (CD34neg AMLs: median = 1.7%, min = 0.089%, max = 44.3%; CD34pos AMLs: median = 5.17%, min = 0.38%, max = 22%; nBM: median = 6.26%, min = 1.8%, max = 8.17%), and CD34-GPR56-NKG2DL+ (CD34neg AMLs: median = 42.5%, min = 6.86%, max = 95%; CD34pos AMLs: median = 38.1%, min = 5.5%, max = 64.8%; nBM: median = 46%, min = 28.2%, max = 59.6%). Fractions are calculated relative to parental gate (either CD34- or CD34+) in CD34neg AML (blue, n = 18), CD34pos AML (red, n = 14) and healthy donors (orange, n = 4). Error bars indicate standard deviations. Multiple unpaired t test was used to calculate statistical differences: no statistically significant differences were observed. (E) Schematic representation of experimental pipeline to generate PDX models using primary human samples FACS-sorted according to the gating strategy shown in C. (F) Summary table showing fractions of engrafted primary PDXs from AML primary samples and healthy donors FACS-sorted according to the scheme in panel C. Human engraftment was defined as hCD45+> 0.1%. (G) Schematic representation of experimental workflow to generate secondary PDXs from primary PDXs. (H) Summary table showing fractions of engrafted secondary PDXs. Human engraftment was defined as hCD45+ >0.1%. (I) Schematic representation of experimental workflow for clonogenic assay. (J) Bar plot showing the number of colonies per 40 000 FACS-sorted cells after 14 days from plating. CD34neg AML (blue, n = 9), CD34pos AML (red, n = 6).
(A) Bar plot representing the fraction of CD34+ cells (relative to lineage low side scatter dim) in primary samples of patient with AML or healthy donors. The dashed line represents the mean frequency of CD34+ cells in healthy donors (range = 5.74%-14.80%). This value (10.5%) is used as threshold to categorize the AML samples in CD34neg AML (n = 18, CD34+ range: 0.26%- 9.83%, average: 4.57%, blue bar) and CD34pos AML (n = 14, CD34+ range: 13.1%-75%, average: 31.89%, red bar). (B) Bar plot showing the fraction of CD34-CD38+ (CD34neg AMLs: median = 87.5%, min = 66%, max = 98.9%; CD34pos AMLs: median = 69%, min = 22%, max = 85.4%; nBM: median = 80.3%, min = 73.3%, max = 90.7%), CD34+CD38+ (CD34neg AMLs: median = 3.48%, min = 0.24%, max = 8.85%; CD34pos AMLs: median = 19.75%, min = 5.48%, max = 59.1%; nBM: median = 8.7%, min = 5.34%, max = 12.3%), CD34+CD38- (CD34neg AMLs: median = 0.34%, min = 0.018%, max = 4.92%; CD34pos AMLs: median = 4.405%, min = 0.057%, max = 45.8%; nBM: median = 1%, min = 0.47%, max = 1.65%), CD34-CD38- (CD34neg AMLs: median = 6.04%, min = 0.39%, max = 27.9%; CD34pos AMLs: median = 3.85%, min = 0.57%, max = 16.9%; nBM: median = 8.83%, min = 3.46%, max = 15%) cells. Frequencies are calculated relative to lineage low side scatter dim. CD34neg AML (blue, n = 18), CD34pos AML (red, n = 14), and healthy donors (orange, n = 4). Multiple unpaired t test were used to calculate statistical differences: P value < .001: ∗∗∗, P value < .01: ∗∗. Error bars indicate standard deviations. (C) Schematic representation of novel sorting strategy using a combination of CD34, GPR56, and pan-NKG2DL. (D) Bar plot showing the fraction of CD34-GPR56+NKG2DL- (CD34neg AMLs: median = 26.95%, min = 0.16%, max = 84.2%; CD34pos AMLs: median = 18.1%, min = 0.92%, max = 88.5%; nBM: median = 6.24%, min = 1.59%, max = 12.6%), CD34+GPR56+NKG2DL- (CD34neg AMLs: median = 27.25%, min = 2.9%, max = 90.6%; CD34pos AMLs: median= 64.6%, min = 1.1%, max = 91.4%; nBM: median = 69.5%, min = 47.6%, max = 76.5%), CD34+GPR56+NKG2DL+ (CD34neg AMLs: median = 57.25%, min = 3.58%, max = 94.8%; CD34pos AMLs: median = 22.2%, min = 1.65%, max = 98.2%; nBM: median = 4.96%, min = 1.43%, max = 6.03%), CD34-GPR56-NKG2DL- (CD34neg AMLs: median = 1.7%, min = 0.089%, max = 44.3%; CD34pos AMLs: median = 5.17%, min = 0.38%, max = 22%; nBM: median = 6.26%, min = 1.8%, max = 8.17%), and CD34-GPR56-NKG2DL+ (CD34neg AMLs: median = 42.5%, min = 6.86%, max = 95%; CD34pos AMLs: median = 38.1%, min = 5.5%, max = 64.8%; nBM: median = 46%, min = 28.2%, max = 59.6%). Fractions are calculated relative to parental gate (either CD34- or CD34+) in CD34neg AML (blue, n = 18), CD34pos AML (red, n = 14) and healthy donors (orange, n = 4). Error bars indicate standard deviations. Multiple unpaired t test was used to calculate statistical differences: no statistically significant differences were observed. (E) Schematic representation of experimental pipeline to generate PDX models using primary human samples FACS-sorted according to the gating strategy shown in C. (F) Summary table showing fractions of engrafted primary PDXs from AML primary samples and healthy donors FACS-sorted according to the scheme in panel C. Human engraftment was defined as hCD45+> 0.1%. (G) Schematic representation of experimental workflow to generate secondary PDXs from primary PDXs. (H) Summary table showing fractions of engrafted secondary PDXs. Human engraftment was defined as hCD45+ >0.1%. (I) Schematic representation of experimental workflow for clonogenic assay. (J) Bar plot showing the number of colonies per 40 000 FACS-sorted cells after 14 days from plating. CD34neg AML (blue, n = 9), CD34pos AML (red, n = 6).
Hence, we combined CD34 with 2 well-known markers to identify functional LSCs: GPR5613-15 and NKG2D ligands (NKG2DL) 16 (Figure 1C; supplemental Methods). We observed no differences between CD34neg and CD34pos AMLs in GPR56 and NKG2DL expression within either CD34- or CD34+ populations (Figure 1D). Nonetheless, we could observe that CD34-GPR56+NKG2DL- phenotype is rather frequent in AMLs and is rarer in nBM.
To functionally test our sorting strategy, we intrafemorally transplanted the FACS-sorted subpopulations into NOD/SCID/IL2Rγnull mice (Figure 1E). Although only the CD34+GPR56+NKG2DL- subpopulation from nBM engrafted in mice, both CD34-GPR56+NKG2DL- and CD34+GPR56+NKG2DL- leukemic subpopulations generated human progeny (Figure 1F; supplemental Table 3). In addition, we showed the long-term repopulating capacity of both leukemic CD34-GPR56+NKG2DL- and CD34+GPR56+NKG2DL- cells by performing secondary xenotransplantation assay (Figures 1 G-H; supplemental Table 4). Surprisingly, on performing clonogenic assays in vitro, we could identify colony formation capacity only for CD34+GPR56+NKG2DL- but not for the corresponding CD34- subpopulation (Figure 1I-J).
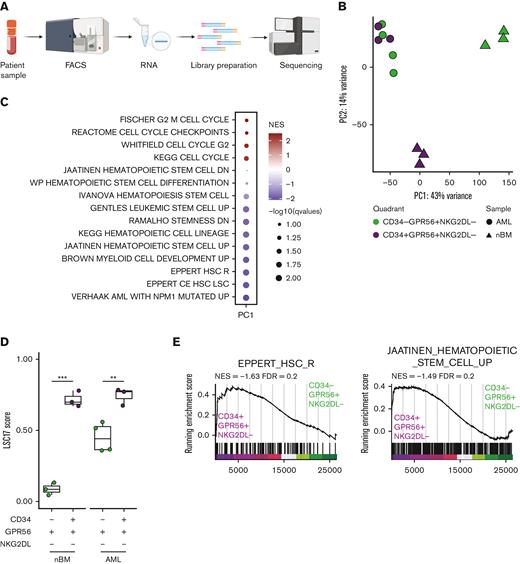
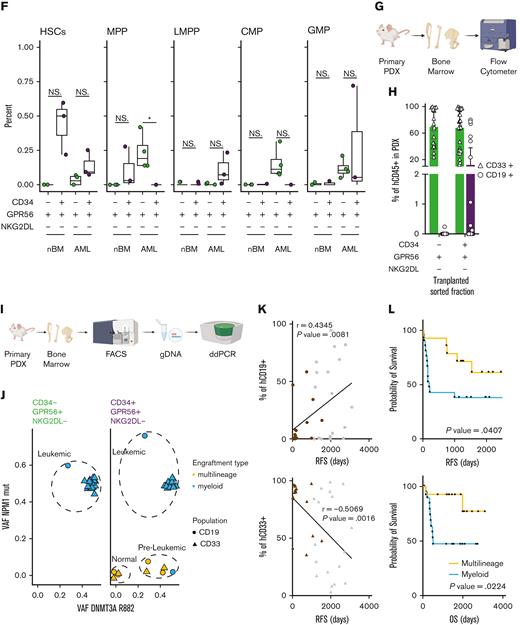
We therefore assessed transcriptomic profiles of CD34-GPR56+NKG2DL- and CD34+GPR56+NKG2DL- subpopulations of primary AMLs and nBM (Figure 2A). We first confirmed the differential messenger RNA (mRNA) expression of CD34, but we observed similar expression levels for GPR56 and NKG2DLs in the 2 populations (supplemental Figure 1A). By performing principal component analysis (PCA), we could identify 3 clusters with CD34-GPR56+NKG2DL- and CD34+GPR56+NKG2DL- from nBM clustering far apart, whereas leukemic CD34-GPR56+NKG2DL- and CD34+GPR56+NKG2DL- highly intermingled (Figure 2B). Gene set enrichment analysis (GSEA) on loadings that contribute to PC1 showed enrichment for cell cycle progression in CD34-GPR56+NKG2DL- cells from nBM, whereas terms related to HSCs, LSCs, and NPM1 mutated AML were associated with CD34+GPR56+NKG2DL- from nBM and both leukemic subpopulations (Figure 2C). Importantly, the LSC1714 (Figure 2D) and the LSC104 scores14 (supplemental Figure 1B) were highly expressed in leukemic CD34+GPR56+NKG2DL- and CD34-GPR56+NKG2DL- populations as well as CD34+GPR56+NKG2DL- from nBM, supporting the in vivo engraftment data.
(A) Schematic representation of the experimental workflow for generation of low input RNAseq from primary human samples FACS-sorted according to the scheme in Figure 1C. (B) Principal component analysis plot using RNAseq data from FACS-sorted populations (CD34+GPR56+NKG2DL-: purple; CD34-GPR56+NKG2DL-: green) derived from either primary AML samples (circles) or healthy donors (triangles). (C) Dot plot of significantly enriched gene sets when GSEA is performed using loadings contributing to PC1. (D) Box plot showing the LSC17 score15 for CD34+GPR56+NKG2DL- (purple) and CD34-GPR56+NKG2DL- (green) in primary samples of patient with AML or healthy donors. (E) GSEA on CD34-GPR56+NKG2DL- (green) and CD34+GPR56+NKG2DL- (purple) using EPPERT_HSC_R17 or JAATINEN_HEMATOPOIETIC_STEM_CELL_UP18 as gene sets. (F) Box plot representing the inferred frequency of HSCs, multipotent progenitor, lymphoid-primed multipotent progenitor, common myeloid progenitor, and granulocyte-monocyte progenitor obtained by deconvoluting bulk RNAseq from FACS-sorted primary AML and healthy donors samples with RNAseq data from Corces et al19 (G) Schematic representation of the experimental workflow to assess the type of engraftment (myeloid vs lymphoid) in primary PDXs models. (H) Bar plot showing the frequency of either CD33+ (triangles) or CD19+ (circles) relative to hCD45+ in primary PDX models obtained by transplanting CD34-GPR56+NKG2DL- or CD34+GPR56+NKG2DL- FACS-sorted populations. (I) Schematic representation of experimental workflow to assess mutational profile by digital droplet polymerase chain reaction (ddPCR) from hCD45+hCD33+ or hCD45+hCD19+ cells from primary PDX models. (J) Scatter plot showing variant allele frequency for DNMT3A R822 (x-axis) and NPM1 (y-axis) for hCD45+hCD33+ (triangles) or hCD45+hCD19+ (circles) cells from primary PDX transplanted with CD34-GPR56+NKG2DL- (left) or CD34+GPR56+NKG2DL- (right) FACS-sorted populations. Samples which gave multilineage engraftment (hCD45+hCD19+ >20%) are marked in yellow, whereas samples generating myeloid engraftment (hCD45+hCD19+ <20%) are marked in light blue. (K) Dot plot showing the correlation between the percentage of either hCD45+hCD19+ cells (upper panel) or hCD45+hCD33+ cells in the PDX (lower panel) and RFS. In both plots gray points represent patients without further clinical information available at the end of the clinical study. Pearson correlation was computed. (L) Kaplan-Meyer plots showing RFS (upper plot) and overall survival (lower plot) of patients with AML based on whether samples after transplantation reconstituted either in a multilineage manner (yellow line) or gave exclusive myeloid engraftment (light blue). Gehan-Breslow-Wilcoxon test was used (P value = .0407 and P value = .0224 for RFS and OS, respectively).
(A) Schematic representation of the experimental workflow for generation of low input RNAseq from primary human samples FACS-sorted according to the scheme in Figure 1C. (B) Principal component analysis plot using RNAseq data from FACS-sorted populations (CD34+GPR56+NKG2DL-: purple; CD34-GPR56+NKG2DL-: green) derived from either primary AML samples (circles) or healthy donors (triangles). (C) Dot plot of significantly enriched gene sets when GSEA is performed using loadings contributing to PC1. (D) Box plot showing the LSC17 score15 for CD34+GPR56+NKG2DL- (purple) and CD34-GPR56+NKG2DL- (green) in primary samples of patient with AML or healthy donors. (E) GSEA on CD34-GPR56+NKG2DL- (green) and CD34+GPR56+NKG2DL- (purple) using EPPERT_HSC_R17 or JAATINEN_HEMATOPOIETIC_STEM_CELL_UP18 as gene sets. (F) Box plot representing the inferred frequency of HSCs, multipotent progenitor, lymphoid-primed multipotent progenitor, common myeloid progenitor, and granulocyte-monocyte progenitor obtained by deconvoluting bulk RNAseq from FACS-sorted primary AML and healthy donors samples with RNAseq data from Corces et al19 (G) Schematic representation of the experimental workflow to assess the type of engraftment (myeloid vs lymphoid) in primary PDXs models. (H) Bar plot showing the frequency of either CD33+ (triangles) or CD19+ (circles) relative to hCD45+ in primary PDX models obtained by transplanting CD34-GPR56+NKG2DL- or CD34+GPR56+NKG2DL- FACS-sorted populations. (I) Schematic representation of experimental workflow to assess mutational profile by digital droplet polymerase chain reaction (ddPCR) from hCD45+hCD33+ or hCD45+hCD19+ cells from primary PDX models. (J) Scatter plot showing variant allele frequency for DNMT3A R822 (x-axis) and NPM1 (y-axis) for hCD45+hCD33+ (triangles) or hCD45+hCD19+ (circles) cells from primary PDX transplanted with CD34-GPR56+NKG2DL- (left) or CD34+GPR56+NKG2DL- (right) FACS-sorted populations. Samples which gave multilineage engraftment (hCD45+hCD19+ >20%) are marked in yellow, whereas samples generating myeloid engraftment (hCD45+hCD19+ <20%) are marked in light blue. (K) Dot plot showing the correlation between the percentage of either hCD45+hCD19+ cells (upper panel) or hCD45+hCD33+ cells in the PDX (lower panel) and RFS. In both plots gray points represent patients without further clinical information available at the end of the clinical study. Pearson correlation was computed. (L) Kaplan-Meyer plots showing RFS (upper plot) and overall survival (lower plot) of patients with AML based on whether samples after transplantation reconstituted either in a multilineage manner (yellow line) or gave exclusive myeloid engraftment (light blue). Gehan-Breslow-Wilcoxon test was used (P value = .0407 and P value = .0224 for RFS and OS, respectively).
We then performed differential gene expression analyses comparing CD34+GPR56+NKG2DL- from nBM with either CD34+GPR56+NKG2DL- or CD34-GPR56+NKG2DL- from AMLs. We identified 1903 and 1508 differentially expressed genes (DEGs), including 851 common ones (supplemental Figure 1C). In line with previous publications, CD96,20 CD97,21 IL1RAP,22,23 HAVCR2,24 and IL2RA25 were upregulated in LSCs compared with HSCs (supplemental Figure 1D). Finally, we compared CD34-GPR56+NKG2DL- and CD34+GPR56+NKG2DL- fractions. Although in nBM we could identify substantial transcriptional differences with 5041 DEGs between CD34-GPR56+NKG2DL- and CD34+GPR56+NKG2DL-, we could detect only 99 DEGs when comparing CD34-GPR56+NKG2DL- and CD34+GPR56+NKG2DL- subpopulations in AMLs (supplemental Figure 1E). GSEA on CD34-GPR56+NKG2DL- and CD34+GPR56+NKG2DL- from nBM showed enrichment for immune response or HSC gene sets (supplemental Figure 1F). GSEA comparing leukemic subpopulations revealed terms associated to pyroptosis, microautophagy and vesicles trafficking in CD34-GPR56+NKG2DL-, whereas enrichment for quiescence, epithelial-to-mesenchymal transition and interferon alpha was detected in CD34+GPR56+NKG2DL- subpopulation (supplemental Figure 1G). Moreover, signatures associated to HSCs were enriched in the CD34+GPR56+NKG2DL- leukemic subpopulation compared with its CD34- counterpart (Figure 2E). Intrigued by these results, we inferred the proportions of cell types in our bulk RNAseq using the Corces et al19 data set as reference. We could observe enrichment for HSCs and lymphoid-primed multipotent progenitors in CD34+GPR56+NKG2DL- leukemic fractions, whereas a higher frequency of multipotent progenitors and common myeloid progenitors was present in CD34-GPR56+NKG2DL- leukemic subpopulations (Figure 2F). Megakaryocytic-erythroid progenitor and common lymphoid progenitor frequencies were neglectable (supplemental Figure 1H).
This let us hypothesize that CD34+GPR56+NKG2DL- subpopulation may retain normal or preleukemic HSCs not yet outcompeted by leukemic cells. In line with this hypothesis, we observed a significantly higher fraction of CD99- cells26 in CD34+GPR56+NKG2DL- compared with CD34- counterpart (supplemental Figure 1J). We therefore functionally tested the presence of retained normal and/or preleukemic HSCs analyzing the reconstituted progeny in patient derived xenografts (PDXs) (Figure 2G). Although CD34-GPR56+NKG2DL- leukemic cells generated only myeloid progeny, CD34+GPR56+NKG2DL- ones could generate multilineage (myeloid + lymphoid) engraftment, supporting the hypothesis of retained normal/preleukemic HSCs in CD34+GPR56+NKG2DL- (Figure 2H).
To specifically discriminate whether engrafting cells were derived from leukemic, preleukemic or normal stem and progenitors, we FACS-sorted hCD45+hCD33+ and hCD45+hCD19+ and performed digital droplet polymerase chain reaction (ddPCR) using mutation-specific probes (Figure 2I).
All the progenies derived from CD34-GPR56+NKG2DL- cells have a variant allele frequency (VAF) around 0.5 for both DNMT3AR882 and NPM1mut confirming that all human engrafted cells are double mutant leukemic cells (Figure 2J). In contrast, the progeny derived from CD34+GPR56+NKG2DL- cells show 3 different genetic makeups: double mutant leukemic cells, preleukemic cells (VAF DNMT3AR882 = 0.5 but VAF NPM1mut <0.1), and normal progeny without mutations in either gene (Figure 2J). This observation was confirmed by the reduced expression of the NPM1mut allele in CD34+GPR56+NKG2DL- cells in primary AMLs (supplemental Figure 1I).
Finally, we observed a statistically significant positive correlation between the fraction of hCD45+hCD19+ in our 36 bulk PDXs (supplemental Table 2) and relapse-free survival (RFS) data of each patient. This is mirrored by a statistically significant anticorrelation between the fraction of hCD45+hCD33+ and RFS (Figure 2K). Moreover, patients with AML with bone marrow cells harboring multilineage engraftment potential show a much better RFS and overall survival (OS) compared with patients showing exclusive myeloid-engraftment potential (Figure 2L).
In summary, by using a genetically harmonized cohort of 46 DNMT3AmutNPM1mut diagnostic samples, we showed that positive selection for immature cells marker, as GPR56, and negative selection for mature cells, by using an Fc chimera recognizing pan-NKG2DLs, is a valid sorting strategy to enrich for LSCs in both CD34pos and CD34neg AMLs. Although our study is focusing exclusively on DNMT3AmutNPM1mut AMLs, evidence from the literature and our own unpublished observations suggest that this marker combination enrich for LSCs in AMLs of any mutational background.13,14,16 We showed that although the CD34+GPR56+NKG2DL- subpopulation can contain a mix of normal, preleukemic and leukemic stem cells (LSCs), the CD34-GPR56+NKG2DL- phenotype is exclusive for malignant LSCs or progenitors. We also observed that although both CD34- and CD34+ LSCs are able to engraft in mice, only CD34+ but not CD34- cells form colonies in vitro, highlighting the limitations of such assays and the need for multiple different methodologies in assessing potency and self-renewal of human progenitor cells.
Previous reports indicated that multilineage engraftment, potentially caused by nonleukemic multipotent stem cells, was an exclusive characteristic of some diagnostic samples, whereas matched relapse samples only generated leukemic engraftment.27 Here, we expand these initial observations by providing evidence that the presence of functional, normal and/or preleukemic HSCs in the bone marrow at diagnosis of patients with DNMT3AmutNPM1mut AML is associated with better RFS and OS. Patients with AML without detectable normal and/or preleukemic HSCs activity at diagnosis show rather poor RFS and OS suggesting that more aggressive AMLs mediate the fast elimination of non-LSCs. Our results may be used as the basis for the development of biomarkers that predict response and relapse probability in patients treated with standard chemotherapy.
Acknowledgments
The authors thank all technicians of the A.T. laboratory for technical assistance; Steffen Schmitt, Marcus Eich, Klaus Hexel, Tobias Rubner, and Florian Blum from the German Cancer Research Center (DKFZ) Flow Cytometry Core Facility for their assistance; and K. Reifenberg, P. Prückl, M. Durst, M. Schorpp-Kistner, A. Rathgeb, and all members of the DKFZ Laboratory Animal Core Facility for excellent animal welfare and husbandry. The authors also thank the DKFZ Genomics and Proteomics Core Facility and the DKFZ ODCF System Administration for their assistance. The graphical abstract and the schematic experimental workflows were created using BioRender.com. This work was also supported by DFG consortia FOR2033, FOR2674, SFB873, German Cancer Consortium (DKTK) joint funding project “RiskY-AML,” the SyTASC Consortium funded by the Deutsche Krebshilfe, the ERC Advanced Grant SHATTER-AML (AdG-101055270) and the Dietmar Hopp Foundation (all to A.T.) and DFG consortia SFB1074 (to L.B.). C.A. is supported by an add-on Fellowship of the Joachim Herz Foundation.
Authorship
Contribution: E.D., N.C., C.A., C.T., D.H., A.T. wrote the manuscript; E.D., N.C., A.T. designed the experiments; E.D., N.C., C.K., M.S., A.P., P.Z., D.K., R.W. performed the experiments; K.R. and H.S. provided biotinylated NKG2D ligands and staining protocol; E.D., N.C. and C.A. analyzed the data; C.T., D.H. and A.T. supervised the analysis of the data. H.B. provided healthy bone marrow samples; S.S., C.R., C.T., A.D., L.B. provided primary AML samples, DNA mutation sequencing data and patient clinical information.
Conflict-of-interest disclosure: C.T. is co-owner and CEO of AgenDix GmbH, has received lecture fees from Novartis, JAZZ, Janssen, TEVA, Life Technologies, Archer; has served on advisory boards for Novartis, JAZZ, and received research support from Novartis. None of these activities is directly linked to the data presented here. L.B. has advisory role for AbbVie, Amgen, Astellas, Bristol-Myers Squibb, Celgene, Daiichi Sankyo, Gilead, Hexal, Janssen, Jazz Pharmaceuticals, Menarini, Novartis, Pfizer, Sanofi, Seattle Genetics; research funding from Bayer, Jazz Pharmaceuticals.
Correspondence: Daniel Hübschmann, Computational Oncology, Molecular Diagnostics Program, National Center for Tumor Diseases, German Cancer Research Center, Im Neuenheimer Field 280, 69120 Heidelberg, Germany; e-mail: d.huebschmann@dkfz-heidelberg.de; and Andreas Trumpp, DKFZ Research Program A, Cell and Tumor Biology, Im Neuenheimer Field 280, 69120 Heidelberg, Germany; e-mail: a.trumpp@dkfz-heidelberg.de.
References
Author notes
Data are deposited in the European Genome-Phenome Archive (EGA) with the following accession numbers: EGAS00001006527 (study); EGAD00001009293 (data set). Contact the corresponding authors for other forms of data sharing: a.trumpp@dkfz-heidelberg.de and d.huebschmann@dkfz-heidelberg.de.
The full-text version of this article contains a data supplement.
E.D., N.C., and C.A. have contributed equally to this study.
A.T., D.H., C.T. jointly supervised the study.

