TO THE EDITOR:
Diffuse large B-cell lymphoma (DLBCL) is a heterogeneous disease identified by morphology, immunophenotype, and a typically aggressive clinical course.1 DLBCL has long been stratified based on gene expression profiling (GEP) into activated B-cell–like (ABC) and germinal center B-cell–like (GCB) cell-of-origin (COO) subtypes.2 Recently, several studies stratified DLBCL into genetic subgroups based on the co-occurrence of mutational features with strong associations with COO.3-6 Previously, our 2 groups independently reported gene expression signatures associated with dark-zone–like biology in DLBCL. The molecular high-grade signature (MHG) identifies DLBCLs expressing a Burkitt lymphoma (BL)-like GEP signature,7 whereas the double-hit signature (since renamed dark-zone signature [DZsig]8) identifies DLBCLs with a GEP signature like high-grade B-cell lymphoma with MYC and BCL2 rearrangement (HGBCL-DH-BCL2) (whether the tumors harbor MYC and BCL2 rearrangements or not).9,10 Remarkably, despite the small overlap in the genes that comprise each signature, both classifiers identified a subset of DLBCL tumors enriched for certain genetic aberrations, including concomitant MYC and BCL2 rearrangements.7,9
Here, we present analyses that directly compare MHG and DZsig classifications applied to the same data sets, demonstrating that most tumors positive for 1 signature are positive for both. We evaluated the agreement between the 2 scores in several cohorts and investigated the association of the group of tumors positive for both signatures, “DZSig&MHG,” with outcome. Finally, we compared the mutation frequencies in tumors positive for 1 or both signatures and their association with 2 DLBCL genetic subgroup classifications. Our results demonstrate a clear biological similarity between the DZsig and MHG classifications and strong associations with the EZB genetic subgroup. All data used in this study were generated as part of studies reviewed and approved by the institutional review boards at each site, in accordance with the Declaration of Helsinki.
GEP matrices were obtained for 3 cohorts: REMoDL-B (N = 928; Illumina DASL),7,11 Hematologic Malignancy Diagnostic Service (HMDS) (N = 1024; Illumina DASL),12 and DLC (N = 304; polyA-selected RNAseq) (supplemental Tables 1-2).9 MHG classifications were generated for each data set using the BDC classifier.13 DZsig classification was performed using the PRPS-ST classifier.14 We limited the positive calls for either signature to GCB COO to improve biological coherence; however, analyses including a small number of ABC/unclassified tumors positive for these signatures did not produce significantly different conclusions. Mutation data were available for HMDS (N = 515)5 and DLC (N = 302)9,15 cohorts. Genes covered by targeted capture panels and evaluable in both cohorts are provided in supplemental Table 3. The hotspot EZH2Y646 and CREBBP lysine acetyltransferase (KAT) domain missense mutations were treated separately from other mutations in these genes. Fisher's exact test was used to identify associations between binarized mutation status per gene and signature classifications. Multiple tests were corrected with Benjamini-Hochberg using a false discovery rate threshold of 0.1 for significance.
The association of the signature classifications with progression-free survival (PFS) and overall survival (OS) up to 5 years from diagnosis was evaluated using Kaplan-Meier curves and Cox proportional hazard models adjusted for age, sex, and international prognostic index (IPI) score. Multiple imputation was used to account for missing data contributing to the IPI score for the HMDS cohort (refer to supplemental Methods). Survival analysis was performed only for patients with de novo DLBCL who were treated with R-CHOP. Patients with transformed disease or those who received any other treatment, including RB-CHOP, were excluded. All statistical analyses were performed using R 4.1 or Stata 14.2.
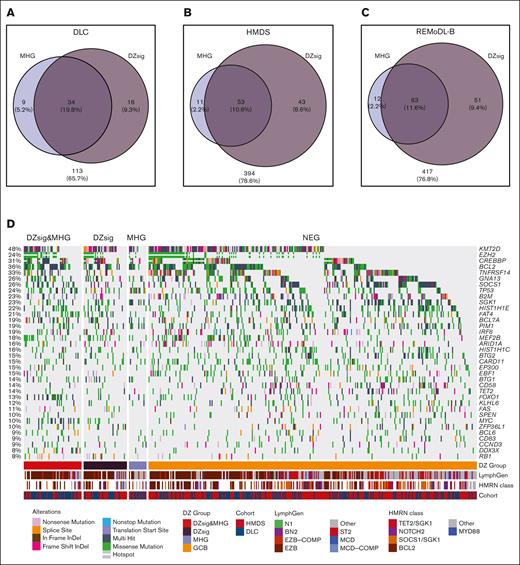
To directly compare the biology of both signatures within the GCB COO, the DZsig and MHG classifications were applied to the 3 GEP cohorts (supplemental Table 2). A comparison between the DZsig score and p(MHG) showed a strong linear correlation between the scores (supplemental Figure 1). In total, 82.4% (range, 79.1%-84.0%; across cohorts) of MHG DLBCLs were classified as DZsig, whereas 57.6% (range, 55.2%-68%) of DZsig DLBCLs were classified as MHG (Figure 1A-C; supplemental Table 4). Of the 28 genes used in the MHG classification and 104 genes used in the DZsig classification (or 30 genes for the DLBCL90 NanoString assay), only 5 were used in both classifiers (supplemental Table 5). Naïve clustering of the superset of MHG and DLBCL90 DZsig genes consistently identified a cluster enriched for DZsig- and MHG-positive tumors across all 3 cohorts (supplemental Figure 2). Together, these data show that the classifiers identified a largely overlapping set of tumors with dark-zone biology and consistent GEP features, although the DZSig-only group was generally larger than the MHG-only group.
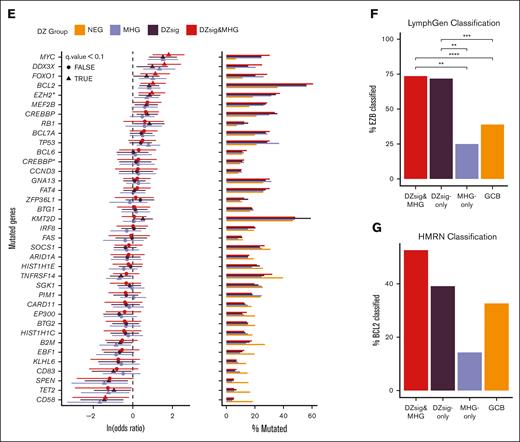
Mutational spectra of dark-zone DLBCL. (A-C) Venn diagrams showing the overlap in cases classified as MHG and DZsig across DLC (A), HMDS (B), and REMoDL-B (C) cohorts. Percentages are relative to the total number of cases classified as GCB-DLBCL in each cohort, and the size of each circle is proportional to the number of cases. Numbers outside the circles indicate GCB-DLBCL not classified as MHG or DZsig. (D) The mutational profile of GCB COO tumors across genes mutated in at least 10% of GCB tumors, stratified according to GEP classifications and annotated according to the published LymphGen or HMRN genetic classification and cohort. (E) Enrichment for coding or hotspot mutations among the genes shown in panel D. Positive values in the forest plot (left panel) indicate enrichment relative to GCB-DLBCL. The percentage of tumors within each group harboring 1 or more coding mutation per gene is shown in the right panel. MHG includes all MHG-classified tumors (MHG and DZsig&MHG) and DZsig includes all DZsig tumors (DZsig and DZsig&MHG). CREBBP∗: missense mutations in the CREBBP KAT domain. EZH2∗: Mutations at Y646 in EZH2. (F) The proportion of tumors belonging to each GEP classification group classified as EZB by the LymphGen classifier across the DLC and HMDS cohorts, separating MHG-only, DZsig-only, and DZsig&MHG tumors. ∗∗P < .01, ∗∗∗P < .001, ∗∗∗∗P < .0001. (G) The percentage of tumors belonging to each GEP classification group is classified as BCL2 by the HMRN classifier, separating MHG, DZsig, and DZsig&MHG tumors. No comparisons reached statistical significance.
Mutational spectra of dark-zone DLBCL. (A-C) Venn diagrams showing the overlap in cases classified as MHG and DZsig across DLC (A), HMDS (B), and REMoDL-B (C) cohorts. Percentages are relative to the total number of cases classified as GCB-DLBCL in each cohort, and the size of each circle is proportional to the number of cases. Numbers outside the circles indicate GCB-DLBCL not classified as MHG or DZsig. (D) The mutational profile of GCB COO tumors across genes mutated in at least 10% of GCB tumors, stratified according to GEP classifications and annotated according to the published LymphGen or HMRN genetic classification and cohort. (E) Enrichment for coding or hotspot mutations among the genes shown in panel D. Positive values in the forest plot (left panel) indicate enrichment relative to GCB-DLBCL. The percentage of tumors within each group harboring 1 or more coding mutation per gene is shown in the right panel. MHG includes all MHG-classified tumors (MHG and DZsig&MHG) and DZsig includes all DZsig tumors (DZsig and DZsig&MHG). CREBBP∗: missense mutations in the CREBBP KAT domain. EZH2∗: Mutations at Y646 in EZH2. (F) The proportion of tumors belonging to each GEP classification group classified as EZB by the LymphGen classifier across the DLC and HMDS cohorts, separating MHG-only, DZsig-only, and DZsig&MHG tumors. ∗∗P < .01, ∗∗∗P < .001, ∗∗∗∗P < .0001. (G) The percentage of tumors belonging to each GEP classification group is classified as BCL2 by the HMRN classifier, separating MHG, DZsig, and DZsig&MHG tumors. No comparisons reached statistical significance.
Next, we explored the relationship between each classification and mutation prevalence across DLC and HMDS cohorts. Both cohorts were subjected to targeted sequencing and 76 genes were captured in both cohorts (supplemental Table 3). Owing to the small number of DZsig and MHG tumors in either cohort alone, mutation data from both cohorts were combined to increase the power to detect differentially mutated genes. To confirm the validity of this approach, we subset the pooled data to tumors classified as either ABC or GCB and verified that all genes mutated with at least 10% frequency were not significantly differentially mutated between cohorts (supplemental Figure 3). We then proceeded to compare the mutation frequencies across signature classifications, considering only GCB tumors, using the set of genes mutated in at least 10% of GCB tumors, in addition to targeted genes known to be associated with DZsig, MHG, or BL (Figure 1D). A comparison of the mutation frequencies in tumors within each classification to GCB-DLBCL revealed similar levels of enrichment for many mutation features (Figure 1E). Several genetic features were consistently significantly enriched across all DZsig, MHG, and DZsig&MHG subgroups, including MYC, DDX3X, FOXO1, and EZH2Y646. In contrast, MHG tumors were significantly enriched for TP53 mutations, whereas DZsig tumors were enriched for mutations in KMT2D, MEF2B, and RB1.
When comparing MHG-only or DZsig-only to DZsig&MHG tumors, few comparisons reached statistical significance owing to the small group sizes and sparse features (supplemental Figure 4; supplemental Table 6). To overcome this limitation, we used the published LymphGen classifications (both DLC and HMDS data)6,16 and Hematological Malignancy Research Network (HMRN) classifications (HMDS only),5 which consider the overall mutation profile of the tumor. Both DZsig&MHG and DZsig-only tumors were significantly enriched in the EZB subgroup relative to GCB and MHG-only tumors (Figure 1F). No significant associations with other LymphGen classifications were observed. The HMRN BCL2 classification was not significantly enriched in any signature group, which may be due to the limited sample size of the HMDS cohort alone (Figure 1G). Together, these data suggest that the DZsig&MHG and DZsig-only groups shared significant biology with the EZB genetic subgroup, and the smaller MHG-only group may bring in related cases with TP53 mutation-driven biology.
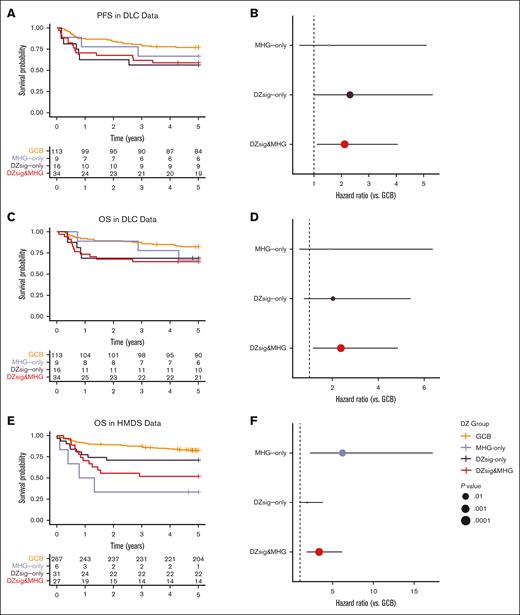
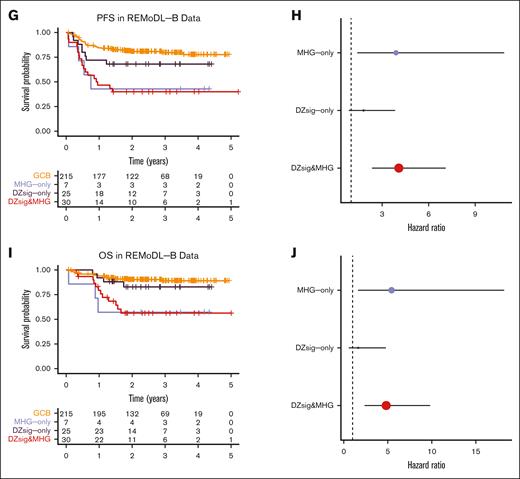
Both MHG and DZsig are established prognostic biomarkers of poor outcomes, especially in comparison with the relatively favorable GCB-DLBCL group. We compared the outcomes of DZsig&MHG, MHG-only, and DZsig-only tumors with GCB-DLBCL across all 3 cohorts. In the DLC data, DZsig&MHG and DZsig-only, but not MHG-only, were associated with inferior PFS (Figure 2A-B; supplemental Figure 5A-B), whereas only DZsig&MHG tumors were associated with inferior OS (Figure 2C-D; supplemental Figure 5C-D). However, in the HMDS and REMoDL-B data, only the DZsig&MHG and MHG-only subgroups were associated with inferior outcomes (Figure 2E-J; supplemental Figure 5E-J). These associations were consistent after adjusting for age, sex, and IPI (supplemental Table 7). Although it is intriguing that the association between outcomes and the nonoverlap groups is stronger in the cohorts in which they were originally developed, it is important to note that both signatures were developed to distinguish biological entities and were locked before the unblinding of clinical outcomes to prevent overfitting of the model to outcomes.
Outcomes in dark-zone DLBCL. Left panels show Kaplan-Meier curves indicating the survival probability across the GEP classification subgroups, including tables of numbers at risk. Right panels show forest plots indicating the unadjusted hazard ratio and 95% confidence interval of each dark-zone group relative to GCB-DLBCL. (A-B) Progression-free survival and (C-D) overall survival in the DLC cohort. (E-F) Overall survival in the HMDS cohort. (G-H) Progression-free survival and (I-J) overall survival in the REMoDL-B cohort. All survival analyses were performed in patients with de novo DLBCL treated with R-CHOP.
Outcomes in dark-zone DLBCL. Left panels show Kaplan-Meier curves indicating the survival probability across the GEP classification subgroups, including tables of numbers at risk. Right panels show forest plots indicating the unadjusted hazard ratio and 95% confidence interval of each dark-zone group relative to GCB-DLBCL. (A-B) Progression-free survival and (C-D) overall survival in the DLC cohort. (E-F) Overall survival in the HMDS cohort. (G-H) Progression-free survival and (I-J) overall survival in the REMoDL-B cohort. All survival analyses were performed in patients with de novo DLBCL treated with R-CHOP.
Overall, this study demonstrates broad agreement between the DZsig and MHG classifications, both in terms of unifying tumor biology and prognostic significance, underscoring the importance of dark-zone biology in DLBCL. This study inferred classification across technology platforms--further studies applying both signatures on the same platform(s) may be informative. The inferior outcomes of patients with dark-zone DLBCL, even with chimeric antigen receptor T-cell therapy,17 and the prospect of dose intensification and/or targeted therapy,18 should motivate the wide adoption of clinical assays to identify these tumors. The power of genome-wide approaches, such as RNAseq, should form a critical part of correlative studies in clinical trials, allowing exploration of the predictive power of both signatures alongside other biology.
Acknowledgments: The study was funded by Blood Cancer UK grants 15002 and 19009 and the Terry Fox Research Institute grants 1061 and 1043. The Randomized Evaluation of Molecular-Guided Therapy for DLBCL With Bortezomib trial was endorsed by Cancer Research UK, reference number CRUKE/10/024 and Janssen-Cilag provided funding. D.R.W. acknowledges UK Medical Research Council grant MR/L01629X/1 for infrastructure support. D.W.S. is supported by a Michael Smith Foundation for Health Research Health Professional Investigator award (18646).
Contribution: J.R.D., L.K.H., A.J., D.R.W., and D.W.S. contributed to the experimental design; J.R.D., L.K.H., A.J., S.B., C. Sha, M.-Q.D., R.T., and M.A.C. analyzed the data; L.K.H. and J.R.D. contributed to figure preparation; C.B., P.W.M.J., A.J.D., F.C., and D.W.S. contributed to clinical data collection and management; L.K.H., J.R.D., D.R.W., and D.W.S. wrote the manuscript; and all authors contributed to data interpretation and manuscript review and approved the manuscript for submission.
Conflict-of-interest disclosure: D.W.S., A.J., and R.D.M. are named inventors on patents for the use of gene expression to subtype aggressive B-cell lymphomas, one of which is licensed to NanoString Technologies. C. Steidl reports consultancy for AbbVie, Bayer, and Seattle Genetics, and research funds from Trillium Therapeutics, Bristol Myers Squibb, and Epizyme. A.J.D. reports consultancy or honoraria for Celgene, Roche, Kite, Janssen, Acerta Pharma/AstraZeneca, AbbVie, Incyte, and Genmab; and research support from Celgene, Roche, Kite, Janssen, Acerta Pharma/AstraZeneca, and AbbVie. D.W.S. reports consultancy for AbbVie, AstraZeneca, and Incyte, and research support from Roche. The remaining authors declare no competing financial interests.
Correspondence: David R. Westhead, School of Molecular and Cellular Biology, Faculty of Biological Sciences, University of Leeds, Leeds LS2 9JT, United Kingdom; e-mail: D.R.Westhead@leeds.ac.uk; and David W. Scott, BC Cancer Centre for Lymphoid Cancer, 675 West 10th Ave, Vancouver V5Z 1L3, BC, Canada; e-mail: dscott8@bccancer.bc.ca.
References
Author notes
∗J.R.D. and L.K.H. contributed equally to this study.
No new sequencing or gene expression data were generated for this study. The data used here were obtained from the Gene Expression Ombibus database (GSE117556, GSE181063) or the European Genome-Phenome Archive (EGAS00001005953, EGAS00001002657). All other forms of data will be shared upon reasonable request from the corresponding authors, David R. Westhead (D.R.Westhead@leeds.ac.uk) and David W. Scott (dscott8@bccancer.bc.ca).
The full-text version of this article contains a data supplement.


