Key Points
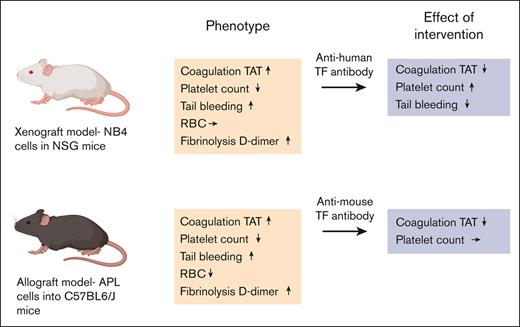
Mouse xenograft and allograft models of APL have activated coagulation and fibrinolytic systems, thrombocytopenia, and increased bleeding.
Inhibition of TF decreased the activation of coagulation in both APL models and normalized tail bleeding in the xenograft model.
Abstract
Acute promyelocytic leukemia (APL) is associated with a high risk of bleeding and thrombosis. APL patients have an activated coagulation system, hyperfibrinolysis, and thrombocytopenia. APL cells express tissue factor (TF), a receptor and cofactor for factor VII/VIIa. This study had 2 goals. Firstly, we measured biomarkers of coagulation and fibrinolysis activation as well as platelet counts and bleeding in both mouse xenograft and allograft models of APL. Secondly, we determined the effect of inhibiting TF on the activation of coagulation in these models. We observed increased levels of plasma thrombin-antithrombin complexes (TAT), D-dimer, and plasmin-antiplasmin complexes, reduced platelet counts, and increased tail bleeding in both mouse models of APL. Fibrinogen levels decreased in the xenograft model but not in the allograft model. In contrast, the red blood cell count decreased in the allograft model but not in the xenograft model. Inhibition of APL-derived human TF with an anti-human TF monoclonal antibody reduced the level of TAT, increased platelet count, and normalized tail bleeding in a xenograft model. Inhibition of all sources of TF (APL cells and host cells) in the allograft model with a rat anti-mouse TF monoclonal antibody decreased the levels of TAT but did not affect the platelet count. Our study demonstrates that TF plays a central role in the activation of coagulation in both the xenograft and allograft mouse models of APL. These APL mouse models can be used to investigate the mechanisms of coagulopathy and thrombocytopenia in APL.
Introduction
Acute promyelocytic leukemia (APL) is a subtype of acute myeloid leukemia (AML). It is caused by translocation between chromosomes 15 and 17, which leads to the fusion of the promyelocytic leukemia (PML) gene with the retinoic acid receptor-α (RARα) gene. Expression of the oncogenic fusion protein PML-RARα inhibits myeloid differentiation at the promyelocytic stage of myelopoiesis and causes leukemia via multiple mechanisms.1,2
Patients with APL have a high risk of both bleeding and thrombosis.3 A major complication in APL is disseminated intravascular coagulation (DIC). Indeed, the rate of DIC in APL (60%-85%)4-6 is much higher than that in other types of AML (9%-22%),7-12 which suggests that there are leukemia type–specific mechanisms of DIC. The prognosis of APL has markedly improved with the development of differentiation therapies, such as all-trans retinoic acid and arsenic trioxide.3 However, APL is still associated with early death that occurs within 30 days of diagnosis, with rates from 7% to 11% in clinical trials.13-17 In registry studies, the early death rates are slightly higher (17%-26%).18-22 This difference is likely because clinical trials exclude patients with severe disease.23 Importantly, most early deaths in patients with APL are associated with severe bleeding, particularly intracranial hemorrhage.19,20,22
The coagulopathy in APL is complex and involves the activation of coagulation, consumption of coagulation factors and hyperfibrinolysis.3,24 Several studies have shown that compared with healthy controls, patients with APL have higher levels of biomarkers of coagulation activation, such as thrombin-antithrombin complexes (TAT) and prothrombin activation fragment F1 + 2.24-26 Low fibrinogen levels because of consumption are associated with an increased risk of bleeding in patients with APL.27-31 APL is also associated with hyperfibrinolysis.24,32-34 Several studies have found that patients with APL have high levels of plasmin-antiplasmin complexes (PAP), a biomarker of fibrinolysis activation, and D-dimer, a biomarker of fibrin degradation.24,33-35 There are several possible explanations for hyperfibrinolysis. Firstly, APL cells were found to express annexin A2 and S100A10 receptors.36,37 Annexin A2 and S100A10 form a heterotetrametric complex receptor that binds tissue plasminogen activator (tPA) and plasminogen and enhances plasmin generation.38 Secondly, the expression of urokinase (uPA) and urokinase receptor (uPAR) by APL cells was proposed to enhance plasmin generation.39 Thirdly, an acquired deficiency of α2-antiplasmin, which is an inhibitor of plasmin, may also contribute to bleeding in patients with APL.40 Severe thrombocytopenia is often observed in patients with APL.35,41-44 One study proposed that a low platelet count is potentially the most important factor in bleeding in patients with APL.44 Another study found that high white blood cell (WBC) count was associated with early hemorrhagic death in patients with APL.45
Tissue factor (TF) is a transmembrane glycoprotein and receptor for factor VII/VIIa (FVII/FVIIa).46 The TF/FVIIa complex is the major initiator of the blood coagulation system.46 Interestingly, a study found that peripheral blood mononuclear cells (PBMCs), which includes leukemia cells, from patients with APL had higher levels of TF activity than PBMCs from patients with AML.35 In addition, PBMC TF activity in patients with AML is significantly associated with decompensated DIC (fibrinogen ≤ 1 g/L).35 TF activity is also increased in bone marrow cells from patients with APL compared with that in bone marrow cells from controls.34 The human APL cell line called NB4 expresses the PML-RARα fusion protein and high levels of TF.47,48
Many cells, including cancer cells, release extracellular vesicles (EVs).49 One study showed that NB4 cells released more TF+ EVs than the AML cell line HL-60, reflecting the different levels of TF expression in the 2 cell lines.50 Several small studies have observed increased levels of EVTF activity in patients with APL compared with that in controls.34,51,52 Interestingly, EVTF activity was detected in a higher proportion of patients with AML with DIC (67%) than in patients with AML without DIC.35 Finally, a study found that a patient with APL and DIC (low platelet count, low fibrinogen levels, high D-dimer, and high blast count) had higher levels of EVTF activity than 2 patients with APL without DIC.51 Taken together, these studies suggest that TF may activate the coagulation cascade in patients with APL.
Several mouse models of APL have been developed that either introduce human APL cells, such as NB4 cells, into immunodeficient mice (xenograft) or express the PML-RARα fusion protein from a transgene in immunocompetent mice (allograft).53,54 These models have been used to investigate the mechanisms underlying the coagulopathy, thrombocytopenia, and bleeding in APL.39,55-57 However, there are no studies on the role of TF in the activation of coagulation in mouse models of APL.
In this study, we measured biomarkers of coagulation activation, fibrinolysis, platelet count, and bleeding in both mouse xenograft and allograft models of APL. Both models exhibited activation of coagulation and fibrinolysis, decreased platelet count, and increased bleeding. In addition, we determined the effect of inhibiting APL-derived human TF in a xenograft model or mouse TF in an allograft model. Inhibition of TF in both models decreased activation of coagulation, indicating a role of TF in the coagulopathy in these APL models. We also found that inhibition of APL-derived TF in the xenograft model normalized tail bleeding.
Materials and methods
APL and AML cells
Human APL NB4 cells were obtained from the DSMZ-German Collection of Microorganisms and Cell Cultures GmbH (Braunschweig, Germany). Luciferase-expressing NB4 cells were generated as described previously,58 using a Cignal Lenti Positive Control (luc) vector containing the luciferase reporter gene (Qiagen, Hilden, Germany). NB4 cells were cultured in RPMI 1640 medium containing 10% fetal bovine serum (FBS; Omega Scientific, catalog number FB-02) and 1% antibioticantimycotic (Gibco, catalog number 15240-062). Human AML HL-60 cells were obtained from American Type Culture Collection (Manassas, VA). HL-60 cells were cultured in Iscove modified Dulbecco medium containing 10% FBS and 1% antibiotic-antimycotic.
Mouse APL cells were obtained from the spleens of APL mice. A transgenic mouse line expressing PML-RARα from the cathepsin G promoter and deficient in Rara (mCG-PR+/−) spontaneously develops APL within 12 to 18 months.59 Mouse APL cells were isolated from the spleens of mCG-PR+/− mice. Briefly, spleens were minced into small pieces (∼0.2 cm2) with a scalpel and passed through a strainer (70 μm). Then, 10 mL of phosphate-buffered saline (PBS) was added, and the sample was centrifuged at 600g for 5 minutes at 4°C. After removing the supernatant, the cell pellet was reconstituted in 5 mL of cold 1× Ammonium-Chloride-Potassium lysis buffer (Gibco; catalog number A1049201) to lyse red blood cells (RBC) and incubated for 5 minutes on ice. After adding 10 mL cold PBS, the cells were centrifuged at 600g for 5 minutes at 4°C. After removing the supernatant, the cell pellet was reconstituted with 10 mL PBS and passed through a strainer (70 μm). The cells were then centrifuged at 600g for 5 minutes at 4°C. After removing the supernatant, the cell pellet was reconstituted in a 95% FBS and 5% dimethyl sulfoxide solution to a cell density of 20 × 106 cells per mL, frozen, and stored in liquid nitrogen until use.
Mouse models of APL
All animal studies were approved by the University of North Carolina at the Chapel Hill Animal Care and Use Committee and complied with the National Institutes of Health guidelines. For the xenograft model, we used NOD.Cg-PrkdcscidIl2rgtm1Wjl/SzJ male mice (NSG mice) aged from 3 to 4 weeks, which were purchased from the animal service core facility at the University of North Carolina at Chapel Hill. NSG mice have defective macrophages and dendritic cells and lack T cells, B cells, functional natural killer cells, and complement as well as both alleles of the interleukin-2 receptor gamma chain and, therefore, lack cytokine signaling through multiple receptors.60,61 Luciferase-expressing NB4 cells (5 × 10⁶ in PBS; Corning, Corning, NY) or vehicle (control) were injected via the tail vein when NSG mice were 6 to 9 weeks old. NB4 cells were grown in mice for 14 to 31 days. Luciferase expression was measured on days 14, 21, 24, and 28 with an IVIS Lumina in vivo imaging system (Caliper Life Sciences, Waltham, MA).
We used C57BL6/J male mice from our mouse colony for the allograft model. One million splenocytes containing murine APL cells from mCG-PR+/− mice or vehicle (control) were injected intraperitoneally into C57BL6/J mice when they were 6 to 11 weeks old. Murine APL cells were grown in mice for 10 to 27 days. Cells were injected intraperitoneally rather than via the tail vein because this would have required irradiating the mice to allow for engraftment of the cells.
Measurement of circulating blood cells and associated biomarkers in whole blood
The number of platelets, WBC, and RBC as well as mean platelet volume (MPV) and hemoglobin were measured in whole blood using an Element HT5 analyzer (Heska, Loveland, Colorado).
Measurement of plasma proteins and biomarkers
Using commercial enzyme-linked immunosorbent assays, the plasma levels of different proteins and protein-inhibitor complexes were measured: TAT (Siemens, Munich, Germany; catalog number OWMG15), fibrinogen (Immunology Consultation Laboratory Inc, Portland, OR; catalog number E-90FIB), D-dimer (Diagnostica stago, Asnières-sur-Seine, France; catalog number 00947), PAP (MyBioSource.com, San Diego, CA; catalog number MBS2512896), soluble P-selectin (sP-selectin; R&D Systems Inc, Minneapolis, MN; catalog number DY737), and soluble E-selectin (sE-selectin, R&D Systems Inc; catalog number DY575).
Tail bleeding model
We used a tail-tip amputation model as previously described.62 Briefly, mice were anesthetized with isoflurane and placed in a prone position. The distal 5 mm of the tail was amputated with a razor blade. The tail was immediately immersed in 50 mL of saline prewarmed to 37°C in a 50 mL tube. Bleeding time was recorded over a 20-minute period. The xenograft and allograft models were subjected to tail bleeding on days 28 and 21, respectively.
Inhibition of TF in the xenograft and allograft models of APL
We used a mouse anti-human TF monoclonal antibody HTF-1 (eBioscience, San Diego, CA; catalog number 550252) to inhibit human TF in the xenograft model. This antibody does not inhibit mouse TF.63,64 We have previously shown that this antibody reduces TAT levels in mice bearing human pancreatic tumors.63 Mice were injected IV on day 21 with either HTF-1 (100 μg per mouse) or control mouse immunoglobulin G (IgG; 100 μg per mouse; Sigma-Aldrich; catalog number I5381). On day 28, blood was collected from the mice and plasma was prepared by centrifuging the blood at 4500g for 15 minutes. Tail bleeding was performed in a separate cohort of mice on day 28.
We used a rat anti-mouse TF monoclonal antibody 1H165 to inhibit mouse TF in the allograft model. We have previously shown that this antibody inhibits TF in mice.66,67 Mice were injected intraperitoneally on day 17 with either 1H1 (20 mg/kg) or control rat IgG (20 mg/kg; Sigma-Aldrich; catalog number I4131). Blood was collected from these mice on day 24, and plasma was prepared.
Statistics
The Shapiro-Wilk test was used for normality, and the F test was used to compare variances. For the 2-group comparisons, the unpaired 2-tailed Student t test or Welch t test was used for data with normal distribution, depending on the variances. For data with nonnormal distribution, the Mann-Whitney U test was used. For multigroup comparisons, the one-way analysis of variance with Dunnett multiple comparisons test or the Kruskal-Wallis test with Dunn multiple comparisons test was used, depending on the normality of the data. Data are shown as mean ± standard deviation (SD) for normal distribution or median ± interquartile range for nonnormal distribution. All statistical analyses were performed using GraphPad Prism version 9.5.1 (GraphPad Software, La Jolla, CA). P < .05 was considered statistically significant for all experiments.
Results
Mouse xenograft model of APL
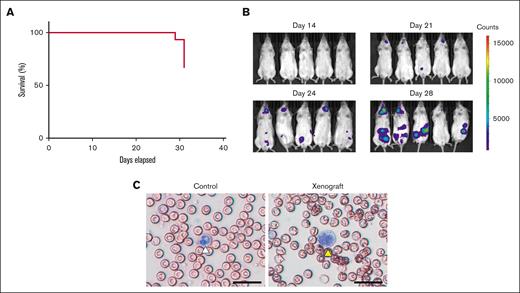
We used NB4 cells in a mouse xenograft model of APL because they are well characterized, have been used previously in mouse xenograft models, and express TF.47,48,50,56,57 We found that NB4 cells had higher levels of cellular TF activity than the human AML cell line HL-60 (supplemental Figure 1), which is consistent with results from a previous study.50 The mice were monitored for 31 days. The mice rapidly deteriorated around day 28 with immobility and ruffled fur. One mouse died on day 29, and another 4 mice died on day 31 (Figure 1A). In addition, we monitored the development of leukemia by measuring the luciferase expression in NB4 cells (Figure 1B). We first detected luciferase expression on day 21, with increased expression on days 24 and 28 (Figure 1B). On day 28, luciferase expression in APL cells was observed in the neck and abdomen, which was consistent with a previous report using mCG-PR+/− mice that found APL cells in the cervical and abdominal lymph nodes and spleen.59 The weight of spleens of leukemic mice on day 28 was not different from the weight of spleens of control mice (control vs xenograft [mean ± SD], 24.78 ± 2.63 vs 24.31 ± 7.74 mg [n = 5-8]; P = .90). Blast cells were detected in whole blood smears on day 28 (Figure 2C). The blast cell percentage on day 28 was 94.6 ± 2.7% (n = 5). Notably, we observed very few host-derived WBCs (∼5%) in the xenograft model because of the use of NSG mice, which is consistent with that reported in a previous study.68
Characterization of the mouse xenograft model of APL. (A) The survival of mice (n = 15) was monitored between days 0 and 31. One mouse died on day 29, and 5 mice died on day 31. (B) Luciferase expression in NB4 cells in mice was measured on days 14, 21, 24, and 28. Five representative mice are shown. (C) Leukemic cells were identified in whole blood smears. A normal neutrophil is marked with a white arrowhead, and a leukemic cell is marked with a yellow arrowhead; scale bar, 50 μm.
Characterization of the mouse xenograft model of APL. (A) The survival of mice (n = 15) was monitored between days 0 and 31. One mouse died on day 29, and 5 mice died on day 31. (B) Luciferase expression in NB4 cells in mice was measured on days 14, 21, 24, and 28. Five representative mice are shown. (C) Leukemic cells were identified in whole blood smears. A normal neutrophil is marked with a white arrowhead, and a leukemic cell is marked with a yellow arrowhead; scale bar, 50 μm.
Characterization of the mouse allograft model of APL. (A) The survival of mice (n = 9) was monitored between days 0 and 27. Two mice died on day 24, 2 on day 26, and 3 on day 27. (B) Leukemic cells were identified in whole blood smears. A normal neutrophil is marked with a white arrowhead, and leukemic cells are marked with yellow arrowheads (scale bar, 50 μm).
Characterization of the mouse allograft model of APL. (A) The survival of mice (n = 9) was monitored between days 0 and 27. Two mice died on day 24, 2 on day 26, and 3 on day 27. (B) Leukemic cells were identified in whole blood smears. A normal neutrophil is marked with a white arrowhead, and leukemic cells are marked with yellow arrowheads (scale bar, 50 μm).
Mouse allograft model of APL
Splenocytes containing APL cells from mCG-PR+/− mice were used in the allograft model. Mice were monitored for 27 days. The mice showed rapid deterioration, with immobility and ruffled fur, on day 24. Two mice died on day 24, 2 on day 26, and 3 on day 27 (Figure 2A). The weight of spleens of leukemic mice on day 21 was significantly increased compared with the weight of spleens of control mice (control vs allograft [mean ± SD], 71.5 ± 8.11 vs 296.8 ± 59.86 mg [n = 4-7]; P < .0001). Blast cells were detected in the whole blood smears on day 21 (Figure 2B). The blast cell percentage on day 21 was 30.4 ± 4.5% (n = 5). In contrast to the xenograft model, many host-derived WBCs (∼70%) were observed in the allograft model. In addition, we observed many burr cells in the blood of the leukemic mice (data not shown).69
Measurement of plasma biomarkers of activation of coagulation, fibrinolysis, endothelium, platelets, blood cell counts, and bleeding in the xenograft model of APL
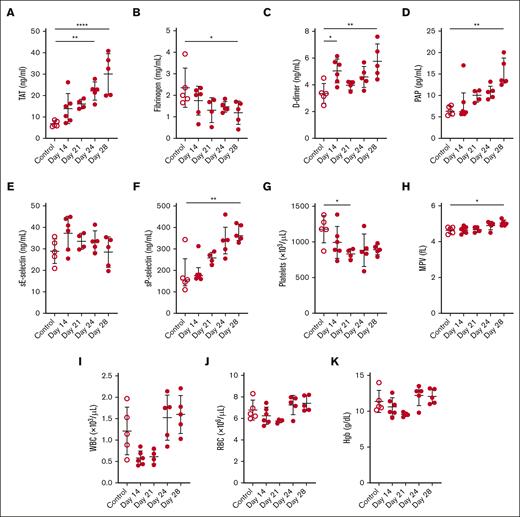
We performed a longitudinal analysis of various biomarkers of activation of coagulation, fibrinolysis, endothelium, platelets, blood cell counts, and bleeding in a xenograft model of APL. Levels of plasma TAT increased whereas levels of fibrinogen decreased in a time-dependent manner in leukemic mice (Figure 3A-B). D-dimer and PAP levels increased over time in leukemic mice (Figure 3C-D). There was no change in sE-selectin in the leukemic mice (Figure 3E). The levels of sP-selectin increased, and platelet counts decreased in a time-dependent manner in leukemic mice (Figure 3F-G). Notably, platelet counts significantly decreased on day 28 in leukemic mice compared with that in controls, using the 2-group comparison (P = .0136). The MPV was increased in leukemic mice (Figure 3H). The WBC count transiently decreased on days 14 and 21 in leukemic mice (Figure 3I). It should be noted that the Element HT5 analyzer cannot measure NB4 cells in mouse whole blood. There were no significant changes in the RBC count or hemoglobin levels in the leukemic mice (Figure 3J-K).
Biomarker and blood cell levels in a mouse xenograft model of APL. (A) TAT, (B) fibrinogen, (C) D-dimer, (D) PAP, (E) sE-selectin, (F) sP-selectin, (G) platelet count, (H) MPV, (I) WBC count, (J) RBC count, and (K) hemoglobin (Hgb) levels were measured in the plasma or whole blood of control and leukemic mice on days 14, 21, 24, and 28 (n = 4-6 per group). Data are shown as mean ± SD (A-C,E,G-K) or median ± interquartile range (D,F), depending on normality. The one-way analysis of variance with Dunnett multiple comparisons test (A-C,E,G-K) or the Kruskal-Wallis test with Dunn multiple comparisons test (D,F) was used, depending on the normality of data. ∗P < .05; ∗∗P < .01; ∗∗∗∗P < .0001.
Biomarker and blood cell levels in a mouse xenograft model of APL. (A) TAT, (B) fibrinogen, (C) D-dimer, (D) PAP, (E) sE-selectin, (F) sP-selectin, (G) platelet count, (H) MPV, (I) WBC count, (J) RBC count, and (K) hemoglobin (Hgb) levels were measured in the plasma or whole blood of control and leukemic mice on days 14, 21, 24, and 28 (n = 4-6 per group). Data are shown as mean ± SD (A-C,E,G-K) or median ± interquartile range (D,F), depending on normality. The one-way analysis of variance with Dunnett multiple comparisons test (A-C,E,G-K) or the Kruskal-Wallis test with Dunn multiple comparisons test (D,F) was used, depending on the normality of data. ∗P < .05; ∗∗P < .01; ∗∗∗∗P < .0001.
Measurement of plasma biomarkers of activation of coagulation, fibrinolysis, endothelium, platelets, blood cell count, and bleeding in the allograft model of APL
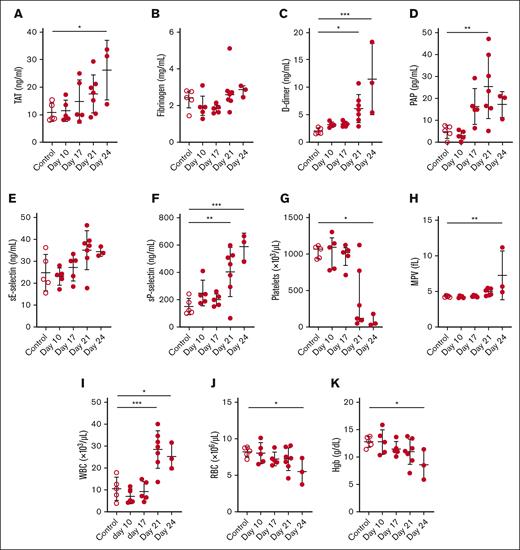
We performed a longitudinal analysis of various biomarkers of activation of coagulation, fibrinolysis, endothelium, platelets, blood cell counts, and bleeding in an allograft model of APL. It should be noted that 2 of the 5 mice died on day 24, which decreased the group size to 3. TAT levels increased in a time-dependent manner, but there was no change in fibrinogen levels in leukemic mice (Figure 4A-B). Levels of D-dimer and PAP levels increased in a time-dependent manner (Figure 4C-D). Levels of sE-selectin did not change, and levels of sP-selectin increased in a time-dependent manner (Figure 4E-F). The platelet count decreased, whereas the MPV increased in leukemic mice (Figure 4G-H). The WBC count, including leukemia cells, significantly increased on days 21 and 24 (Figure 4I). The RBC count and hemoglobin levels decreased in leukemic mice (Figure 4J-K).
Biomarker and blood cell levels in a mouse allograft model of APL. (A) TAT, (B) fibrinogen, (C) D-dimer, (D) PAP, (E) sE-selectin, (F) sP-selectin, (G) platelet count, (H) MPV, (I) WBC count, (J) RBC count, and (K) hemoglobin (Hgb) were measured in the plasma or whole blood of control and leukemic mice on days 10, 17, 21, and 24 (n = 3-7 per group). Two mice died on day 24. Data are shown as mean ± SD (A,C-F,H-K) or median ± interquartile range (B,G), depending on normality. The one-way analysis of variance with Dunnett multiple comparisons test (A,C-F,H-K) or the Kruskal-Wallis test with Dunn multiple comparisons test (B,G) was used, depending on the normality of data. ∗P < .05; ∗∗P < .01; ∗∗∗P < .001.
Biomarker and blood cell levels in a mouse allograft model of APL. (A) TAT, (B) fibrinogen, (C) D-dimer, (D) PAP, (E) sE-selectin, (F) sP-selectin, (G) platelet count, (H) MPV, (I) WBC count, (J) RBC count, and (K) hemoglobin (Hgb) were measured in the plasma or whole blood of control and leukemic mice on days 10, 17, 21, and 24 (n = 3-7 per group). Two mice died on day 24. Data are shown as mean ± SD (A,C-F,H-K) or median ± interquartile range (B,G), depending on normality. The one-way analysis of variance with Dunnett multiple comparisons test (A,C-F,H-K) or the Kruskal-Wallis test with Dunn multiple comparisons test (B,G) was used, depending on the normality of data. ∗P < .05; ∗∗P < .01; ∗∗∗P < .001.
Assessment of bleeding in the xenograft and allograft models of APL
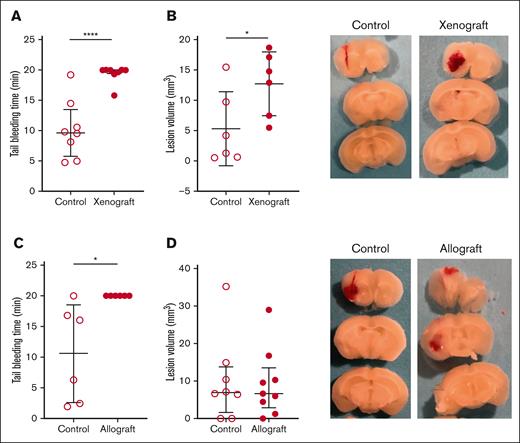
We determined if there was an increase in bleeding in the xenograft and allograft models of APL. Both models of APL exhibited prolonged tail bleeding times compared with their respective healthy control mice (Figure 5A-B). In addition, we observed increased intracranial bleeding in the xenograft model but not in the allograft model compared with their respective healthy controls (Figure 5C-D). Interestingly, 1 of the 2 mice in the allograft model that died on day 24 had a spontaneous intracranial hemorrhage (supplemental Figure 2).
Tail and brain bleeding in the mouse xenograft and allograft models of APL. The mice that received (A) xenograft (n = 8 per group) and (B) allograft (n = 6 per group) and the respective controls were subjected to tail bleeding on days 28 and 24, respectively. The mice that received (C) xenograft (n = 6 per group) and (D) allograft (n = 8-9 per group) and their respective controls were subjected to intracranial bleeding on days 28 and 24, respectively. Representative images of brain slices are shown. Data are shown as median ± interquartile range (A,D) or mean ± SD (B,C), depending on normality. The Mann-Whitney U test (A,D), unpaired 2-tailed Student t test (B), and Welch t test (C) were used. ∗P < .05; ∗∗∗∗P < .0001.
Tail and brain bleeding in the mouse xenograft and allograft models of APL. The mice that received (A) xenograft (n = 8 per group) and (B) allograft (n = 6 per group) and the respective controls were subjected to tail bleeding on days 28 and 24, respectively. The mice that received (C) xenograft (n = 6 per group) and (D) allograft (n = 8-9 per group) and their respective controls were subjected to intracranial bleeding on days 28 and 24, respectively. Representative images of brain slices are shown. Data are shown as median ± interquartile range (A,D) or mean ± SD (B,C), depending on normality. The Mann-Whitney U test (A,D), unpaired 2-tailed Student t test (B), and Welch t test (C) were used. ∗P < .05; ∗∗∗∗P < .0001.
Effect of TF inhibition on the activation of coagulation and bleeding in xenograft and allograft models of APL
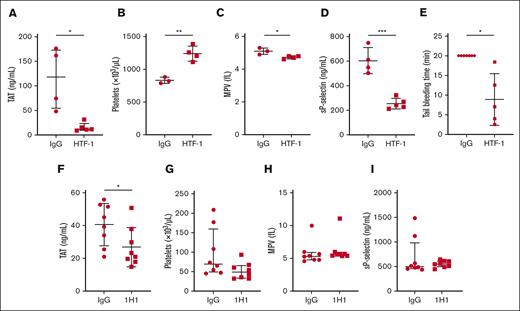
We used an inhibitory anti-human TF monoclonal antibody called HTF-1 to determine the role of APL cell-derived human TF in a xenograft model. HTF-1 inhibits APL cell-derived human TF but not host-derived mouse TF.63 We administered either HTF-1 or a control mouse IgG (2.9 mg/kg) IV to APL mice on day 21, collected the blood on day 28, and prepared the plasma or assessed tail bleeding. HTF-1 significantly reduced TAT levels in leukemic mice compared to mice receiving control IgG (Figure 6A). HTF-1 also significantly increased platelet counts and decreased MPV and sP-selectin levels in leukemic mice (Figure 6B-D). Importantly, HTF-1 significantly shortened the tail bleeding time in leukemic mice compared with that in leukemic mice receiving control IgG (Figure 6E).
Effect of TF inhibition in mouse xenograft and allograft models of APL. For the xenograft model, we intravenously injected 100 μg of an inhibitory mouse anti-human TF antibody (HTF-1) or mouse control IgG per mouse on day 21. On day 28, blood was collected, and plasma was prepared or tail bleeding was performed. (A) TAT, (B) platelet count, (C) MPV, (D) sP-selectin, and (E) tail bleeding time (n = 5-7 per group). For the allograft model, we injected 20 mg/kg of an inhibitory rat anti-mouse TF antibody (1H1) or rat control IgG into the APL intraperitoneally on day 17. On day 24, blood was collected and plasma was prepared. (F) TAT, (G) platelet count, (H) MPV, and (I) sP-selectin are shown (n = 8 per group). Data are shown as median ± interquartile range (A,G-I) or mean ± SD (B-F), depending on normality. The Mann-Whitney U test (A,G-I), unpaired 2-tailed Student t test (B-D,F), or Welch t test (E) was used. ∗P < .05; ∗∗P < .01; ∗∗∗P < .001.
Effect of TF inhibition in mouse xenograft and allograft models of APL. For the xenograft model, we intravenously injected 100 μg of an inhibitory mouse anti-human TF antibody (HTF-1) or mouse control IgG per mouse on day 21. On day 28, blood was collected, and plasma was prepared or tail bleeding was performed. (A) TAT, (B) platelet count, (C) MPV, (D) sP-selectin, and (E) tail bleeding time (n = 5-7 per group). For the allograft model, we injected 20 mg/kg of an inhibitory rat anti-mouse TF antibody (1H1) or rat control IgG into the APL intraperitoneally on day 17. On day 24, blood was collected and plasma was prepared. (F) TAT, (G) platelet count, (H) MPV, and (I) sP-selectin are shown (n = 8 per group). Data are shown as median ± interquartile range (A,G-I) or mean ± SD (B-F), depending on normality. The Mann-Whitney U test (A,G-I), unpaired 2-tailed Student t test (B-D,F), or Welch t test (E) was used. ∗P < .05; ∗∗P < .01; ∗∗∗P < .001.
We used an inhibitory anti-mouse TF antibody called 1H1 to determine the role of TF in the activation of coagulation in the allograft model. 1H1 inhibits both APL cell–and host–derived mouse TF.66,67 We administered either 1H1 or control rat IgG (20 mg/kg) intraperitoneally to the allograft model on day 14, collected the blood on day 21, and prepared the plasma. 1H1 significantly reduced TAT levels in leukemic mice compared with those in leukemic mice receiving control IgG (Figure 6F). However, 1H1 did not change the platelet count, MPV, or sP-selectin levels in leukemic mice (Figure 6G-I).
Discussion
It has long been speculated that TF expression by APL cells contributes to coagulopathy in patients.27,70 PBMCs from patients with APL express high levels of TF.35 Furthermore, the APL cell line NB4 expresses high levels of TF and releases TF+ EVs.47,48,50 We directly examined the role of TF in the activation of coagulation in 2 mouse models of APL, 1 of which used NB4 cells. Both models exhibited significantly elevated levels of plasma TAT. Importantly, we demonstrated that inhibition of TF reduced levels of plasma TAT in both models. In the xenograft model, we specifically inhibited human TF expressed by NB4 cells using a mouse anti-human TF monoclonal antibody that does not inhibit mouse TF. These results indicate that TF activates coagulation in APL mouse models.
Low fibrinogen levels are associated with bleeding in patients with APL.27-31 We observed a decrease in plasma fibrinogen levels in the xenograft model but not in the allograft model. NB4 cells express CD44, which can bind to fibrinogen and platelets.57 A previous study has also reported decreased fibrinogen levels in mice bearing NB4 cells.57 Furthermore, they showed that mice injected with NB4 cells with reduced CD44 expression did not exhibit a decrease in fibrinogen in NB4 cells.57 This suggested that CD44 expression by NB4 cells contributes to the decrease in fibrinogen levels and may explain the observed reduction in fibrinogen levels in our study.
Hyperfibrinolysis has been proposed to contribute to bleeding in patients with APL.24,32-34 Interestingly, NB4 cells were shown to increase plasmin generation initiated by tPA 28-fold compared with tPA alone in vitro.36 Consistent with clinical studies,24,33-35 we observed increased levels of both PAP and D-dimer in the 2 mouse models of APL. One study observed increased levels of plasma tPA in human cathepsin G-PML/RARα mice compared with that in controls.55 L-methionine supplementation was used to increase the levels of homocysteine, which blocks the binding of tPA to annexin A2; this resulted in decreased levels of plasma tPA in the leukemic mice.55 In future studies, we will determine the relative contributions of the annexin A2/tPA and uPA/uPAR pathways to hyperfibrinolysis observed in these mouse models of APL.
Thrombocytopenia is thought to contribute to bleeding in patients with APL.35,41-44 We observed more severe thrombocytopenia in the allograft model than that in the xenograft model. The weight of the spleens in the allograft model, but not in the xenograft model, was significantly increased compared with that of their respective controls, which is consistent with the removal of platelets from circulation by the spleen. Interestingly, we found that inhibition of TF increased the platelet count in the xenograft model but not in the allograft model. Recently, Lavallee et al performed RNA sequencing on blast cells from patients with APL and other types of AML.39 They found that podoplanin (PDPN) messenger RNA expression levels were higher in blast cells from patients with APL than in those from patients with AML.39 PDPN is a transmembrane glycoprotein that binds to its ligand, C-type lectin-like receptor 2, which is expressed on platelets and megakaryocytes.71 Binding of PDPN to C-type lectin-like receptor 2 results in the activation and aggregation of platelets.71 Lavallee et al also showed that NSG mice bearing a human AML cell line AML5 overexpressing PDPN had lower platelet counts and increased tail bleeding than NSG mice bearing wild-type AML5.39 These data suggested that PDPN contributes to thrombocytopenia in this mouse model. Further studies are needed to determine the mechanisms underlying thrombocytopenia in xenograft and allograft models of APL.
Consistent with human APL,72-74 we observed reduced levels of RBCs and hemoglobin in the allograft model but not in the xenograft model, compared with those in healthy controls. The decreased levels of RBC may be partly due to spontaneous bleeding in the allograft model. Indeed, we observed intracranial hemorrhage in 1 mouse in the allograft model that died on day 24. We observed increased tail bleeding in both the xenograft and allograft models. However, only the xenograft model exhibited increased collagenase-induced intracranial bleeding. We speculate that different factors contribute to the increased bleeding in the 2 leukemia models. In the xenograft model, we propose that decreased fibrinogen levels, mild thrombocytopenia, and hyperfibrinolysis contribute to increased bleeding. In the allograft model, we proposed that bleeding is driven by severe thrombocytopenia and hyperfibrinolysis. Importantly, inhibition of TF in the xenograft model normalized tail bleeding, indicating a role of TF in enhanced bleeding in leukemic mice.
No single mouse model of APL reproduces all the characteristics of patients with APL. Indeed, the xenograft and allograft models have strengths and weaknesses.75 The strengths of the xenograft model are that it is easy to differentiate between APL-derived human proteins and host-derived mouse proteins and it uses a well-characterized cell line NB4. Weaknesses of the xenograft model are that immunodeficient mice do not have a full immune response to the tumor and it uses a cell line. A strength of the allograft model is that it has a complete immune system. In addition, we can analyze the role of different host proteins by injecting leukemia cells into various knockout mice. The weaknesses of the allograft model are that we cannot differentiate between APL-derived and host-derived mouse proteins, and the expression of different genes in leukemia cells has not been characterized and compared with that in human APL.
In summary, the xenograft and allograft models of APL mimic many aspects of human APL in terms of the activation of coagulation, fibrinolysis, decreased platelet count, and bleeding. These models can be used to investigate the mechanisms of coagulopathy and thrombocytopenia in APL. We showed that TF contributed to the activation of coagulation in the xenograft and allograft models of APL and bleeding in the xenograft model.
Acknowledgments
The authors acknowledge Charlene. M. Santos and Sherie Quillen in the Animal Service Core facility at University of North Carolina. The authors thank Alisa S. Wolberg, Steven P. Grover, and Nigel S. Key for their helpful comments.
This work was supported by grants from the National Institutes of Health, National Heart, Lung, and Blood Institute (N.M.; 1R35HL155657), the John C. Parker Professorship (N.M.), and SENSHIN Medical Foundation (T.K.).
Authorship
Contribution: Y.H. and N.M. designed the study; J.S.W. provided splenocytes from a transgenic mouse line that developed spontaneous APL; Y.H., T.K., and S.J.A. performed the experiments; Y.H., T.K., S.J.A., B.N.R., and N.M. analyzed the data; Y.H. and N.M. wrote the manuscript; and all authors read and approved the manuscript.
Conflict-of-interest disclosure: J.S.W. is an employee of A2 Biotherapeutics. The remaining authors declare no competing financial interests.
The current affiliation for J.S.W. is A2 Biotherapeutics, Agoura Hills, CA.
Correspondence: Yohei Hisada, University of North Carolina Blood Research Center, Division of Hematology, Department of Medicine, University of North Carolina at Chapel Hill, 8004 Mary Ellen Jones Bldg CB#7035, 116 Manning Dr, Chapel Hill, NC 27599; e-mail: yohei_hisada@med.unc.edu.
References
Author notes
Data are available on request from the corresponding author, Yohei Hisada (yohei_hisada@med.unc.edu).
The full-text version of this article contains a data supplement.

