

Key Points
Allogenic SCT leads to damage of the proliferative capacity of BM-MSC.
This damage correlates with clinical outcome of alloSCT, reduced patient survival, and impaired engraftment of allogeneic hematopoiesis.

Abstract
Engraftment and differentiation of donor hematopoietic stem cells is decisive for the clinical success of allogeneic stem cell transplantation (alloSCT) and depends on the recipient’s bone marrow (BM) niche. A damaged niche contributes to poor graft function after alloSCT; however, the underlying mechanisms and the role of BM multipotent mesenchymal stromal cells (MSC) are ill-defined. Upon multivariate analysis in 732 individuals, we observed a reduced presence of proliferation-capable MSC in BM aspirates from patients (N = 196) who had undergone alloSCT. This was confirmed by paired analysis in 30 patients showing a higher frequency of samples with a lack of MSC presence post-alloSCT compared with pre-alloSCT. This reduced MSC presence was associated with reduced survival of patients after alloSCT and specifically with impaired graft function. Post-alloSCT MSC showed diminished in vitro proliferation along with a transcriptional antiproliferative signature, upregulation of epithelial-mesenchymal transition and extracellular matrix pathways, and altered impact on cytokine release upon contact with hematopoietic cells. To avoid in vitro culture bias, we isolated the CD146+/CD45–/HLA-DR– BM cell fraction, which comprised the entire MSC population. The post-alloSCT isolated native CD146+MSC showed a similar reduction in proliferation capacity and shared the same antiproliferative transcriptomic signature as for post-alloSCT colony-forming unit fibroblast–derived MSC. Taken together, our data show that alloSCT confers damage to the proliferative capacity of native MSC, which is associated with reduced patient survival after alloSCT and impaired engraftment of allogeneic hematopoiesis. These data represent the basis to elucidate mechanisms of BM niche reconstitution after alloSCT and its therapeutic manipulation.
Introduction
Allogeneic stem cell transplantation (alloSCT) is the only curative treatment option for many myeloid neoplasms. It requires the engraftment of allogeneic hematopoiesis in and the elimination of malignant myeloid cells from the recipient bone marrow (BM) niche. Accordingly, major risks for mortality after alloSCT result from infection during neutropenia and relapse.1 In up to 25% of all patients undergoing alloSCT, poor engraftment and delayed hematopoietic reconstitution pose an additional risk of mortality.2
Recent studies in murine models of alloSCT show that the recipient BM niche determines engraftment of donor hematopoiesis.3 This is in agreement with the well-known relevance of the BM niche in humans for maintaining the hematopoietic stem cell (HSC) population and controlling their differentiation.4
Multipotent mesenchymal stromal cells (MSC) comprise a major constituent of the human BM niche.5 Human BM-MSC are mainly derived in vitro as colony-forming unit–fibroblast (CFU-F) from plastic adherent BM mononuclear cells (BM-MNC) and are defined according to consensus criteria.6 Because plastic adherence–based isolation of MSC mandates their in vitro expansion, phenotypic markers, such as CD146 have been explored to allow isolation of native MSC.7,8 Several observations in murine models and humans show the decisive role of MSC for maintaining normal hematopoiesis.9,10
MSC isolated from BM of patients after alloSCT originate from the recipient.11,12 This correlates with the observed resistance of BM-MSC toward genotoxic damage demonstrated in our previous study.13 Therefore, the recipient's BM niche is retained upon alloSCT and provides the microenvironment for engraftment of allogeneic hematopoiesis. Accordingly, expression of specific genes in MSC seems to enhance the engraftment of HSC in alloSCT models.14
However, murine models suggest that alloSCT also confers a specific damage to BM-MSC, which requires months to regenerate.15 Consequently in murine alloSCT models, damage of MSC results in reduced hematopoietic engraftment.3 Cytotoxic and inflammatory processes in the context of alloSCT may lead to changes in BM niche and specifically to alterations in BM-MSC thereby affecting donor hematopoiesis and the associated clinical outcome. Therefore, a better understanding of the molecular underpinnings of post-alloSCT niche function and its effects on graft functionality is warranted.
Here, we provide insight into a specific damage signature induced because of alloSCT in BM-MSC recipients. To the best of our knowledge, we show for the first time that a reduced proliferation capacity of MSC and altered transcriptional signature including upregulation of epithelial-mesenchymal transition (EMT) correlates with impaired allogeneic engraftment and associated clinical outcome. This argues for a contribution of MSC to the reconstitution of the post-alloSCT–BM niche and supports MSC as a target for therapeutic niche repair.
Material and methods
Source of primary human BM samples
Human BM samples were obtained from individuals who underwent diagnostic BM aspiration for various clinical conditions, for diagnostic staging of malignant disease or in preparation of allogeneic stem cell donation at the Department for Internal Medicine IV, University Hospital Halle (Saale) from February 2003 to December 2021 after obtaining informed consent. Characteristics of the entire cohort are shown in Table 1. All studies involving human material were approved by the internal review or ethics board of the medical faculty at the Martin Luther University of Halle-Wittenberg.
Main characteristics of individuals from whom BM aspirates were analyzed
| Entire patient cohort (N = 732) (n %) | |
| Age (median), y | 62 (15-91) |
| <40 y, N | 82 (11.2) |
| ≥40 to < 60 y, N | 237 (32.4) |
| ≥60 y, N | 413 (56.4) |
| Gender | |
| Female, N | 295 (40.6) |
| Male, N | 437 (59.7) |
| Diagnosis | |
| AML, N | 206 (28.1) |
| ALL, N | 35 (4.8) |
| CML, N | 13 (1.8) |
| CLL, N | 31 (4.2) |
| Other MPN, N | 11 (1.4) |
| MDS, N | 63 (8.6) |
| Hodgkin lymphoma, N | 12 (1.6) |
| Non-Hodgkin lymphoma, N | 141 (19.3) |
| Multiple myeloma, N | 97 (13.3) |
| Solid tumor, N | 90 (12.3) |
| Other hematological disease, N | 50 (6.8) |
| Healthy individual, N | 11 (1.5) |
| Therapy | |
| Allogeneic SCT, N | 196 (26.8) |
| Autologous SCT, N | 58 (7.9) |
| Prior chemotherapy, N | 435 (59.4) |
| Prior radiation, N | 186 (25.4) |
| Unknown, N | 45 (6.1) |
| alloSCT patient cohort (N = 196) | |
| Disease status at the time of alloSCT | |
| CR | 81 (41.3) |
| PR | 33 (16.8) |
| SD, refractory or progressive disease | 71 (36.2) |
| Unknown | 11 (5.7) |
| Conditioning regimen | |
| MAC | 34 (17.3) |
| RIC | 142 (72.4) |
| NMA | 14 (7.1) |
| Unknown | 6 (3.1) |
| GvHD prophylaxis | |
| CsA + MMF | 130 (66.3) |
| CsA + MTx | 43 (21.9) |
| CNI + MMF + PTCy | 9 (4.6) |
| Other/unknown | 14 (7.2) |
| Use of ATG | 153 (78.1) |
Numbers refer to individuals in the entire cohort or the alloSCT cohort as indicated. If multiple samples were obtained from one individual, data from this individual are included only once.
ALL, acute lymphoblastic leukemia; ATG, anti-thymocyte globuline; CLL, chronic lymphatic leukemia, CML, chronic myeloid leukemia; CNI, calcineurin inhibitor (CsA or tacrolimus); CsA, cyclosporine A; CR, complete remission; MAC, myeloablative conditioning; MDS, myelodysplastic syndrome; MMF, mycophenolate; MPN, myeloproliferative neoplasia; MTx, methotrexate; NMA, nonmyeloablative conditioning; PR, partial remission; PTCy, post SCT cyclophosphamide; RIC, reduced intensity conditioning; SD, stable disease.
Isolation and cell culture of CFU-F–derived MSC
MSC were isolated from human BM as described previously using density gradient centrifugation and harvest of CFU-F cells.13 MSC-growth medium was composed of Dulbecco’s modified Eagle medium (low glucose, GlutamaX; Gibco) supplemented with 10% human platelet lysate, 1 U/mL heparin, and 1% penicillin/streptomycin (both Sigma-Aldrich).
For growth kinetics passage 1, cells were seeded with 200 cells/cm2 with subsequent passaging and cell counting at 50% confluence for up to passage 4. Population doubling (PD) and doubling time (PDT) were calculated using the formulas PD = lg ([n cells harvested]/[n cells plated])/lg2 and PDT = t/PD, where t represents the time between plating and passaging.
Multipotent differentiation potential was tested through induction of adipogenic and osteogenic differentiation and staining-based analysis as described previously.16
Fluorescence-activated cell sorting (FACS) and flow cytometry
CD146+/CD45-/HLA-DR--MSC were isolated from noncultured BM-MNC using multicolor FACS using standard protocols (ARIA II; BD Biosciences). Immunophenotype of CFU-F–derived MSC and CD146+/CD45-/HLA-DR--MSC was analyzed using flow cytometry (LSRFortessa, FACSDiva software; BD Biosciences) according to a standardized protocol. The evaluated antigens were selected according to the International Society for Cellular Therapy consensus.6 For FACS and flow cytometric analyses the following mouse anti-human antibodies were used: CD90-PE, CD105-FITC, CD146-PE, CD45-FITC, HLA-DR-FITC, CD34-FITC, CD73-PE, CD14-PE, and CD19-FITC (all Miltenyi Biotec).
Isolation and culture of umbilical cord blood–HSC (UCB-HSC)
Human umbilical cord blood (UCB)–MNC were isolated from fresh UCB using density gradient centrifugation (1.077 g/mL). CD34+-HSC were isolated from UCB-MNC using CD34 MicroBead Kit UltraPure (Miltenyi Biotec). The necessary purity was determined through flow cytometry using mouse anti-human CD34-APC and CD45RA-APC-H7 antibodies (BD Biosciences) and amounted to 95% double positive cells. HSC medium was composed of Iscove modified Dulbecco medium (Gibco) supplemented with 20% bovine serum albumin, insulin, and transferrin 9500 Serum Substitute (StemCell Technologies), gentamycin 1:1000, 10 μg/mL low-density lipoproteins, 35 nM UM171, 50 ng/mL rhTPO, 100 ng/mL rhSCF, and 100 ng/mL rhFlt3-L (all Immunotools).
MSC-HSC coculture experiments
MSC were seeded at 10 000 cells/cm2 in MSC growth medium. After 24 hours medium was removed and 10 000 UCB-HSC/cm2 suspended in HSC medium were added. For each coculture, UCB-HSC from 3 different donors were pooled. Unmixed cultures of UCB-HSC and MSC served as the respective negative controls. After 7 days, all cells were harvested and separated using FACS for CD105 expression. The fraction of CD105– cells (non-MSC cells) was analyzed for CD34 and CD45RA expression using flow cytometry. PD and PDT were calculated and compared in relation to starting cell numbers.
Cytokine assay
Profiling of soluble factors was performed through 2-dimensional coculture of MSC with peripheral blood (PB) MNC. For each MSC sample, separate cocultures with PBMNC from 2 different donors were analyzed. Cytokine assays were performed in RPMI-1640 (Gibco) supplemented with 10% fetal calf serum and each condition was performed in duplicates. MSC were seeded in 96-well plates with 8000 cells per well. After 24 hours, 80 000 PBMNC per well were added. After 96 hours, medium supernatants were collected for determination of cytokine levels using the MACSPlex Cytokine 12 Kit, human (Miltenyi Biotech) according to manufacturer’s instructions. Data were acquired on a BD FACSCelesta flow cytometer and analyzed with FlowLogic software (version 8.1, Inivai Technologies).
RNA isolation and RNA sequencing
Total RNA of 1 to 1.5 × 10⁶ in vitro expanded MSC was extracted using TRIzol reagent (Invitrogen) according to manufacturer’s instructions. Native CD146+/CD45-/HLA-DR—MSC were straight shock frosted in liquid nitrogen after FACS-sorting. RNA was isolated using the RNeasy Micro Kit (Qiagen) according to manufacturer’s instructions. RNA processing and sequencing were performed at Novogene (United Kingdom) Company Limited (Cambrigde, GB) and 16.8 million reads were obtained per sample with paired end sequencing.
Results
Reduced presence of CFU-F after alloSCT
We analyzed a total of 1273 BM samples which were derived from 732 individuals, including patients with hematological malignancies, nonmalignant diseases, and healthy individuals (Table 1) including individuals without or with prior alloSCT for various diseases (Figure 1A).

CFU-F presence is reduced in BM aspirates after alloSCT and correlates with clinical outcome after alloSCT. (A) Overview of all analyzed samples (N = 1273) regarding their origin from individuals with prior alloSCT as well as the underlying diseases in samples obtained after alloSCT. The values of underlying diseases sum up to >100% because of patients with >1 malignant hematological disease. (B) Presence of CFU-F in BM aspirates in individuals depending on previous alloSCT. Only individuals (N = 686) with available data on alloSCT as well as only data for the last BM aspirate for each individual to avoid bias of multiple aspirates in single individuals were included. (C) Multivariate analysis for the presence of CFU-F in BM aspirates of the entire cohort as analyzed in (B). (D) Presence of CFU-F in BM aspirates of 30 patients (paired samples) at different time points before alloSCT, early (d 0 until d +99) and late (after d +180) after alloSCT. (E) Kaplan-Meier analyses for overall survival after alloSCT depending on the presence of CFU-F in BM aspirates. Included were all patients according to the chronologically first sample obtained after alloSCT (N = 196). (F) Presence of CFU-F in BM aspirates obtained after alloSCT in patients with good and poor engraftment. If multiple BM aspirates were available in single patients, the chronologically first sample was included. The discrepancy to (E) in the total number of analyzed patients results from missing data regarding engraftment in one patient.
CFU-F presence is reduced in BM aspirates after alloSCT and correlates with clinical outcome after alloSCT. (A) Overview of all analyzed samples (N = 1273) regarding their origin from individuals with prior alloSCT as well as the underlying diseases in samples obtained after alloSCT. The values of underlying diseases sum up to >100% because of patients with >1 malignant hematological disease. (B) Presence of CFU-F in BM aspirates in individuals depending on previous alloSCT. Only individuals (N = 686) with available data on alloSCT as well as only data for the last BM aspirate for each individual to avoid bias of multiple aspirates in single individuals were included. (C) Multivariate analysis for the presence of CFU-F in BM aspirates of the entire cohort as analyzed in (B). (D) Presence of CFU-F in BM aspirates of 30 patients (paired samples) at different time points before alloSCT, early (d 0 until d +99) and late (after d +180) after alloSCT. (E) Kaplan-Meier analyses for overall survival after alloSCT depending on the presence of CFU-F in BM aspirates. Included were all patients according to the chronologically first sample obtained after alloSCT (N = 196). (F) Presence of CFU-F in BM aspirates obtained after alloSCT in patients with good and poor engraftment. If multiple BM aspirates were available in single patients, the chronologically first sample was included. The discrepancy to (E) in the total number of analyzed patients results from missing data regarding engraftment in one patient.
To identify factors that affect BM-MSC, we first analyzed the presence of CFU-F in samples from all individuals as an indicator for the presence and proliferation of BM-MSC. To avoid the bias of multiple sampling only the chronologically last sample was included in statistical analysis from each individual. CFU-F could not be isolated from 27.6% of individuals who had undergone a prior alloSCT, whereas this was the case in only 16.7% of individuals without prior alloSCT. Therefore, the chance to isolate CFU-F was significantly reduced in patients after alloSCT (Figure 1B).
Other than alloSCT, gender, acute myeloid leukemia (AML) as underlying disease, previous chemotherapy, previous autologous SCT, and age >40 years were associated with reduced presence of CFU-F in univariate analysis and were, therefore, included in multivariate analysis. Here, besides other factors, an association of previous alloSCT with a reduced presence of CFU-F was confirmed (Figure 1C). Given its clinical significance and lack of data, we focused our further analysis on the impact of alloSCT. Selected characteristics of the alloSCT cohort are listed in Table 1, showing a typical composition of disease status at SCT, conditioning, and graft-versus-host disease (GvHD) prophylaxis.
Analysis in paired samples (N = 30) showed that the presence of CFU-F was persistently reduced in BM aspirates after alloSCT (post-alloSCT). Although before alloSCT (pre-alloSCT) CFU-F were present in 100% of the patients, no CFU-F were present in 20% of patients during early (<100d, ø+29d) and in 26.7% of patients during late (>180d, ø430d) post-alloSCT (Figure 1D). In 4 of the 6 patients the lack of CFU-F was observed at both time points, ie, during early and late post-alloSCT.
Taken together, these data support the notion that alloSCT confers a lasting damage to the BM niche.
Clinical outcome after alloSCT correlates with reduced CFU-F presence
Next, we analyzed whether this putative damage has a clinical significance. Strikingly, a lack of CFU-F in BM aspirates after alloSCT was significantly associated with reduced overall patient survival (Figure 1E). Although no significant association with progression free survival was observed (data not shown), subgroup analysis suggested a reduced CFU-F presence in patients with relapse of myeloid malignancies after alloSCT (supplemental Figure 1A). Moreover, univariate analysis showed association of a lack of CFU-F in post-alloSCT samples with impaired graft function (Figure 1F; Material and Methods for definition).
A multitude of disease- and therapy-related factors affect clinical outcome in alloSCT. Many of those may also be related to damage of the BM stroma. However, the putative causal relationship is ambiguous. Therefore, we refrained from multivariate outcome analysis but performed univariate analysis on the association of selected factors with reduced presence of CFU-F after alloSCT. Neither the disease leading to alloSCT (data not shown) nor disease status at the time of alloSCT, conditioning intensity, and GvHD prophylaxis showed an association with post-alloSCT CFU-F presence (Table 2). The graft source was not included because only 2 patients received BM transplants and all other peripheral blood stem cell grafts.
Association of CFU-F presence with alloSCT-related factors and with remission status at time of BM aspirate in the cohort of patients receiving alloSCT
| CFU-F present N (%) | No CFU-F present N (%) | P value | |
|---|---|---|---|
| Disease status at time of alloSCT | .50 | ||
| CR | 58 (42.3) | 23 (47.9) | |
| Non CR | 79 (57.7) | 25 (52.1) | |
| Conditioning regimen | .22 | ||
| MAC | 22 (15.8) | 12 (23.5) | |
| RIC or NMA | 117 (84.2) | 39 (76.5) | |
| Use of ATG | .07 | ||
| Yes | 116 (84.1) | 37 (72.5) | |
| No | 22 (15.9) | 14 (27.5) | |
| GvHD-prophylaxis | .21 | ||
| CNI + MMF | 104 (78.8) | 35 (70.0) | |
| CNI + MTx | 28 (21.2) | 15 (30.0) | |
| Remission at BM aspirate | .76 | ||
| CR | 120 (84.5) | 43 (82.7) | |
| Non CR | 22 (15.5) | 9 (17.3) | |
| Chimerism at BM aspirate | .047 | ||
| 100% donor | 104 (80.0) | 28 (65.1) | |
| Persisting recipient fraction | 26 (20.0) | 15 (34.9) |
For each patient, only the last available BM aspirate after alloSCT was included to avoid bias of repeated aspirates. Comparison was performed univariately using χ2 test.
ATG, anti-thymocyte globuline; CNI, calcineurin inhibitor (cyclosporine A or tacrolimus); CR, complete remission; MAC, myeloablative conditioning; MMF, mycophenolate; MTx, methotrexate; NMA, nonmyeloablative conditioning; RIC, reduced intensity conditioning.
Interestingly, we observed a trend to a higher rate of persistent recipient chimerism (P = .047) in samples with no CFU-F presence whereas remission status at time of post-alloSCT BM aspirate was similar for samples with and without CFU-F presence (Table 2).
These data show that the observed damage of the BM niche correlates with the clinical outcome of alloSCT.
After alloSCT CFU-F cells show MSC-characteristics but altered proliferation and interaction with hematopoietic cells
CFU-F reflect the presence of MSC and their subsequent in vitro proliferation. Therefore, our data indicate that alloSCT causes damage to BM MSC. We thus evaluated the CFU-F cells regarding their MSC features.
For both, pre-alloSCT and post-alloSCT–derived CFU-F cells, we observed the defining MSC consensus criteria,6 ie, plastic adherent growth, phenotype (CD105+, CD73+, CD90+, CD45-, CD34-, CD14-, CD19-, and HLA-DR-) and multipotent (osteogenic and adipogenic) differentiation (data not shown). Therefore, we referred to pre- and post-alloSCT CFU-F cells as MSC.
However, a reduced in-vitro proliferation with an increased PD time (Figure 2A) and a reduced PD (supplemental Figure 1B) were seen for MSC-derived post-alloSCT compared with the respective paired pre-alloSCT MSC. Because the analyzed samples had been cryopreserved at CFU-F harvest (passage 1) and cryopreservation may affect cellular fitness, we compared duration of cryopreservation from the time of passage 1 to the time of thawing for proliferation analysis. Neither a difference between pre- and post-allSCT samples (median 25.4 months vs 24.3 months; supplemental Figure 1C) nor an association with the proliferation kinetics of individual samples was observed (supplemental Figure 1B).
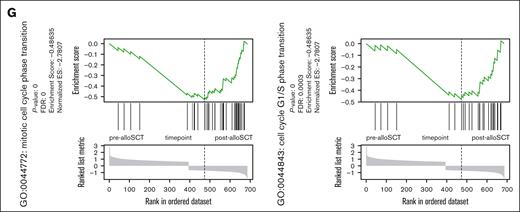
Post-alloSCT MSC show altered interaction with hematopoietic cells, reduced proliferation and differential expression of genes regulating proliferation, EMT and ECM. (A) PDT during in vitro expansion of paired pre- and post-alloSCT MSC from 8 patients; expansion was started at thawing of cryopreserved passage 1 CFU-F samples. (B) Levels of selected cytokines in unstimulated cocultures of allogeneic PBMNC with pre- or post-alloSCT MSC. Paired MSC samples from 7 patients, PBMNC from third-party donors (unrelated to SCT-donor), multiplex cytokine analysis, median marked. (C-G) RNAseq analysis was performed in MSC derived prior and after alloSCT from 5 patients. Each sample was prepared and sequenced in duplicates. Heatmaps of (C) total differentially expressed genes and (D) top 20 up- and downregulated genes (rows) in MSC pre- and post-alloSCT (columns). Expression of enriched gene sets of (E) downregulated and (F) upregulated genes in post-alloSCT MSC vs pre-alloSCT MSC. (G) Exemplarily, enrichment plots of 2 specific gene sets (mitotic cell cycle phase transition, GO:0044772; cell cycle G1/S phase transition, GO:0044843) are shown.
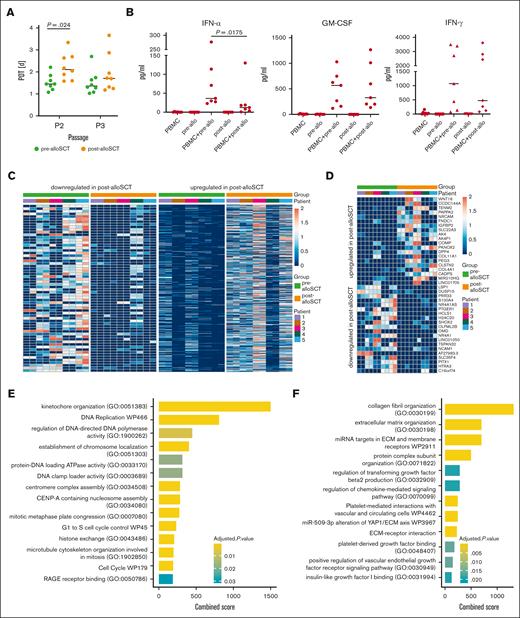
In unstimulated cocultures of MSC and allogeneic PBMNC (ie, simulating a post-alloSCT situation) we observed an altered release of specific cytokines with post-alloSCT MSC compared with the respective paired pre-alloSCT MSC. Particularly levels for interferon-α but also for granulocyte-macrophage colony-stimulating factor and interferon-γ were reduced (Figure 2B) whereas others, such as interleukin 2 (IL-2), IL-5, IL-9 and tumor necrosis factor–α were not altered (data not shown). This experimental set-up does not determine the cellular source of the cytokine (MSC or PBMNC) but suggests that alloSCT alters the ability of MSC to regulate release of hematopoiesis-related cytokines.
In mitogen-stimulated cocultures ie, analyzing a regulatory potential of MSC, the ability of MSC to repress mitogen-induced expression of IL-2, IL-9, IL-10, and tumor necrosis factor–α was unaltered by alloSCT (supplemental Figure 1D) suggesting that this immune-regulatory capacity is maintained in MSC after alloSCT.
These data show that alloSCT confers a damage to the proliferative capacity of BM MSC as well as an alteration of functional features of BM MSC.
BM-MSC show distinct alteration of gene expression after alloSCT
These alterations in functional characteristics suggested an alloSCT-related alteration in MSC gene expression. To explore this, we analyzed the transcriptome of paired samples of MSC derived before and after alloSCT (n = 5) using bulk RNA sequencing (RNAseq). Overall, 581 genes showed upregulation and 430 genes were downregulated after alloSCT (Figure 2C) demonstrating a differential gene expression (DGE) in MSC consequence of the alloSCT.
Illustrated using the top 20 regulated genes (Figure 2D), changes in gene expression were highly variable across patients. Gene set enrichment analysis revealed suppression of genes involved in proliferation and cell cycle regulation in post-alloSCT MSC (Figure 2E). In contrast, genes related to mesenchymal differentiation and extracellular matrix (ECM) were upregulated in post-alloSCT MSC (Figure 2F). The observation of a downregulation of proliferation-related gene sets is illustrated through genes distribution in the sets GO:0044843 and GO:0044772 (Figure 2G).
Given the inhomogeneous DGE in post-alloSCT MSC we compared gene expression among individual patients. Interestingly, we observed a clustering of pat3 and pat5 against pat1, pat2, and pat4 (Figure 3A). This pattern correlated with a differential proliferation capacity of post-alloSCT MSC from these patients. MSC of pat1, pat2, and pat4 showed a stable proliferation pattern before and after alloSCT with a PDT of 1.5 to 2 days over several passages. We and others have previously reported such PDT13 as being typical of MSC. In contrast, post-alloSCT MSC from pat3 and pat5 showed reduced proliferation with an increased PDT compared with their respective paired pre-alloSCT MSC samples (Figure 3B; supplemental Figure 1B).

Post-alloSCT derived MSC with reduced proliferation show specific differential expression for genes regulating EMT and ECM. (A) Sample similarity distance matrix of RNAseq analysis from Figure 2 in post-alloSCT MSC of patients 1 to 5 (n = 5 with technical duplicates A/B). (B) PDT (over passage 2-5) in pre- and post-alloSCT MSC from patients 1 to 5. (C) Authentication of DGE in post- vs pre-alloSCT MSC according to their differential proliferation, ie, normal proliferation of post-alloSCT MSC from patients 1, 2, and 4 and reduced proliferation in post-alloSCT MSC from patients 3 and 5. (D) GSEA for upregulated genes in post-alloSCT MSC with damaged proliferation, ie, patient 3 and 5.
Post-alloSCT derived MSC with reduced proliferation show specific differential expression for genes regulating EMT and ECM. (A) Sample similarity distance matrix of RNAseq analysis from Figure 2 in post-alloSCT MSC of patients 1 to 5 (n = 5 with technical duplicates A/B). (B) PDT (over passage 2-5) in pre- and post-alloSCT MSC from patients 1 to 5. (C) Authentication of DGE in post- vs pre-alloSCT MSC according to their differential proliferation, ie, normal proliferation of post-alloSCT MSC from patients 1, 2, and 4 and reduced proliferation in post-alloSCT MSC from patients 3 and 5. (D) GSEA for upregulated genes in post-alloSCT MSC with damaged proliferation, ie, patient 3 and 5.
In accordance, alloSCT-related DGE was pronounced in these specifically proliferation-damaged post-alloSCT MSC. As shown in Figure 3C, DGE between pre-alloSCT and post-alloSCT MSC showed only limited overlap between clustered samples of post-alloSCT MSC with regular (pat1, pat2, pat4) and reduced (pat3, pat5) proliferation. In these post-alloSCT MSC with reduced proliferation ie, pat3 and pat5, gene set enrichment analysis (GSEA) between pre-alloSCT and post-alloSCT MSC showed a strong enrichment for ECM- and EMT–related genes (Figure 3D).
These data demonstrate that alloSCT induces an alteration in expression of proliferation-related genes in MSC.
CD146+/CD45-/HLA-DR- cells harbor the entire CFU-F capacity in pre- and post-alloSCT BM aspirates
CFU-F–derived MSC inevitably have been exposed to in vitro culture condition and all subsequent analysis may therefore be biased. To confirm the effects of alloSCT on noncultured MSC, we investigated FACS-isolated native cells. Based on previous studies7 we applied a FACS protocol (illustrated in supplemental Figure 2A) to isolate CD146+/CD45-/HLA-DR- cells from pre- and post-alloSCT BM–MNC samples in patients with AML. As for CFU-F isolated MSC samples, in all BM-MNC samples used for FACS isolation no differences in the duration of cryopreservation between harvest (day of BM-aspirate) and thawing for FACS isolation were observed between pre- and post-alloSCT BM–MNC samples (median 14.0 months vs 9.4 months).
Overall, the CD146+/CD45–/HLA-DR- fraction comprised a small cell population. In pre-alloSCT samples, it represented 0.029% (mean, ±0.00037) of BM-MNC resulting in a mean absolute cell number of 1689 cells from each BM aspirate (±2064). In post-alloSCT aspirates the presence of the CD146+/CD45–/HLA-DR– population was further reduced representing only 0.019% (mean, ±0.00019) of BM-MNC and yielding a mean cell number of 1117 (±1342) from each aspirate (supplemental Figure 2B).
Upon in vitro culture after the FACS isolation, CFU-F from pre- and post-alloSCT samples always grew out in the CD146+/CD45–/HLA-DR– fraction (Figure 4A) but neither in the CD45/HLA-DR+ nor in the CD45/HLA-DRdim nor in the CD146–/CD45–/HLA-DR– fraction.

Pre- and post-alloSCT CD146+MSC harbor the entire CFU-F capacity and similarly support the progenitor phenotype in hematopoietic cells. (A) Frequency of CFU-F in the CD146+ and CD146- subpopulation of the CD45-/HLA-DR- fraction of BM-MNC. (B-C) Post-alloSCT–derived CD146+CD45-HLA-DR- cells were expanded and analyzed for their surface antigen expression (B) by flow cytometry (a representative sample shown) and for their differentiation potential (C) through culture in growth medium (undifferentiated) or specific osteogenic and adipogenic differentiation media (representative sample, staining with alizarin pH4 and oil red for calcium deposition and lipid droplets, light microscopy, phase contrast, original magnification ×100). (D-E) CD146+MSC derived pre- and post-alloSCT (paired patient samples) were directly cocultured with CB CD34+ cells and proliferation (D) through cell counting (n = 3) as well as expression of CD34 and CD45RA (E) by flow cytometry (representative sample) was determined in separated (CD105-) hematopoietic cells at day 7 of coculture compared with culture without MSC. (F) Frequencies of hematopoietic subpopulations according to their expression of CD34 and CD45RA from the cocultures (paired patient samples, n = 3) described in (D) and (E) given as mean percentage of cells.
Pre- and post-alloSCT CD146+MSC harbor the entire CFU-F capacity and similarly support the progenitor phenotype in hematopoietic cells. (A) Frequency of CFU-F in the CD146+ and CD146- subpopulation of the CD45-/HLA-DR- fraction of BM-MNC. (B-C) Post-alloSCT–derived CD146+CD45-HLA-DR- cells were expanded and analyzed for their surface antigen expression (B) by flow cytometry (a representative sample shown) and for their differentiation potential (C) through culture in growth medium (undifferentiated) or specific osteogenic and adipogenic differentiation media (representative sample, staining with alizarin pH4 and oil red for calcium deposition and lipid droplets, light microscopy, phase contrast, original magnification ×100). (D-E) CD146+MSC derived pre- and post-alloSCT (paired patient samples) were directly cocultured with CB CD34+ cells and proliferation (D) through cell counting (n = 3) as well as expression of CD34 and CD45RA (E) by flow cytometry (representative sample) was determined in separated (CD105-) hematopoietic cells at day 7 of coculture compared with culture without MSC. (F) Frequencies of hematopoietic subpopulations according to their expression of CD34 and CD45RA from the cocultures (paired patient samples, n = 3) described in (D) and (E) given as mean percentage of cells.
We, therefore, conclude that the CD146+/CD45–/HLA-DR--fraction contains the entire CFU-F capacity and therefore entire MSC population in BM-MNC.
Pre- and post-alloSCT CD146+/CD45–/HLA-DR– cells show similar MSC characteristics including support of hematopoietic progenitor phenotype
To prove that the CD146+/CD45-/HLA-DR– fraction harbors the MSC population, we expanded sorted cells and analyzed MSC characteristics before and after alloSCT.
Flow cytometry confirmed that CD146+/CD45–/HLA-DR– cells show a bona fide MSC phenotype (positive for CD105, CD90, and CD73; negative for CD45, HLA-DR, CD34, CD14, and CD19; Figure 4B). Furthermore, expanded CD146+/CD45–/HLA-DR– cells showed a multipotent differentiation potential over several passages exemplified by osteogenic as well as adipogenic differentiation upon respective induction (Figure 4C). In summary, the CD146+/CD45–/HLA-DR–-BM–MNC fraction fulfilled the consensus criteria for MSC6 and were termed CD146+MSC in contrast to MSC-derived conventionally using CFU-F isolation. With respect to these defining characteristics, we did not see any differences for CD146+MSC harvested from patients (n = 3) before and after alloSCT.
Although others have shown the recipient origin of CFU-F–derived and in vitro–expanded MSC, such analysis is missing for native MSC. Given their limited cell number we could not perform conventional chimerism analysis in native CD146+/CD45–/HLA-DR– cells. However, analysis of Y-chromosomal gene expression in the RNAseq data set of one female patient with a male peripheral blood stem cell–donor suggested the presence of some male cells (data not shown). It, therefore, remains highly speculative whether some donor cells contribute to the CD146+/CD45–/HLA-DR– population.

Post-alloSCT CD146+MSC harbor reduced CFU-F capacity. (A) Presence of CFU-F in BM aspirates at pre-alloSCT (n = 19) and post-alloSCT (n = 26). (B) Proportion of CD146+MNC cells in the CD45-/HLA-DR- BM-MNC–fraction in BM aspirates of 16 patients pre- and post-alloSCT. (C) Summary of 14 patients with CD146+CFU-Fs presence, mean of CFU-Fs per 1000 sorted CD146+BM-MNC and median of CFU-Fs.
Post-alloSCT CD146+MSC harbor reduced CFU-F capacity. (A) Presence of CFU-F in BM aspirates at pre-alloSCT (n = 19) and post-alloSCT (n = 26). (B) Proportion of CD146+MNC cells in the CD45-/HLA-DR- BM-MNC–fraction in BM aspirates of 16 patients pre- and post-alloSCT. (C) Summary of 14 patients with CD146+CFU-Fs presence, mean of CFU-Fs per 1000 sorted CD146+BM-MNC and median of CFU-Fs.

Native post-alloSCT CD146+MSC show similar differential expression for proliferation regulating genes as CFU-F-derived MSC. RNAseq analysis was performed in native CD146+MNC derived before and after alloSCT from 4 patients. (A) Heatmaps of total differentially expressed genes (rows) in CD146+/CD45–/HLA-DR– MNC pre- and post-alloSCT (columns). (B) Authentication of DGE in post- vs pre-alloSCT MSC according to the MSC phenotype, ie, post-alloSCT CFU-F–derived MSC from patients 1 to 5 and post-alloSCT CD146+MNC from patients 8 to 10 and 14. (C) Enriched gene sets of 67 common downregulated genes from (B) in CD146+MSC post-alloSCT vs CD146+MSC pre-alloSCT. (D) Selected significantly downregulated genes in the native CD146+MNC (complete list of 67 downregulated genes in supplemental Table 2).
Native post-alloSCT CD146+MSC show similar differential expression for proliferation regulating genes as CFU-F-derived MSC. RNAseq analysis was performed in native CD146+MNC derived before and after alloSCT from 4 patients. (A) Heatmaps of total differentially expressed genes (rows) in CD146+/CD45–/HLA-DR– MNC pre- and post-alloSCT (columns). (B) Authentication of DGE in post- vs pre-alloSCT MSC according to the MSC phenotype, ie, post-alloSCT CFU-F–derived MSC from patients 1 to 5 and post-alloSCT CD146+MNC from patients 8 to 10 and 14. (C) Enriched gene sets of 67 common downregulated genes from (B) in CD146+MSC post-alloSCT vs CD146+MSC pre-alloSCT. (D) Selected significantly downregulated genes in the native CD146+MNC (complete list of 67 downregulated genes in supplemental Table 2).
Because MSC reportedly support the multipotential differentiation of HSCs,17,18 we analyzed the impact of CD146+MSC on the differentiation of human cord blood (CB) CD34+ cells in direct coculture experiments. Pre- and post-alloSCT–derived CD146+MSC similarly promoted expansion of the hematopoietic cells (Figure 4D). During culture, the fraction of CD34+ cells declined irrespective of the presence of MSC. However, in the presence of MSC the number of CD34–/CD45RA+ ie, lymphoid precursor (LP) and myeloid precursor cells was increased compared with those in culture without MSC regardless of prior alloSCT (Figure 4F). Pre- and post-alloSCT CD146+MSC similarly delayed the loss of differentiation potential in hematopoietic progenitor cells (Figure 4E). Moreover, distribution of HSC, multipotent progenitors, granulocyte-macrophage progenitors, lympho-myeloid–primed progenitors and multilymphoid progenitors was similar for cocultures with pre- and post-alloSCT CD146+MSC.
Taken together, the fraction of CD146+/CD45-/HLA-DR-–MNC contains MSC irrespective of prior alloSCT and the ability of CD146+MSC to support hematopoietic progenitors is unaffected in alloSCT.
CD146+MSC are present at similar levels in pre- and post-alloSCT BM but show reduced CFU-F capacity
Our data show that the CD146+/CD45–/HLA-DR– fraction of BM-MNC contains the entire CFU-F capacity and yields CD146+MSC. This led to the question whether the observed reduced CFU-F presence in post-alloSCT BM aspirates is because of a reduced number of CD146+MSC in post-alloSCT BM or because of their reduced proliferation.
As for the CFU-F–derived MSC (Figure 1B) we observed a reduced presence of CFU-F in FACS-sorted CD146+/CD45–/HLA-DR– samples post-alloSCT compared with that in pre-alloSCT samples (Figure 5A).
In paired samples from 16 patients the median proportion of CD146+ cells in CD45-/HLA-DR–-BM–MNC was only slightly reduced at post-alloSCT compared with that at pre-alloSCT (Figure 5B). Moreover, when CFU-F were present in sorted CD146+/CD45–/HLA-DR– cells the number of CFU-F per sample were similar in paired samples before and after alloSCT (Figure 5C). Altogether, this suggests that the reduced chance to isolate CFU-F from post-alloSCT CD146+/CD45–/HLA-DR– is because of a reduced proliferation capacity in CD146+ MSC.
In accordance with this, sorted CD146+MSC cells from post-alloSCT samples showed reduced proliferation upon in vitro culturing (supplemental Figure 2C-D) similar as seen for CFU-F isolated MSC (Figure 2A; supplemental Figure 1B) and again independently of the duration of cryopreservation of the original BM-MNC sample (supplemental Figure 2E).
Thus, although CD146+MSC are present at similar levels in pre- and post-alloSCT BM their ability to generate CFU-F is reduced as seen for CFU-F–derived MSC after alloSCT.
Native CD146+MSC show similar alteration in expression of proliferation-regulating genes after alloSCT as CFU-F–derived MSC
Finally, we analyzed whether the impaired proliferation of native CD146+MSC after alloSCT correlates with a DGE for proliferation-regulating genes as seen for CFU-F–derived MSC.
We performed bulk RNAseq of paired noncultured CD146+MSC derived from 4 patients before and after alloSCT. Unbiased analysis of DGE revealed 88 and 2634 upregulated and downregulated genes, respectively (log2 fold-change >0.58 and <–0.58, respectively; adjusted P value < .05) (Figure 6A). However, the observed interindividual heterogeneity was high presumably resulting primarily from the low cell number input (mean 1356 ± 573 cells per sample).
On the basis of our data in CFU-F–derived MSC we reasoned that the DGE reflects an alloSCT-related damage to the native CD146+MSC. Therefore, we biased our biostatistical analysis in native CD146+MSC on those genes for which we had seen a DGE in CFU-F–derived MSC. Here, we observed only few overlaps in genes differentially expressed in both, post-alloSCT CD146+MSC and post-alloSCT CFU-F–derived MSC compared with those expressed in their respective paired pre-alloSCT samples. Only 3 genes were commonly upregulated and 67 genes commonly downregulated (Figure 6B; supplemental Tables 2 and 3).
GSEA for these common downregulated genes however, again revealed a significantly reduced expression of proliferation related genes in native CD146+MSC (Figure 6C). Among the downregulated genes were cell cycle and apoptosis regulating genes (Figure 6D; supplemental Table 2).
Therefore, our data show that the reduced presence of CFU-F in post-alloSCT BM is related to an alloSCT-related damage of the proliferation capacity of BM-MSC. This damage affects clinical outcome, particularly associated with engraftment of allogeneic hematopoiesis. This suggests that the alloSCT-inferred damage suppresses the capacity of BM-MSC to repopulate the BM-stroma leading to a dysfunctional BM niche (Figure 7).

Summary. Our data show that alloSCT confers a downregulation of proliferation regulating genes and an increased expression in EMT- and ECM-genes in BM-MSC resulting in reduced ex vivo proliferation capacity. As this correlates with survival of patients and specifically with impaired engraftment of allogeneic hematopoiesis, we hypothesize that regeneration of the BM niche requires MSC proliferation to facilitate full hematopoietic recovery.
Summary. Our data show that alloSCT confers a downregulation of proliferation regulating genes and an increased expression in EMT- and ECM-genes in BM-MSC resulting in reduced ex vivo proliferation capacity. As this correlates with survival of patients and specifically with impaired engraftment of allogeneic hematopoiesis, we hypothesize that regeneration of the BM niche requires MSC proliferation to facilitate full hematopoietic recovery.
Discussion
To the best of our knowledge, here we present the first detailed analysis on alloSCT-inferred damage to human BM-MSC in a large cohort of individuals. Our data from >600 individuals show a reduced presence of CFU-F capacity which is associated with reduced survival and poor engraftment of allogeneic hematopoiesis. Analysis of CFU-F–derived MSC as well as of native CD146+MSC demonstrate that the reduced CFU-F presence is associated with an alloSCT-inferred impaired proliferation capacity in BM-MSC. This suggests that proliferation of BM-MSC is required to reconstitute the BM niche after alloSCT.
In our cohort, alloSCT almost doubled the proportion of patients in whom no CFU-F were present in BM aspirates. This association was verified through multivariate analysis and thus, strongly indicates a damage to BM-MSC inferred by alloSCT. Interestingly, other variables associated with reduced CFU-F presence were gender and autologous SCT but not previous chemotherapy. This argues for an alloSCT-specific damage and is in accordance with a reported reduced presence of CFU-F in BM-MNC after alloSCT.19
Our data further demonstrate that alloSCT-related damage to MSC is specifically associated with reduced engraftment of allogeneic hematopoiesis and reduced survival of patients. Our study focused on the effect of alloSCT-related damage to BM-MSC and not on the specific cause of that damage. We, therefore, refrained from including CFU-F presence in multivariate alloSCT-outcome analysis because factors with proven impact on outcome, such as conditioning intensity, may share a causal relationship with MSC damage. However, the increased frequency of CFU-F isolation failure in patients with impaired engraftment and with persistent recipient chimerism in our study strongly suggests that alloSCT-related BM-MSC damage affects the clinical outcome of alloSCT. Data from the study conducted by Abbuehl et al supported this finding, which demonstrated an irradiation-related damage of BM-MSC affecting SCT outcome in a murine model.15 Indirect evidence for this conclusion is also derived from the reported improved engraftment of hematopoiesis upon cotransplantation of MSC in human alloSCT.20
Our further analysis revealed that after alloSCT, not only the in vitro proliferation of MSC is reduced but also the expression of proliferation regulating genes is altered. At large, our RNAseq data corresponded to the transcriptomic profile of MSC as shown in other studies.21 However, in post-alloSCT MSC we observed a downregulation of proliferation regulating genes and an upregulation of EMT and ECM genes. This indicates that alloSCT induces a mesenchymal differentiation in human BM-MSC. Such a shift with loss of proliferation capacity and acquisition of a mature fibroblast phenotype has been described for MSC upon cytotoxic damage in other settings22 as well as in myeloid neoplasia.23
With post-alloSCT MSC we observed a reduced release of distinct cytokines upon contact with hematopoietic cells, whereas their effect on mitogen-stimulated proliferation of PBMNC was unaltered. This is in accordance with a robust immune-regulatory potential of MSC24 and supported our hypothesis that alloSCT specifically alters the proliferative potential of MSC.
Analysis of CFU-F–derived MSC gives only limited insight into the damage of BM-MSC, because it does not cover samples from which no CFU-F could be isolated. Moreover, analysis of CFU-F–derived MSC is biased owing to the required in vitro expansion, which has been shown to affect the characteristics and transcriptome of MSC.25 We, therefore, analyzed native CD146+MSC. The stringency of our isolation protocol is in accordance with other reports,7,26 thus strongly reducing the heterogeneity of MSC populations derived through plastic adherence.27 Our data contrast other reports that observed CFU-F formation from CD146– BM cells as well.8 On the basis of our data the presence of few donor cells in the CD146+CD45–HLA-DR– population could not be entirely excluded but their possible stromal origin is highly speculative.
In our analysis, the frequency of CD146+MSC in the human BM was not substantially decreased after alloSCT. In contrast, their ability to grow as CFU-F was similarly reduced as seen for CFU-F–derived MSC. This suggests that alloSCT does not primarily affect the presence of CD146+MSC in the BM rather their proliferation does. Conclusiveness of our data is limited because we did not investigate MSC presence in BM in situ but our results are in line with the observation that MSC can be isolated from BM trephine samples from patients after alloSCT at similar levels as from healthy controls.19 It also corresponds to our previous study which demonstrated a resistance of MSC against cyto and genotoxic damages.13
These observations argue for a reduced capacity of MSC to proliferate after alloSCT. Our data from native, noncultured CD146+MSC supported this, in which we observed similar alterations of proliferation-regulating genes as in CFU-F–derived MSC. This also affected genes, such as CDK1, for which we had previously shown a role in cell cycle arrest upon genotoxic damage in MSC.16 Interestingly, for the affected BIRC5 (survivin) a role in MSC-mediated support of hematopoiesis has been reported.28 Given the low frequency of CD146+CD45–HLA-DR– cells all observations in this population are prone to bias through inaccuracy of the FACS procedure. Therefore, validation of our observations with further studies in native CD146+ MSC is needed.
A putative impaired proliferation capacity of MSC in association with an impaired hematopoietic engraftment argues for a needed proliferation of MSC in human BM after alloSCT to provide sufficient hematopoietic support. In our study, we did not examine MSC proliferation in situ, but data from murine as well as human models supported our hypothesis, which indicate that under certain conditions, MSC can repopulate bone structures.29,30 We see the most fitting interpretation of our data in an alloSCT-mediated reduction in MSC proliferation capacity which results in impairment of the ability to restore the BM niche under ongoing post-alloSCT toxicity, such as infections or GvHD and eventually leading to clinically relevant impaired long-term engraftment (Figure 7).
Our data also tentatively suggest that reduced proliferation capacity of MSC may be associated with relapse risk of myeloid neoplasia after alloSCT. This is in line with reported perturbed proliferation of MSC in the BM of patients with myelodysplastic syndrome, AML,31 and myelofibrosis23 as well as the reduced chance to isolate BM-MSC from patients with AML.32 Although speculative, we hypothesize that the observed lasting BM niche damage may result in an impaired graft-versus-leukemia activity.
Taken together, our study shows that alloSCT confers a reduced proliferation capacity and mature fibroblast phenotype in BM-MSC associated with impaired clinical outcome and engraftment. It suggests that outcome of alloSCT depends on MSC-driven regeneration of the BM niche.
Acknowledgments
This study was supported by research funding from Deutsche Krebshilfe 70112557 (L.P.M.) and 70112974 (C.M.-T.).
Authorship
Contribution: C.K., C.M.-T., and L.P.M. designed the research; C.K. and K.N. performed experiments; C.K., C.B., K.L., and J.S. analyzed the data; E.W., M.J., A.-K.M., and C.R. performed bioinformatics analyses; L.P.M. and C.M.-T. supervised the work; and C.K., J.S., J.L., M.B., E.W., C.M.-T., and L.P.M. wrote the manuscript.
Conflict-of-interest disclosure: The authors declare no competing financial interests.
Correspondence: Lutz P. Müller, Universitätsklinik und Poliklinik für Innere Medizin IV, Universitätsklinikum Halle, Halle (Saale), Germany, Ernst-Grube-Str. 40, D-06120 Halle; e-mail: lutz.mueller@uk-halle.de.

