

Key Points
Pretreatment factors predicting grade 4 bleeding were consistent with DIC-like coagulopathy, including prolonged PT-INR and low platelets.
The grade 4 bleeding score was externally validated and allows for preventive studies to improve early mortality in high-risk patients.

Abstract
Bleeding in patients with acute myeloid leukemia (AML) receiving intensive induction chemotherapy is multifactorial and contributes to early death. We sought to define the incidence and risk factors of grade 4 bleeding to support strategies for risk mitigation. Bleeding events were retrospectively assessed between day-14 and day +60 of induction treatment according to the World Health Organization (WHO) bleeding assessment scale, which includes grade 4 bleeding as fatal, life-threatening, retinal with visual impairment, or involving the central nervous system. Predictors were considered pretreatment or prior to grade 4 bleeding. Using multivariable competing-risk regression analysis with grade 4 bleeding as the primary outcome, we identified risk factors in the development cohort (n = 341), which were tested in an independent cohort (n = 143). Grade 4 bleeding occurred in 5.9% and 9.8% of patients in the development and validation cohort, respectively. Risk factors that were independently associated with grade 4 bleeding included baseline platelet count ≤40 × 109/L compared with >40 × 109/L, and baseline international normalized ratio of prothrombin time (PT-INR) >1.5 or 1.3 > 1.5 compared with ≤1.3. These variables were allocated points, which allowed for stratification of patients with low- and high-risk for grade 4 bleeding. Cumulative incidence of grade 4 bleeding at day+60 was significantly higher among patients with high- vs low-risk (development: 31 ± 7% vs 2 ± 1%; P < .001; validation: 25 ± 9% vs 7 ± 2%; P = .008). In both cohorts, high bleeding risk was associated with disseminated intravascular coagulation (DIC) and proliferative disease. We developed and validated a simple risk model for grade 4 bleeding, which enables the development of rational risk mitigation strategies to improve early mortality of intensive induction treatment.
Introduction
Bleeding is a major cause of early morbidity and mortality in patients with acute myeloid leukemia (AML) treated with intensive chemotherapy.1,2 Despite monitored, hospital-based treatment and standardized thresholds for prophylactic transfusions, cooperative group trials have reported Common Terminology Criteria for Adverse Events grade 3 to 5 bleeding in 2% to 8% of AML patients.3-6 Prospective identification of patients at increased risk for high-grade bleeding could improve overall treatment outcomes through the development of focused preventive strategies.
Widely used predictive models have enabled the improved definition of overall induction fitness but do not predict cause-specific outcomes or justify specific strategies for risk mitigation.7-9 Bleeding represents a particular challenge due to the multifactorial and dynamic nature of risk. Various factors have been associated with the risk of high-grade bleeding, specifically in leukemia patients, including severe thrombocytopenia, reduced platelet function, abnormal coagulation parameters, hyperleukocytosis, older age, and female sex, but these were identified in mixed disease cohorts, including patients with acute promyelocytic leukemia (APL) and other myeloid malignancies, or focused on bleeding in specific sites, such as the central nervous system (CNS).10-13 Risk factors for overall life-threatening and disabling bleeding events in newly diagnosed, non-APL AML patients receiving initial treatment with intensive chemotherapy have not been specifically studied.
We, therefore, used a consecutive cohort of adults with (non-APL) AML treated with intensive anthracycline-based chemotherapy to determine which pretreatment clinical, laboratory, and genetic factors were associated with the development of life-threatening and disabling (grade 4) bleeding according to the World Health Organization (WHO) bleeding assessment scale. In order to enable prospective identification of the subset of AML patients in whom enhanced monitoring and supportive care should be focused, we developed a grade 4 bleeding prediction score and tested it in an independent validation cohort.
Methods
Patients
Development cohort.
A total of 341 consecutive adult patients (≥18 years of age) with newly diagnosed non-APL AML who received initial treatment with intensive induction chemotherapy between August 2014 and March 2020 were included in the development cohort (Dana-Farber/Brigham and Women’s Cancer Center, Boston, MA). Patients who did not receive intensive induction treatment, received previous treatment of AML (excluding hydroxyurea or all-trans retinoic acid), or were previously transplanted with an allogeneic donor for myelodysplastic syndrome or myeloproliferative neoplasm were excluded. Among patients aged 18 to 75 years who were not treated with intensive chemotherapy, reasons for refraining from intensive treatment included patient’s wish (n = 12), poor performance status (n = 11), comorbidities (n = 10), TP53 mutations (n = 4), or other reasons (n = 4). No patients were found to be ineligible for intensive chemotherapy because of any grade of bleeding.
Gene mutations in blood or bone marrow (BM) specimens were determined at the time of diagnosis using clinical targeted next-generation sequencing of genes recurrently mutated in AML.14 Variants were interpreted for pathogenicity as previously described.15-17 Most patients (n = 310 [90.9%]) were treated with an anthracycline (daunorubicin or idarubicin) and cytarabine for 3 and 7 days (“3 + 7”), respectively. The remaining patients (n = 31 [9.1%]) received cytarabine and daunorubicin in a liposomal formulation (CPX-351). Additional drugs were given to 76 (22.3%) patients, which mostly consisted of FLT3, BCL-2, or IDH1/2 inhibitors.
Validation cohort.
This cohort consisted of 143 nonconsecutive adult patients with newly diagnosed non-APL AML who were treated between 2008 and 2020 with intensive induction chemotherapy and had complete genetic data available (Roswell Park Comprehensive Cancer Center, Buffalo, NY). Similar inclusion and exclusion criteria were applied to the validation cohort. Chemotherapy, according to the “3 + 7” regimen, was administered to all patients, of whom 44 (30.8%) received an agent added to the backbone, mostly including etoposide and gemtuzumab ozogamicin. Gene mutations in blood or BM specimens obtained at the time of diagnosis were determined using targeted next-generation sequencing of genes recurrently mutated in AML, as described.16
Both cohorts used similar guidelines for supportive care, with prophylactic transfusion of red blood cell (RBC) units, platelets, cryoprecipitate, and fresh-frozen plasma typically given for hematocrit <0.24 L/L, platelets <10 × 109/L, fibrinogen <100 mg/dL, and international normalized ratio (INR) ≥2.0, respectively. Pathogen-reduced plateletpheresis units were only infrequently used in the validation cohort from 2011. This study was conducted with the approval of the institutional review boards of both centers (Dana-Farber Cancer Institute and Roswell Park Comprehensive Cancer Center) and was conducted in accordance with the Declaration of Helsinki.
Clinical data
Bleeding location and grade were retrospectively assessed by one reviewer in each center according to the WHO bleeding assessment scale,18 where grade 4 bleeding was defined based on the presence of one of the following clinical criteria: (1) bleeding with severe hemodynamic instability requiring RBC transfusion over routine transfusion needs; (2) fatal bleeding; (3) retinal bleeding with visual impairment; or (4) CNS bleeding with or without neurologic dysfunction.18 Bleeding events that occurred between day-14 and day+60 of induction treatment were included to assess early bleeding in newly diagnosed AML patients.
Pretreatment data were collected for all patients (Table 1), as well as data throughout the duration of induction and follow-up status after induction. Karyotypes were classified based on the European LeukemiaNet (ELN) 2017 risk classification.19 Study-specific data abstraction of individual patient charts included date of bleeding, location and grade of bleeding, and thrombotic events. Laboratory values for creatinine, albumin, total bilirubin, lactate dehydrogenase (LDH), white blood cell (WBC) count, hemoglobin (Hb), platelet count, international normalized ratio of prothrombin time (PT-INR), partial thromboplastin time (PTT), D-dimer, and fibrinogen were obtained from the first day of induction chemotherapy or prior to grade 4 bleeding if the bleeding event occurred before the start of treatment. Median times from the start of induction therapy to complete blood count and coagulation laboratory measurements were 0 days (range, 0 to 2) and 3 days (range, 0 to 7), respectively, in the development cohort.
Baseline characteristics development and validation cohort
| n | Development cohort (n = 341), n (%) | n | Validation cohort (n = 143), n (%) | P value* | |
|---|---|---|---|---|---|
| Age (years), median (range) | 341 | 61 (19-76) | 143 | 64 (20-85) | .001 |
| Sex | 341 | 143 | .132 | ||
| Male | 183 (54) | 88 (62) | |||
| Female | 158 (46) | 55 (38) | |||
| ELN2017 cytogenetic risk group | 337 | 140 | .002 | ||
| Favorable | 40 (12) | 13 (9) | |||
| Intermediate | 233 (68) | 79 (56) | |||
| Adverse | 64 (19) | 48 (34) | |||
| Somatic mutations, presence | 341 | 143 | |||
| NPM1 | 91 (27) | 25 (17) | .035 | ||
| DNMT3A | 74 (22) | 23 (16) | .173 | ||
| NRAS | 61 (18) | 24 (17) | .896 | ||
| RUNX1 | 52 (15) | 30 (21) | .144 | ||
| TET2 | 53 (16) | 20 (14) | .781 | ||
| ASXL1 | 46 (13) | 25 (17) | .262 | ||
| FLT3-ITD | 51 (15) | 20 (14) | .888 | ||
| IDH2 | 39 (11) | 22 (15) | .233 | ||
| SRSF2 | 37 (11) | 23 (16) | .130 | ||
| IDH1 | 40 (12) | 13 (9) | .430 | ||
| TP53 | 23 (7) | 26 (18) | <.001 | ||
| FLT3-TKD | 32 (9) | 17 (12) | .412 | ||
| Complete blood count, median (IQR) | |||||
| Hemoglobin, g/dL | 341 | 8.6 (8.0-9.2) | 143 | 8.7 (7.9-9.9) | .469 |
| Platelets, × 109/L | 341 | 49 (30-91) | 143 | 61 (40-106) | .019 |
| WBC, × 109/L | 341 | 6.5 (2.4-22.1) | 143 | 10.4 (2.1-39.3) | .040 |
| Coagulation, median (IQR) | |||||
| PT-INR | 339 | 1.2 (1.1-1.3) | 143 | 1.2 (1.1-1.4) | .163 |
| PTT, sec | 318 | 33.0 (30.0-37.6) | 123 | 31.1 (28.2-35.1) | .004 |
| Fibrinogen, mg/dL | 322 | 374 (297-464) | 125 | 416 (324-553) | .010 |
| D-dimer, ng/mL FEU | 117 | 1893 (890->4000) | 105 | 1670 (765-4480) | .603 |
| Chemistry, median (IQR) | |||||
| Creatinine, mg/dL | 340 | 0.81 (0.67-0.97) | 143 | 0.93 (0.78-1.16) | <.001 |
| Albumin, g/dL | 323 | 3.6 (3.2-3.9) | 143 | 3.4 (3.1-3.9) | .397 |
| Bilirubin, mg/dL | 324 | 0.5 (0.3-0.7) | 143 | 0.6 (0.4-1.0) | <.001 |
| LDH, U/L† | 322 | 335 (213-588) | 143 | 902 (595-2063) | .445 |
| ISTH-DIC score, median (IQR) | 115 | 4 (3-5) | 105 | 4 (3-4) | .007 |
| ≥5 points | 76 (66) | 82 (78) | .052 | ||
| <5 points | 39 (34) | 23 (22) | |||
ELN, European LeukemiaNET; IQR, interquartile range; LDH, lactate dehydrogenase.
Comparisons were adjusted to the upper limit of normal where appropriate.
The upper limit of normal for LDH was 225 U/L in the development cohort and 618 U/L in the validation cohort.
Fibrinogen is measured using the Clauss method (g/L) in both cohorts. The quantitative immunoturbidimetric method was used to assess D-dimer and was reported as fibrinogen equivalent units (FEU [ng/mL]) in the development cohort. The validation center has used a latex and lyophilized-based assay, which reported in FEU ng/mL from June 2006 until June 2015, ng/mL D-dimer units (DDU) until June 2018, and ng/mL FEU until the inclusion of the last patient. Upper limits of normal were 500 ng/mL FEU at both sites, and 232 ng/mL DDU at the validation center, with upper limits of reportable in development and validation center of >4000 ng/mL FEU and >20 000 ng/mL FEU, respectively. DDU was converted to FEU using a conversion factor 2. PTT upper limits of normal were 35 and 36 seconds in the development and validation cohort, respectively. Platelets were measured using the Sysmex XN9100, and PT-INR was measured using the Stago STA R Max with STA-Neoplastine CI Plus reagents in the development cohort. The validation site measured PT-INR using the Diagnostica Stago STA Compact with STA Neoplastine CI plus reagents between 2006 and 2015 and the Werfen/IL ACL TOP 300 using Recomplastin reagents between 2015 and 2021.
Statistical analysis
Cumulative incidence of grade 4 bleeding was estimated using the Fine and Gray20 method, with death without grade 4 bleeding being treated as a competing event. Survival over the first 60 days of induction treatment was calculated with bleeding events as a time-dependent covariate stratified by cohort. No patients were lost to follow-up within the first 60 days of induction treatment. Comparisons between the 2 groups were performed using the Mann-Whitney U test for continuous variables, whereas Fisher’s exact test was used for categorical variables.
Model development and validation.
The grade 4 bleeding score was derived from the development cohort. The following variables were considered for the development of the predictive model: age (≥60 vs <60 years), sex (female vs male), history of venous thromboembolism (yes vs no), Hb (≥10 vs <10 g/dL), platelet count (>40 vs ≤40 × 109/L), WBC count (≥25 vs <25 × 109/L), PT-INR (1.3 > 1.5 or >1.5 vs ≤1.3), PTT (≥35 vs <35 seconds), fibrinogen (≥200 vs <200 mg/dL), D-dimer (>4000 vs ≤4000 ng/mL FEU), creatinine (≥1.5 vs <1.5 mg/dL), albumin (<3 vs ≥3 g/dL), total bilirubin (>1.2 vs ≤1.2 mg/dL), LDH (≥2 vs <2× upper limit of normal), ELN2017 cytogenetic risk classification (intermediate or adverse vs favorable), and gene mutations (presence vs absence) found in ≥10 patients (ie, NPM1, DNMT3A, NRAS, TET2, RUNX1, FLT3-ITD, ASXL1, IDH1, IDH2, SRSF2, PTPN11, FLT3-TKD, WT1, BCOR, TP53, KRAS, STAG2, U2AF1, CEBPA, CBL, SF3B1, GATA2, PHF6, KIT, and JAK2). Cutoffs of laboratory values were based on available literature (eg, PT-INR),21,22 internal consensus (eg, Hb), or recursive partitioning for the prediction of the event of interest (eg, platelet count). Competing-risk regression analysis according to Fine and Gray20 was used to assess variables associated with grade 4 bleeding events. Variables with a significance of P < .10 in the univariate setting were subsequently included in the multivariable model. Forward selection was performed, adding variables with P < .10 and removing those with P ≥ .20, resulting in the final model. Next, integer weights were derived from the coefficients of the independent predictors, which defined the bleeding score. Recursive partitioning was used for defining the optimal cut point of scores resulting in high- and low-risk subgroups. This model was then applied to the external validation cohort using competing-risk regression analysis. P values were not adjusted for multiple testing. Analyses were performed with STATA software (Release 16.1; STATA Corporation, College Station, TX) and R (version 3.6.3).
Results
Bleeding events
The incidence of grade 4 bleeding was 5.9% (n = 20) in the development cohort and 9.8% (n = 14) in the validation cohort (Figure 1), which were not significantly different (P = .123). Detailed characteristics of patients with grade 4 bleeding are listed in Table 2. Median time from the start of induction to all grade 4 bleeding events was 13 (interquartile range [IQR], 2-17) and 14 (IQR, 7-28) days in the development and validation cohort, respectively, whereas median pretreatment or prebleeding platelet counts were 31 (IQR, 22-41) and 54 (IQR, 28-100) × 109/L in the respective cohorts. The CNS was involved in 85.0% (n = 17) and 78.6% (n = 11) of patients with grade 4 bleeding complications in the development and validation cohorts, respectively. Five patients in the development cohort received ongoing anticoagulation therapy, of whom 1 developed a grade 4 bleeding event. One additional patient received therapeutic anticoagulation therapy because of thrombosis and developed a grade 4 bleeding. In the validation cohort, 1 patient was receiving therapeutic anticoagulation therapy at the time of grade 4 bleeding. The incidence of grade 4 bleeding was not significantly different between patients receiving “3 + 7” vs CPX-351 (5.5% vs 9.7%, respectively; P = .343) in the development cohort. Additionally, no difference of grade 4 bleeding was observed between patients receiving daunorubicin 45 to 60 mg/m2 compared with 90 mg/m2 (incidence 3.7% vs 10.4%; P = .107). Patients with grade 4 bleeding events had worse survival during the 60 days after the start of induction treatment compared with patients without grade 4 bleeding stratified by cohort (hazard ratio [HR], 8.12; 95% confidence interval [CI], 4.22-15.62; P < .001). Grade 2 to 3 bleeding was not associated with early mortality in both development and validation cohorts (HR, 1.87; 95% CI, 0.71-4.91; P = .21; and HR, 1.13; 95% CI, 0.39-3.27; P = .82, respectively).
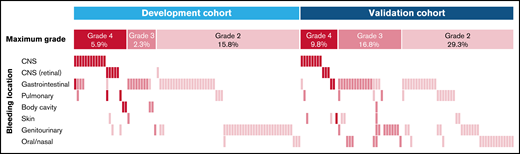
Bleeding events WHO grade 2 and higher in the development and validation cohorts. This plot shows bleeding events by location, as labeled on the left. Bleeding events are depicted by the colored bars, and each column represents 1 of the 168 patients with a WHO grade 2 bleeding or higher. Colors reflect the bleeding grade, as labeled on the top.
Bleeding events WHO grade 2 and higher in the development and validation cohorts. This plot shows bleeding events by location, as labeled on the left. Bleeding events are depicted by the colored bars, and each column represents 1 of the 168 patients with a WHO grade 2 bleeding or higher. Colors reflect the bleeding grade, as labeled on the top.
Characteristics of patients with grade 4 bleeding
| Cohort | Patient ID | Induction treatment | Age at induction | Sex | WHO bleeding location | Bleeding onset (days) | WBC | Platelets | PT-INR | PTT | D-dimer | ISTH-DIC criteria | Grade 4Bleeding risk | ISTH-DIC score | Grade 4 Bleeding score | Total bilirubin | Albumin | LDH* | Alive at day+60 |
|---|---|---|---|---|---|---|---|---|---|---|---|---|---|---|---|---|---|---|---|
| D | 7 | Cytarabine (200) + Daunorubicin (60) | 60 | F | CNS | 9 | 2.6 | 29 | 1.6 | 43.7 | >4000 | Positive | High | 7 | 3 | 0.5 | 2.4 | 1174 | No |
| D | 18 | Cytarabine (200) + Daunorubicin (60) | 68 | M | CNS gastrointestinal | 5 | 166.4 | 79 | 2.2 | 42.1 | High | 2 | 0.6 | 3.1 | 2151 | No | |||
| D | 40 | CPX-351 | 63 | F | CNS (retinal with symptoms) | 19 | 18.2 | 34 | 1.6 | 3786 | Positive | High | 6 | 3 | 1.2 | 3.5 | 684 | Yes | |
| D | 41 | Cytarabine (200) + Daunorubicin (60) | 72 | M | CNS | 3 | 17.4 | 42 | 1.4 | 41.0 | Low | 1 | 0.4 | 3.5 | 467 | Yes | |||
| D | 62 | Cytarabine (200) + Daunorubicin (60) | 56 | F | CNS | 14 | 16.3 | 5 | 1.5 | 34.9 | High | 2 | 1.5 | 2.8 | 1699 | No | |||
| D | 99 | Cytarabine (200) + Daunorubicin (60) | 54 | F | CNS | -14 | 6.4 | 25 | 1.4 | 44.9 | High | 2 | 0.5 | 2.4 | 372 | Yes | |||
| D | 100 | Cytarabine (100) + Daunorubicin (90) | 58 | F | CNS | 17 | 12.9 | 98 | 1.4 | 48.3 | >4000 | Positive | Low | 5 | 1 | 0.6 | 2.8 | 850 | No |
| D | 121 | Cytarabine (100) + Daunorubicin (90) | 55 | F | CNS | 19 | 5.5 | 8 | 1.4 | 63.3 | High | 2 | 0.6 | 3.4 | 803 | Yes | |||
| D | 130 | Cytarabine (100) + Daunorubicin (90) | 45 | F | CNS (retinal with symptoms) | 0 | 37.4 | 10 | 1.6 | 43.5 | >4000 | Positive | High | 7 | 3 | 0.8 | 3.5 | 647 | Yes |
| D | 139 | Cytarabine (200) + Daunorubicin (45) | 27 | M | CNS (retinal with symptoms) pulmonary | -5 | 232.7 | 22 | 1.5 | 36.1 | >4000 | Positive | High | 6 | 3 | 1.4 | 3.0 | 806 | No |
| D | 166 | Cytarabine (100) + Daunorubicin (90) | 23 | F | CNS (retinal with symptoms) | 14 | 12.1 | 33 | 1.5 | 33.0 | 1158 | Positive | High | 5 | 2 | 0.5 | 3.5 | 309 | Yes |
| D | 176 | Cytarabine (200) + Daunorubicin (60) | 61 | M | CNS | 13 | 28.9 | 34 | 1.6 | 61.1 | >4000 | Positive | High | 7 | 3 | 2.2 | 2.7 | 2501 | No |
| D | 190 | Cytarabine (100) + Daunorubicin (90) | 30 | F | CNS | 13 | 16.3 | 21 | 1.5 | 34.7 | >4000 | Positive | High | 6 | 2 | 0.4 | 2.8 | 751 | No |
| D | 195 | Cytarabine (100) + Daunorubicin (90) | 55 | M | CNS (retinal with symptoms) | -4 | 90.9 | 16 | 1.2 | 29.4 | >4000 | Positive | Low | 5 | 1 | 0.8 | 3.7 | 2255 | Yes |
| D | 237 | CPX-351 | 67 | M | CNS | 19 | 1.3 | 192 | 1.2 | 37.0 | Low | 0 | 149 | Yes | |||||
| D | 240 | Cytarabine (200) + Daunorubicin (45) | 54 | M | Body cavity | 60 | 0.8 | 27 | 1.2 | Low | 1 | 0.9 | 3.7 | 163 | Yes | ||||
| D | 251 | Cytarabine (200) + Daunorubicin (60) | 30 | F | CNS | 7 | 30.8 | 40 | 1.1 | 27.2 | Low | 1 | 0.2 | 3.8 | 439 | No | |||
| D | 268 | Cytarabine (200) + Daunorubicin (60) | 56 | M | CNS | 15 | 6.1 | 32 | 1.1 | 37.7 | Low | 1 | 0.4 | 4.4 | 473 | Yes | |||
| D | 280 | Cytarabine (100) + Daunorubicin (90) | 39 | F | Pulmonary | 0 | 38.8 | 28 | 1.7 | 41.5 | High | 3 | 0.5 | 3.5 | 1836 | No | |||
| D | 336 | CPX-351 | 66 | M | Body cavity | 18 | 107.3 | 50 | 2.1 | 47.4 | High | 2 | 0.9 | 2.1 | 588 | No | |||
| V | 10 | 3 + 7 | 22 | M | CNS (retinal with symptoms) | 14 | 19.2 | 147 | 1.1 | 30.6 | 706 | Negative | Low | 2 | 0 | 0.3 | 3.9 | 1066 | Yes |
| V | 26 | 3 + 7 | 55 | F | CNS | 8 | 67.5 | 84 | 1.8 | 25.0 | >20 000† | Positive | High | 6 | 2 | 0.1 | 3.6 | 2338 | Yes |
| V | 30 | 3 + 7 | 40 | M | CNS | -3 | 18.3 | 7 | 2.4 | 28.9 | >20 000† | Positive | High | 7 | 3 | 2.3 | 3.3 | 22084 | Yes |
| V | 58 | 3 + 7 | 55 | M | CNS | 21 | 41.4 | 58 | 1.3 | 30.0 | >20 000† | Positive | Low | 5 | 0 | 0.7 | 3.6 | 4489 | Yes |
| V | 97 | 3 + 7 | 65 | M | CNS | 35 | 109.8 | 156 | 1.1 | 27.5 | 1720 | Negative | Low | 2 | 0 | 0.5 | 4.8 | 2063 | Yes |
| V | 117 | 3 + 7 | 68 | F | Musculoskeletal | 47 | 166.4 | 47 | 1.6 | 51.8 | High | 2 | 0.6 | 3.4 | 2502 | No | |||
| V | 121 | 3 + 7 | 69 | M | CNS | 25 | 41.6 | 24 | 1.4 | 34.3 | High | 2 | 1.2 | 2.7 | 1135 | No | |||
| V | 124 | 3 + 7 | 79 | M | Gastrointestinal | 48 | 56.2 | 40 | 1.1 | 35.8 | 2370 | Negative | Low | 4 | 1 | 0.6 | 3.0 | 754 | Yes |
| V | 127 | 3 + 7 | 69 | F | CNS | 11 | 12.2 | 49 | 1.9 | 45.1 | >20 000 | Positive | High | 8 | 2 | 0.6 | 4.4 | 13927 | Yes |
| V | 130 | 3 + 7 | 67 | M | CNS (retinal with symptoms) | 4 | 0.6 | 23 | 1.4 | 43.4 | 1960 | Positive | High | 5 | 2 | 1.3 | 2.9 | 988 | Yes |
| V | 135 | 3 + 7 | 69 | F | CNS | -2 | 8.0 | 5 | 1.3 | 35.8 | Low | 1 | 1.0 | 3.3 | 842 | No | |||
| V | 142 | 3 + 7 | 67 | F | Gastrointestinal | 6 | 23.0 | 321 | 1.2 | 33.7 | Low | 0 | 0.4 | 2.9 | 675 | Yes | |||
| V | 148 | 3 + 7 | 68 | M | CNS (retinal with symptoms) | 13 | 0.8 | 105 | 1.1 | 36.8 | 2350 | Negative | Low | 2 | 0 | 0.5 | 3.8 | 342 | Yes |
| V | 160 | 3 + 7 | 74 | F | CNS | 29 | 6.2 | 66 | 1.2 | 49.5 | 3830 | Negative | Low | 4 | 1 | 1.2 | 3.6 | 1359 | Yes |
| Summary statistics per cohort | |||||||||||||||||||
| Median | % M | % CNS | Median | Median | Median | Median | Median | Median | Median | Median | Median | % Alive | |||||||
| D | 55 | 45 | 85 | 13 | 16.9 | 31 | 1.5 | 41.3 | 2472 | 0.6 | 3.4 | * | 50 | ||||||
| V | 68 | 57 | 79 | 14 | 21.1 | 54 | 1.3 | 35.1 | 2155 | 0.6 | 3.5 | * | 79 | ||||||
D, development; V, validation.
The upper limit of normal for LDH was 225 U/L in the development cohort and 618 U/L in the validation cohort.
Measured in D-dimer units (DDU); reported values are converted from DDU to Fibrogen equivalent units (DDU × 2).
Bleeding score
Model development.
A total of 10 variables were associated with grade 4 bleeding events in the development cohort by univariate competing-risk regression analysis and were considered in the multivariable model (Table 3). Two patients were excluded from the final model because of missing data. Pretreatment or prebleeding platelet count of ≤40 × 109/L and PT-INR of 1.3 > 1.5 and >1.5 were the only independent factors associated with grade 4 bleeding events (Table 3). These individual parameters were associated with an increased cumulative incidence of grade 4 bleeding (supplemental Figure 1). The estimated coefficients (1.29, 2.04, and 3.11, respectively) of these predictors were divided by 2 and rounded to the nearest integer, resulting in the grade 4 bleeding score (Figure 2A). The risk score ranges from 0 to 3 points, and the incidence of grade 4 bleeding increased with higher scores (Figure 2B). The cutoff was found to be optimal at >1 point for high-risk patients vs ≤1 point for low-risk patients. Using this score, 42 (12.3%) patients were considered high risk for grade 4 bleeding in the development cohort, whereas 297 (87.1%) patients had low risk (Figure 2B). The cumulative incidence of grade 4 bleeding at day+60 was higher among patients in the high-risk subgroup compared with those in the low-risk subgroup (31 ± 7% vs 2 ± 1%; P < .001) (Figure 2C). The sensitivity and specificity of the model for the prediction of grade 4 bleeding were 31.0% and 97.6%, respectively. WHO grade 2 or 3 bleeding events were most frequently observed in gastrointestinal (n = 34 [10.0%]) and genitourinary (n = 31 [9.1%]) sites (Figure 1) and, as expected, were not predicted by the bleeding score (subdistribution hazard ratio [SHR], 1.02; 95% CI, 0.49-2.16; P = .947). Seven patients who experienced grade 4 bleeding events had a low pretreatment bleeding score. Four developed laboratory evidence of disseminated intravascular coagulation (DIC)-like coagulopathy after the start of treatment, 2 had mechanical/procedural-related bleeding, and 1 had concurrent multiorgan failure without DIC.
Fine and Gray competing risk regression analysis for development of bleeding score
| Univariate | Multivariable | ||||||
|---|---|---|---|---|---|---|---|
| Risk factor | SHR | 95% CI | P value | SHR | 95% CI | P value | |
| PT-INR | (>1.3-1.5 vs ≤1.3) | 8.49 | 2.80-25.79 | <.001 | 7.72 | 2.53-23.56 | <.001 |
| (>1.5 vs ≤1.3) | 27.78 | 8.97-86.06 | <.001 | 22.46 | 6.92-72.91 | <.001 | |
| LDH | (≥2 vs <2 × ULN) | 6.13 | 2.24-16.78 | <.001 | — | ||
| Platelets | (≤40 vs > 40 × 109/L) | 4.78 | 1.75-13.08 | .002 | 3.63 | 1.31-10.05 | .010 |
| Albumin | (<3 vs ≥3 g/dL) | 4.36 | 1.73-10.95 | .002 | — | ||
| PTT | (≥35 vs <35S) | 4.58 | 1.64-12.80 | .004 | — | ||
| Bilirubin | (>1.2 vs ≤1.2 mg/dL) | 1.97 | 1.07-3.64 | .030 | — | ||
| NRAS | (yes vs no) | 2.59 | 1.04-6.47 | .042 | — | ||
| WBC | (≥25 vs <25 × 109/L) | 2.49 | 1.02-6.09 | .045 | — | ||
| Age | (≥60 vs <60 y) | 0.43 | 0.17-1.06 | .068 | — | ||
| TET2 | (yes vs no) | 2.37 | 0.92-6.08 | .074 | — | ||
SHR, subdistribution hazard ratio; ULN, upper limit of normal.
Different cutoffs for fibrinogen (≥100 vs <100 and ≥150 vs <150 mg/dL) and PTT (≥40 vs <40S) yielded comparable results.

Development and validation of grade 4 bleeding score. (A) Variables and their assigned points of the grade 4 bleeding score result in 2 subgroups of low and high risk for grade 4 bleeding. (B) Frequency of grade 4 bleeding by risk score in the development and validation cohort. The number of patients by bleeding score is shown in the table below. (C) Cumulative incidence of grade 4 bleeding by risk group of the bleeding score, with death considered a competing event. Time is measured from the first day of induction chemotherapy, whereas events occurring in the 14 days prior to the start of induction treatment are counted at day zero.
Development and validation of grade 4 bleeding score. (A) Variables and their assigned points of the grade 4 bleeding score result in 2 subgroups of low and high risk for grade 4 bleeding. (B) Frequency of grade 4 bleeding by risk score in the development and validation cohort. The number of patients by bleeding score is shown in the table below. (C) Cumulative incidence of grade 4 bleeding by risk group of the bleeding score, with death considered a competing event. Time is measured from the first day of induction chemotherapy, whereas events occurring in the 14 days prior to the start of induction treatment are counted at day zero.
Model validation.
Patients in the validation cohort were older than patients in the development cohort (64 vs 61 years; P = .001) and harbored more high-risk AML features, including higher frequency of adverse risk cytogenetics, increased frequency of TP53 mutations, and decreased frequency of NPM1 mutations (Table 1). Additionally, baseline platelet and WBC counts were higher in the validation cohort compared with the development cohort, whereas PT-INR and D-dimer were similarly distributed.
In this cohort, 24 (16.8%) and 119 (83.2%) patients had a high and low risk of grade 4 bleeding, respectively. The bleeding score significantly differentiated patients in the validation cohort with high vs low risk of grade 4 bleeding (cumulative incidence at day+60: 25 ± 9% vs 7 ± 2%, respectively; P = .008) (Figure 2B-C). The sensitivity and specificity for the prediction of grade 4 bleeding in the validation cohort were 25.0% and 93.2%, respectively. We explored the inclusion of D-dimer in this cohort because of higher availability (n = 105 [73.4%]), which did not improve the predictive capacity of the bleeding score (SHR, 1.83; 95% CI, 0.52-6.45; P = .348). As in the development cohort, the bleeding score did not predict grade 2 or 3 bleeding events (SHR, 1.28; 95% CI, 0.65-2.51; P = .481). Eight patients had a low pretreatment bleeding score but experienced grade 4 bleeding events. One patient was persistently hypertensive and developed a CNS bleed, 1 patient had upper gastrointestinal bleeding from a gastric ulcer, 1 had mechanical/procedural-related bleeding, 1 was receiving therapeutic anticoagulation to prevent hepatic veno-occlusive disease, and 1 had sepsis without DIC. No clear clinical context was reported for the other 3 patients with grade 4 bleeding events.
DIC in patients with high bleeding risk
Our results raised the possibility that pretreatment, disease-associated DIC is the biological driver of bleeding risk in AML. Therefore, we evaluated the association between bleeding score and other laboratory hallmarks of DIC that reflect consumption of coagulation factors and hyperfibrinolysis, as well as other clinical manifestations of DIC, including thrombosis (Table 4). The high-risk subgroup had significantly higher median PTT (development 41.6 vs 32.4 seconds; P < .001; validation: 34.3 vs 30.7 seconds; P = .005) and significantly elevated median D-dimer levels (development: >4000 vs 1526 ng/mL FEU; P = .010; validation: 9420 vs 1508 ng/mL FEU; P = .004) compared with the low-risk subgroup. Hypofibrinogenemia of <100 mg/dL was observed in 0.3% and 2.8% in the development and validation cohort, respectively. Median fibrinogen levels were not significantly different between high- vs low-risk patients in the development cohort (370 vs 374 mg/dL, respectively; P = .429), but were lower in the validation cohort (356 vs 433 mg/dL; P = .031). Since not all laboratory hallmarks of overt DIC were found as predictors of grade 4 bleeding, we considered AML patients with a high bleeding score (ie, PT-INR >1.3 and platelet count ≤40 × 109/L) as having DIC-like coagulopathy.
Characteristics of patients with high or low baseline bleeding scores
| Development cohort | Validation cohort | |||||
|---|---|---|---|---|---|---|
| Low (n = 297), n (%) | High (n = 42), n (%) | P value | Low (n = 119), n (%) | High (n = 24), n (%) | P value | |
| Age, years; median (range) | 62 (19-76) | 59 (23-74) | .196 | 63 (20-85) | 67 (37-78) | .202 |
| Sex | .413 | .819 | ||||
| Male | 162 (55) | 20 (48) | 74 (62) | 14 (58) | ||
| Female | 135 (45) | 22 (52) | 45 (38) | 10 (42) | ||
| ELN2017 cytogenetic risk group | .735 | .999 | ||||
| Favorable | 34 (12) | 6 (14) | 11 (9) | 2 (8) | ||
| Intermediate | 204 (70) | 27 (64) | 65 (56) | 14 (58) | ||
| Adverse | 55 (19) | 9 (21) | 40 (34) | 8 (33) | ||
| Somatic mutations, presence | ||||||
| NPM1 | 81 (27) | 9 (21) | .463 | 19 (16) | 6 (25) | .375 |
| DNMT3A | 64 (22) | 9 (21) | .999 | 21 (18) | 2 (8) | .367 |
| NRAS | 50 (17) | 11 (26) | .139 | 18 (15) | 6 (25) | .241 |
| RUNX1 | 49 (16) | 3 (7) | .167 | 26 (22) | 4 (17) | .784 |
| TET2 | 45 (15) | 8 (19) | .500 | 14 (12) | 6 (25) | .107 |
| ASXL1 | 41 (14) | 4 (10) | .627 | 22 (18) | 3 (13) | .768 |
| FLT3-ITD | 44 (15) | 7 (17) | .817 | 16 (13) | 4 (17) | .747 |
| IDH2 | 31 (10) | 7 (17) | .291 | 21 (18) | 1 (4) | .125 |
| SRSF2 | 32 (11) | 5 (12) | .793 | 22 (18) | 1 (4) | .125 |
| IDH1 | 37 (12) | 3 (7) | .445 | 12 (10) | 1 (4) | .696 |
| TP53 | 18 (6) | 5 (12) | .183 | 24 (20) | 2 (8) | .248 |
| FLT3-TKD | 29 (10) | 3 (7) | .781 | 13 (11) | 4 (17) | .488 |
| Complete blood count, median (IQR) | ||||||
| Hemoglobin, g/dL | 8.7 (8.1-9.4) | 8.3 (7.6-8.5) | <.001 | 8.7 (7.8-9.9) | 8.7 (8.2-10.1) | .713 |
| Platelets, ×109/L | 56 (32-98) | 29 (20-35) | <.001 | 65 (45-123) | 36 (26-55) | <.001 |
| WBC, ×109/L | 5.8 (2.3-19.0) | 18.3 (6.4-47.5) | <.001 | 6.6 (2.1-31.0) | 40.4 (15.8-73.0) | <.001 |
| Coagulation, median (IQR) | ||||||
| PT-INR | 1.2 (1.1-1.3) | 1.5 (1.4-1.6) | <.001 | 1.2 (1.1-1.3) | 1.6 (1.5-1.8) | <.001 |
| PTT, sec | 32.4 (29.7-36.5) | 41.6 (34.9-48.4) | <.001 | 30.7 (27.8-34.1) | 34.3 (30.5-43.4) | .005 |
| Fibrinogen, mg/dL | 374 (304-465) | 370 (257-460) | .429 | 430 (330-562) | 356 (146-547) | .031 |
| D-dimer, ng/mL FEU | 1526 (852->4000) | >4000 (2471->4000) | .010 | 1508 (724-3950) | 9420 (1670->20 000) | .004 |
| Chemistry median (IQR) | ||||||
| Creatinine, mg/dL | 0.81 (0.66-0.97) | 0.81 (0.69-1.00) | .656 | 0.90 (0.76-1.10) | 1.13 (0.96-1.49) | .001 |
| Albumin, g/dL | 3.6 (3.3-3.9) | 3.0 (2.6-3.5) | <.001 | 3.5 (3.1-4.0) | 3.2 (2.8-3.5) | .012 |
| Bilirubin, mg/dL | 0.4 (0.3-0.7) | 0.6 (0.4-0.9) | .002 | 0.6 (0.4-1.0) | 0.6 (0.5-1.2) | .763 |
| LDH, U/L | 312 (204-377) | 752 (457-1679) | <.001 | 833 (575-1359) | 2130 (1296-3603) | <.001 |
| ISTH-DIC score, median (IQR)* | 4 (3-4) | 6 (5-6) | <.001 | 3 (2-4) | 6 (5-7) | <.001 |
| Thrombosis | .002 | .052 | ||||
| None | 264 (89) | 30 (71) | 110 (92) | 19 (79) | ||
| Catheter-associated | 23 (8) | 6 (14) | 6 (5) | 2 (8) | ||
| Noncatheter-associated | 10 (3) | 6 (14) | 3 (3) | 3 (13) | ||
Calculated for patients with available platelet count, PT-INR, fibrinogen, and D-dimer.
Since DIC has also been linked to thrombosis in AML patients,23 we analyzed the association of bleeding score with thrombosis during treatment. Noncatheter-associated thrombotic events within the first 60 days of induction treatment were observed in 4.7% (n = 16) and 4.2% (n = 6) of patients in the development and validation cohort, respectively, including deep venous thrombosis (n = 10 [3.0%] and n = 5 [3.5%]) and pulmonary embolism (n = 5 [1.5%] and n = 1 [0.7%]). A high-risk bleeding score was predictive of noncatheter-associated thrombosis in the development cohort (SHR, 4.52; 95% CI, 1.65-12.33; P = .003) and validation cohort (SHR, 5.09; 95% CI, 1.05-24.78; P = .044); this association was independent of baseline WBC count and LDH, highlighting the dual risk of hemorrhage and thrombosis in patients with DIC-like coagulopathy. In contrast, catheter-associated thromboses, which are provoked by the placement of indwelling central venous catheters, occurred in 9.1% (n = 31) and 7.0% (n = 10) of patients in the development and validation cohorts, respectively, and were not associated with a high-risk bleeding score (SHR, 2.19; 95% CI, 0.94-5.11; P = .069; and SHR, 2.17; 95% CI, 0.57-8.20; P = .254).
High bleeding score is associated with proliferative AML
To identify factors associated with high vs low bleeding scores, we compared patient and disease characteristics between the 2 risk groups in both cohorts (Table 4). Patients with a high bleeding score had significantly higher median WBC counts compared with patients with a low bleeding score (development: 18.3 vs 5.8 × 10⁹/L; P < .001; validation: 40.4 vs 6.6 × 10⁹/L; P < .001). Similarly, baseline LDH was significantly higher in high- vs low-risk patients (development: 752 vs 312 U/L; P < .001; validation: 2130 vs 833 U/L; P < .001). Somatic gene mutations which have been previously associated with proliferative AML or hyperleukocytosis,24 including FLT3, NPM1, or drivers of activated RAS/MAPK signaling (NRAS, KRAS, PTPN11, CBL) were not associated with the grade 4 bleeding score in either cohort. Bleeding risk was also not significantly associated with any other disease-related or patient-related variables, including ELN cytogenetic risk, age, or sex.
Discussion
Predicting the risk of treatment complications is central to the clinical care of patients with newly diagnosed AML. Quantitative scoring systems can predict the overall risk of early mortality after intensive AML chemotherapy but do not predict the development of specific life-threatening complications and do not provide guidance on risk mitigation strategies. Even among patients who are “fit” based on conceptual or quantitative criteria, grade 4 bleeding remains a major cause of early morbidity and mortality.
In this retrospective study, we identified a subset of non-APL AML patients with a DIC-like coagulopathy who had an elevated risk of developing life-threatening or disabling bleeding and early death within the first 60 days of induction treatment. We present a simple predictive scoring system that was developed in a cohort of consecutively treated real-world AML patients and validated in an independent cohort. Predictors of grade 4 bleeding were PT-INR 1.3 to 1.5 (1 point), >1.5 (2 points), and platelet count ≤40 × 109/L (1 point), measured at the start of induction or at the time of bleeding event if bleeding occurred prior to the start of induction. Most AML patients had a low bleeding score, associated with a 2% cumulative incidence of early bleeding. In contrast, 12% of patients had a high bleeding score and a 31% cumulative incidence of early bleeding despite receiving standard of care inpatient monitoring and supportive measures.
The occurrence of a bleeding event prior to the start of induction treatment was predefined not to be an exclusion criterion because such events were considered likely to be disease-related. However, this could introduce a selection bias by selectively including only those patients with preinduction grade 4 bleeding who survived to start intensive treatment. To investigate this potential selection bias, we identified all patients who might have qualified for intensive induction therapy and found that no patients were deemed ineligible or unfit for intensive treatment due to bleeding of any grade. Laboratory values obtained prior to the grade 4 bleeding event were collected for patients with grade 4 bleeding prior to induction, whereas laboratory values closest to induction were considered for all other patients.
Risk factors for bleeding in patients with hematological malignancies have been previously studied.23,25 Uhl et al25 reported results of the PLADO trial with a consistent increased risk of grade ≥2 bleeding in patients with a platelet count ≤45 × 109/L, except for the 31 to 35 × 109/L stratum. Although this study did not specifically report on higher bleeding grades, our unbiased approach using recursive partitioning confirms a platelet count of <40 × 109/L as a predictor of grade 4 bleeding. In another study, no association was identified between DIC and major bleeding in AML patients, although reliable conclusions cannot be drawn since the reported numbers of major bleeding events were discordant in different components of that analysis.23 Here, patients with a high grade 4 bleeding score had the characteristic clinical features of DIC, including an increased incidence of both bleeding and noncatheter-associated thrombosis in the context of consumptive coagulopathy and decreased platelet count.21,25,26 However, unlike the coagulopathy observed in APL and B-cell acute lymphoblastic leukemia,27-30 the coagulopathy in newly diagnosed non-APL AML was not associated with severe hypofibrinogenemia (fibrinogen levels <100 mg/dL, as defined by the International Society on Thrombosis and Haemostasis-DIC scoring system22 ) and hypofibrinogenemia did not correlate with excess bleeding risk in patients with a high bleeding score. In addition, although we were not able to interrogate the added value of D-dimer as a risk factor for grade 4 bleeding due to missing data in the development cohort, we found that D-dimer did not improve the bleeding score in the independent validation cohort. Together this might suggest that hyperfibrinolysis is not an independent risk factor for grade 4 bleeding in AML patients and may not be a major component of the coagulopathy of non-APL AML. Further studies with complete D-dimer data are needed to better establish the association between D-dimer and grade 4 bleeding.
Bleeding is a major cause associated with early mortality of intensive AML induction treatment,2 and our study shows that DIC-like coagulopathy is a clinically significant driver of life-threatening WHO grade 4 bleeding events in AML patients. In contrast, coagulation abnormalities were not associated with the development of grade 2 to 3 bleeding, indicating that these less severe events are more clinically heterogeneous and biologically multifactorial. We found that factors previously linked with different grades of bleeding, including age, sex, hemoglobin level, hepatic and renal function, and WBC count, were not independently associated with an increased risk of grade 4 bleeding in our study.10,11,31,32 Notably, several patients had a low baseline bleeding score but experienced grade 4 bleeding events after developing laboratory DIC-like coagulopathy during treatment. Future studies may refine our model by incorporating serial assessment of coagulation labs in order to quantify dynamic bleeding risk evolution during treatment.
The retrospective nature of this study and data abstraction of individual patient charts limits the evaluation of all potentially relevant variables, including prior major bleeding, performance status, medical comorbidities, nutritional deficiency, and cryptic liver synthetic dysfunction. Similarly, AML with monocytic differentiation, which has been previously linked to DIC in AML patients,23 was not specifically documented, although gene mutations associated with AML with monocytic differentiation (eg, NPM1, FLT3-ITD, DNMT3A) were not found to be predictive of grade 4 bleeding.
Lastly, the validation cohort consisted of a nonconsecutive cohort of patients with available genetic analysis, which might have introduced some degree of selection bias. Thus, additional validation of this grade 4 bleeding model is needed, preferably in a larger cohort of intensively treated patients with prospective collection of bleeding events, coagulation parameters, thrombotic events (catheter and noncatheter associated), and other clinical and disease variables. Similar prospective analyses could also be conducted to study grade 4 bleeding in patients receiving nonintensive approaches.
The results of this study provide a pretreatment tool to identify patients at high risk for grade 4 bleeding. Although treatment of AML should begin promptly, initiation of induction chemotherapy must be balanced with delay to optimize organ function, manage coagulopathy, and improve overall condition in order to minimize treatment-related complications.33,34 Several strategies could be employed to mitigate the risk of grade 4 bleeding in patients with a high bleeding score, including preinduction correction of DIC-related laboratory coagulopathy, reduction of proliferative disease, and stringent clinical and laboratory monitoring. Even for patients with bona fide DIC, there are limited data to support evidence-based guidelines for supportive hemostatic strategies. Moreover, the typical prophylactic platelet transfusion threshold of <10 × 109/L might not be effective in AML patients with DIC-like coagulopathy. Consensus recommendations for DIC management have prioritized platelet transfusions and replacement of coagulation factors with fresh-frozen plasma or prothrombin complex concentrate.35 These recommendations could also be considered for the high-risk subset of AML patients with a DIC-related coagulopathy as defined in this study to maintain a platelet count of >20 to 30 × 109/L in patients without bleeding and a higher threshold of >50 × 109/L in high-risk patients with concurrent bleeding events. However, AML-specific thresholds may be unique given the multifactorial contributions to thrombocytopenia, including disease-related marrow dysfunction, treatment-related myelosuppression, infections, sepsis, and coagulation abnormalities following anthracycline-based intensive induction chemotherapy.36 Patients with proliferative AML are also at increased risk for DIC-related coagulopathy arising from high levels of procoagulants triggering the extrinsic coagulation pathway.26,36,37 Consequently, cytoreduction with hydroxyurea prior to initiating induction chemotherapy may normalize the activated coagulation pathway and improve the safety of treatment in this high-risk population. Altogether, patients at high risk for grade 4 bleeding need careful clinical and laboratory monitoring after treatment initiation, with emphasis on early diagnosis and interventions to minimize bleeding complications. These risk-adapted preventive management strategies should preferably be studied in a prospective clinical trial.
In conclusion, we developed and independently validated a novel and simple tool which identifies AML patients with a clinical phenotype of DIC-like coagulopathy who are at high risk of grade 4 bleeding. Prospective studies are needed in which these patients might be considered for assertive supportive care aimed at reversing the coagulopathy and reducing proliferative disease in order to decrease the incidence of life-threatening bleeding events and reduce the risk of early mortality during induction treatment.
Acknowledgments
This work was supported by grants from the National Institutes of Health K08CA204734 (R.C.L.) and T32HL066987 (R.B.); American Society of Hematology-Amos Medical Faculty Development Program Award (R.B.); the Edward P. Evans Foundation, Rubicon fellowship from the Netherlands Organization for Scientific Research (J.V.); Erasmus Medical Center Foundation-Daniel den Hoed (J.V.); Rene Vogels stipend (J.V.); and the DFCI Hematologic Malignancies Data Repository.
Authorship
Contribution: J.V. and R.C.L. designed the study, analyzed the data, and wrote the manuscript; J.V., M.P., J.E.H., R.S.V., A.C., K.M.C., M.F., O.W., E.A.G., J.E.T., R.M.S., D.J.D., M.R.L., E.S.W., and R.C.L. provided patient data; J.V., M.P., J.E.H., R.B., A.C., K.M.C., O.W., S.S., A.R., P.K.B., and R.C.L. collected and assembled clinical, laboratory, and genetic data; J.V., Y.F., D.N., and R.C.L. conceived the statistical plan and performed the statistical analysis; J.V., M.P., Y.F., D.N., M.R.L., E.S.W., and R.C.L. interpreted data and contributed to research discussion; and all authors reviewed the manuscript and approved the submission. J.V., Y.F., D.N., and R.C.L. had full access to all data.
Conflict-of-interest disclosure: The authors declare no competing financial interests.
Correspondence: R. Coleman Lindsley, Dana-Farber Cancer Institute, 450 Brookline Ave, Boston, MA 02215; e-mail: coleman_lindsley@dfci.harvard.edu.

