

Key Points
Weight and height Z-scores decreased during therapy; after therapy, weight and BMI Z-scores increased but height Z-scores remained low.
The decrease in weight Z-scores during induction therapy was associated with increased adverse effects and death in remission.

Abstract
Little is known about body composition changes in patients with acute myeloid leukemia (AML) during and after treatment or their associations with outcomes. Z-scores for body mass index (BMI), weight, and height at diagnosis, their longitudinal changes from diagnosis to 5 years off therapy, and their associations with adverse effects and outcomes were evaluated in 227 pediatric patients with AML enrolled in the AML02 and AML08 trials at St. Jude Children’s Research Hospital between 2002-2017. The median Z-scores for baseline weight, height, and BMI were 0.193, 0.209, and 0.170, respectively, and those for weight and height decreased significantly during therapy to −0.038 and −0.163, respectively, at off-therapy (P < .001 for both). At 5 years off therapy, the Z-scores for weight and BMI had increased significantly to 0.492 (P = .003) and 0.911 (P < .001), respectively, whereas the height Z-score remained significantly lower at −0.066 (P < .001) compared with baseline. The height Z-score of transplant recipients decreased further from −0.211 at transplant to −0.617 12 months later (P < .001). Baseline BMI category and Z-score were not associated with outcomes, but higher weight Z-scores were associated with lower incidences of refractory or relapsed disease (hazard ratio [HR], 0.82; 95% confidence interval [CI], 0.67-0.99) and higher incidences of death in remission (HR, 1.31; 95% CI, 1.01-1.70). Furthermore, weight Z-score decrease during induction therapy was associated with gastrointestinal, hepatic, and infection toxicities during subsequent therapy and with death in remission (HR, 2.66; 95% CI, 1.11-6.45). Multidisciplinary monitoring for weight changes and short stature is required from diagnosis to the off-therapy period.
Introduction
In recent decades, survival rates for pediatric acute myeloid leukemia (AML) have improved substantially, reaching ∼70%, as a result of treatment strategies based on comprehensive risk classification based on genetic analysis and minimal residual disease, risk-adapted use of hematopoietic cell transplantation (HCT), and advances in supportive care.1,2
Obesity is prevalent among children in the United States, with 17.8% of children being obese.3 The increased use of glucocorticoids and asparaginase has drawn ample attention to obesity in children with acute lymphoblastic leukemia (ALL),4-6 but studies of longitudinal changes in body composition among AML patients are lacking. Therefore, it is imperative to investigate how AML and its intensive treatment affect the weight, height, and body mass index (BMI) of patients during treatment and after completion of therapy. Past studies have revealed that obesity and underweight status at diagnosis can affect survival and treatment-related mortality in pediatric patients with AML.7,8 Advances in AML treatment might be altering this trend, but recent studies have yielded conflicting data,9,10 and the longitudinal changes in body composition and their associations with treatment outcomes are unknown. Therefore, we evaluated BMI, weight, and height at diagnosis and the longitudinal changes in these measurements during and after therapy, along with their associations with survival and adverse effects, in patients enrolled on contemporary AML protocols at St. Jude Children’s Research Hospital (St. Jude).
Patients and methods
Patients
Children and adolescents with AML (aged 0-21 years at diagnosis) who were enrolled and treated at St. Jude on the AML 02 (NCT00136084)11 or AML 08 (NCT00703820)12 multicenter clinical trial protocol between 2002-2017 were included in this analysis. Treatment details were described previously, and the risk classification is shown in the supplemental Information (page 22 of the data supplement).11,12 Patients received prophylactic antibiotics (vancomycin and ciprofloxacin) and antifungals (voriconazole) while neutropenic.13 This study was approved by the St. Jude Institutional Review Board and performed according to the Declaration of Helsinki. Patients were monitored for their weight, height, dietary intake, and clinical condition by dietitians and treating clinicians. Patients experiencing weight loss or inability to meet >90% of energy requirements for 3 to 5 days, severe mucositis, or severe vomiting and diarrhea were considered for parenteral nutrition or nasogastric feeding at the discretion of the clinicians, although parenteral nutrition was preferentially used during the study period.
Weight, height, and body mass index
Weight and height data were obtained at the beginning and end of induction therapy courses 1 and 2 and consolidation therapy courses 1, 2, and 3; at off therapy; at 4, 8, and 12 months off therapy; and at 2, 3, 4, and 5 years off therapy (supplemental Figure 1). Patients who died, experienced disease recurrence, underwent HCT, or were taken off study were censored for weight and height data at the time of the event. Weight and height data for patients who underwent HCT upon the completion of protocol chemotherapy were evaluated separately at HCT; at 1, 2, 4, 8, and 12 months after HCT; and at 2, 3, 4, and 5 years after HCT.
For patients aged ≥2 years, BMI was calculated by dividing the weight of the patient in kilograms by their height in meters squared (kg/m2), whereas weight-for-length was calculated for patients younger than 36 months. The BMI, weight-for-length, weight, height, and length measurements were then converted to Z-scores with the SAS statistical program (SAS Institute Inc., Cary, NC) for the 2000 Centers for Disease Control and Prevention growth charts.14 To obtain smooth body composition Z-scores for toddlers, we interpolated the Z-scores for BMI and weight-for-length for children aged 2 to 3 years. For patients aged 2 to 3 years, Z-scores for BMI and weight-for-length were interpolated, based on patient age, by using the following formula: Z-score = (actual age − 2 years) * (BMI Z-score) + (3 years − actual age) * (weight-for-height Z-score). For simplicity, we refer to the weight-for-length Z-scores for children aged <2 years, the interpolated Z-scores for children aged 2 to 3 years, and the BMI Z-scores for children aged >3 years as the BMI Z-scores. For patients aged >20 years, the Z-score was calculated based on reference data for individuals aged 20 years. Using BMI-for-age Z-scores, BMI was categorized as underweight (<−1.6449 [corresponding to the <5th percentile]), healthy weight (−1.6449 to 1.0364 [5th to 85th percentile]), overweight (1.0364 to 1.6449 [85th to 95th percentile]), or obese (≥1.6449 [≥95th percentile]).
Adverse effects
Grade ≥3 adverse events were recorded in 7 major categories (cardiovascular, gastrointestinal, hemorrhage, hepatic, infection/febrile neutropenia, respiratory, and neurologic/psychiatric) based on Common Terminology Criteria for Adverse Effects version 3.0 (supplemental Table 1) and were divided into those incidents occurring during induction therapy (induction courses 1 and 2) and those occurring during subsequent courses of therapy. The associations of changes in the Z-scores for BMI and weight from diagnosis to the end of induction 2 with adverse effects of the respective treatment phases were then evaluated.
Statistical analysis
The median Z-scores for BMI, weight, and height at each time point were compared with those at diagnosis by using paired t tests. At each time point, the association of each Z-score with clinical features was examined using a linear regression model, adjusting for age at diagnosis, treatment risk, sex, race, white blood cell (WBC) count at diagnosis, and central nervous system (CNS) status.
Event-free survival (EFS) was defined as the time from study entry to induction failure/refractory disease (≥5% blasts after 2 courses of induction), relapse, second malignancy, withdrawal from study, or death. We considered withdrawal from study as an event because it can be associated with excessive toxicities or social reasons that prevent continuation of protocol therapy. EFS times for patients who remained alive and event-free were censored at the time of their last visit. Overall survival (OS) was defined as the time from study entry to death. OS times for living patients were censored at the time of their last visit. Probabilities of EFS and OS were estimated with the Kaplan-Meier method, and the difference between BMI categories was calculated using the log-rank test. EFS and OS were also examined in a Cox proportional hazards model, using the Z-score for BMI, weight, or height as a continuous variable in a spline model. Competing risk analysis was performed to investigate the cumulative incidences of refractory disease/relapse and death in first remission, using the Gray test to evaluate differences between groups. Fine-Gray competing-risk regression models were used to evaluate the associations of baseline Z-score and change in Z-score during the first 2 courses of chemotherapy with adverse events and with cumulative incidence of relapse/refractory disease and death in remission. These models counted death, relapse, undergoing HCT, and completion of therapy as competing events. All statistical analyses were performed using R version 3.5.2.
Results
Patient characteristics
A total of 227 patients were studied (104 from AML 02 and 123 from AML 08). Their characteristics and the number of patients at each time point are summarized in Table 1 and supplemental Figure 1, respectively. The patient characteristics for the St. Jude cohort (included in this study) and the non–St. Jude cohort (not included) are shown in supplemental Table 2. The median age at diagnosis was 9 years (range, 5 days to 21 years), and the median follow-up was 6 years (range, 3 months to 15 years) at the time of analysis. Overweight/obese patients were older and underweight patients were younger than healthy-weight patients (Table 1).
Patient characteristics
| All | Underweight | Healthy weight | Overweight/ obese | |
|---|---|---|---|---|
| Clinical features | (N = 227) | (N = 22) | (N = 158) | (N = 47) |
| Age at diagnosis | ||||
| 0-9.9 y | 120 (52.9) | 19 (86.4) | 86 (54.4) | 15 (31.9) |
| 10-21 y | 107 (47.1) | 3 (13.6) | 72 (45.6) | 32 (68.1) |
| Sex | ||||
| Female | 112 (49.3) | 8 (36.4) | 78 (49.4) | 26 (55.3) |
| Male | 115 (50.7) | 14 (63.6) | 80 (50.6) | 21 (44.7) |
| Race | ||||
| White | 155 (68.3) | 16 (72.7) | 104 (65.8) | 35 (74.5) |
| Black | 56 (24.7) | 6 (27.3) | 40 (25.3) | 10 (21.3) |
| Other | 15 (6.6) | 0 | 13 (8.2) | 2 (4.3) |
| N/A | 1 (0.4) | 0 | 1 (0.6) | 0 |
| WBC at diagnosis | ||||
| Median (range) | 19.3 (0.3-412.2) | 30.5 (2.4-312.0) | 15.9 (0.3-412.2) | 26.3 (1.1-351.0) |
| <50 × 109/L | 160 (70.5) | 15 (68.2) | 115 (72.8) | 30 (63.8) |
| ≥50 × 109/L | 66 (29.1) | 7 (31.8) | 42 (26.6) | 17 (36.2) |
| N/A | 1 (0.4) | 0 | 1 (0.6) | 0 |
| FAB classification | ||||
| M1/M2 | 48 (21.1) | 8 (36.4) | 28 (17.7) | 12 (25.5) |
| M4/M5 | 109 (48.0) | 9 (40.9) | 77 (48.7) | 23 (48.9) |
| M0/M6 | 7 (3.1) | 0 | 5 (3.2) | 2 (4.3) |
| M7 | 34 (15.0) | 3 (13.6) | 26 (16.5) | 5 (10.6) |
| N/A | 29 (12.8) | 2 (9.1) | 22 (13.9) | 5 (10.6) |
| Cytogenetics | ||||
| 11q23 | 59 (26.0) | 8 (36.4) | 41 (25.9) | 10 (21.3) |
| Inv(16)/t(8;21) | 45 (19.8) | 5 (22.7) | 27 (17.1) | 13 (27.7) |
| Normal | 54 (23.8) | 5 (22.7) | 40 (25.3) | 9 (19.1) |
| Miscellaneous | 67 (29.5) | 4 (18.2) | 48 (30.4) | 15 (31.9) |
| N/A | 2 (0.9) | 0 | 2 (1.3) | 0 |
| CNS disease | ||||
| Negative | 116 (51.1) | 9 (40.9) | 82 (51.9) | 25 (53.2) |
| Positive | 104 (45.8) | 13 (59.1) | 70 (44.3) | 21 (44.7) |
| N/A | 7 (3.1) | 0 | 6 (3.8) | 1 (2.1) |
| Protocol | ||||
| AML 02 | 104 (45.8) | 6 (27.3) | 75 (47.5) | 23 (48.9) |
| AML 08 | 123 (54.2) | 16 (72.7) | 83 (52.5) | 24 (51.1) |
| HCT | ||||
| Yes | 74 (32.6) | 6 (28.6) | 47 (30.5) | 21 (40.4) |
| No | 153 (67.4) | 15 (71.4) | 107 (69.5) | 31 (59.6) |
FAB, French-American-British; N/A, not available.
Longitudinal changes in Z-scores for BMI, weight, and height during and after therapy
Figure 1 shows the longitudinal changes in the proportion of patients in each BMI category. Although the proportions of each group remained similar during treatment, the percentages of overweight and obese patients increased and that of underweight patients decreased after completion of therapy; the percentages of patients who were of healthy weight, overweight, obese, and underweight were 69.6%, 8.8%, 11.9%, and 9.7%, respectively, at diagnosis and 55.4%, 17.8%, 24.8%, and 2.0%, respectively, at 12 months off therapy.
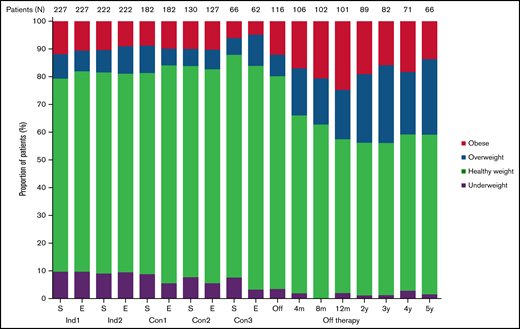
Longitudinal changes in the percentage of patients in each body mass index category. Con, consolidation; E, end of each chemotherapy course; Ind, induction; m, month; S, start of each chemotherapy course; y, year.
Longitudinal changes in the percentage of patients in each body mass index category. Con, consolidation; E, end of each chemotherapy course; Ind, induction; m, month; S, start of each chemotherapy course; y, year.
Figure 2 shows boxplots for each body composition Z-score at each time point. The median baseline Z-scores for BMI, weight, and height were 0.170, 0.193, and 0.209, respectively. Paired comparisons of Z-scores across time points showed that the median Z-scores for weight and height dropped significantly from baseline over the entire treatment period (P ≤ .021 for all) (Figure 2B-C). At completion of therapy, the Z-scores for weight and height were −0.038 and −0.163, respectively, with mean paired changes of −0.302 and −0.369, respectively (P < .001 for both). BMI Z-scores were lower than those at diagnosis only at the end of induction 1 and at the start of induction 2 and consolidation 2 (P ≤ .042 for all) (Figure 2A). As significant changes were already present at the end of induction 1, we evaluated the median changes in actual weight, height, and BMI from baseline to the end of induction 1 (a median of 27.0 days). The median changes were −0.634 kg (95% confidence interval [CI], −0.92 kg to −0.38 kg), +0.196 cm (95% CI, +0.05 cm to +0.33 cm), and −0.117 kg/m2 (95% CI, −0.18 kg/m2 to −0.06 kg/m2). After completion of therapy, Z-scores for weight and BMI increased dramatically (to 0.663 and 0.669, respectively, at 12 months) so that the mean paired changes from baseline to 12 months after completion of therapy were 0.481 and 0.754, respectively (P < .001 for both) (Figure 2A-B). The median height Z-score at 12 months after completion of therapy remained significantly lower than at baseline at 0.078 (mean paired change, −0.237, P < .001) (Figure 2C). These trends persisted at 5 years after completion of therapy, with the median Z-scores and mean paired changes in Z-score from baseline being 0.723 and 0.442, respectively, for weight (P = .003); 0.911 and 0.701, respectively, for BMI (P < .001); and −0.066 and −0.349, respectively, for height (P < .001). The observed decrease in mean height Z-score (−0.349) from baseline to 5 years after completion of therapy corresponds to decreases of 2.51 cm (from 176.74 cm to 174.23 cm) and 2.27 cm (from 163.30 cm to 161.03 cm) for an adult man and an adult woman, respectively. Supplemental Tables 3-5 show detailed results of comparing paired changes in Z-scores for each body composition metric. Similar longitudinal changes in BMI, weight, and height Z-scores were seen when patients who were younger than 2 years at diagnosis were excluded from the analysis (supplemental Tables 6-8).
![Longitudinal changes in the median Z-scores for body mass index (A), weight (B), and height of patients during therapy and in the off-therapy period (C). The box corresponds to the interval from the first quartile to the third quartile. The line dividing the box indicates the median Z-score. The whiskers represent 1.5 times the interquartile range values, and values outside these ranges are shown as green dots (•). Significant differences from baseline values are represented by asterisks (*). Asterisks and letters in red represent increases in Z-scores from the baseline values; asterisks and letters in blue represent decreases in Z-scores from the baseline values. For panel A, blue, orange, and red lines show the Z-score cutoffs for underweight (<−1.6499, [5th percentile]), overweight (≥1.0364 [85th percentile] to <1.6499 [95th percentile]), and obese (≥1.6499 [95th percentile]), respectively. Healthy weight Z-scores range from ≥−1.6499 (5th percentile) to <1.0364 (85th percentile). To obtain smooth body composition Z-scores for toddlers (aged 0-3 years), we interpolated the Z-scores for BMI and weight-for-length for children aged 2 to 3 years; for patients aged >20 years, the Z-score was calculated based on reference data for individuals aged 20 years, as described in “Patients and methods.” Con, consolidation; E, end of each chemotherapy course; Ind, induction; m, months; S, start of each chemotherapy course; y, years.](https://ash.silverchair-cdn.com/ash/content_public/journal/bloodadvances/6/9/10.1182_bloodadvances.2021006090/2/m_advancesadv2021006090f2.png?Expires=1767708404&Signature=skBTmhF6ThV6U4t-393jQIr-1LGKZyQ~sX1qHDOQU4EdksGIGUP4Z3e~oq78Z4BZBDKriQmL74B6BSaOIZL11wUqfYCfbYVEAtpEXndyQ44P~E0b0tJBU9Y7T5M5~5sG1sthglM55TvDLvqnoEc0Iek-iAw9Ea8yYCb9BXq1fDsnf-lZlhNCm4gH08t7GlnlpAQ8l3SI~0Fclg8vlzQ3tCc6Q6jgmk4GuF5bL0tnMiDG~gqXSpQ-YDwig3fGvZvHE2mHJ8lkkysujOctdSvRJ9YVUtnRIYIJpIf6gOyrqYINFoFv0r5XMluC7GMW~RhMrT8dWGK8n80vavcbHk8YJA__&Key-Pair-Id=APKAIE5G5CRDK6RD3PGA)
Longitudinal changes in the median Z-scores for body mass index (A), weight (B), and height of patients during therapy and in the off-therapy period (C). The box corresponds to the interval from the first quartile to the third quartile. The line dividing the box indicates the median Z-score. The whiskers represent 1.5 times the interquartile range values, and values outside these ranges are shown as green dots (•). Significant differences from baseline values are represented by asterisks (*). Asterisks and letters in red represent increases in Z-scores from the baseline values; asterisks and letters in blue represent decreases in Z-scores from the baseline values. For panel A, blue, orange, and red lines show the Z-score cutoffs for underweight (<−1.6499, [5th percentile]), overweight (≥1.0364 [85th percentile] to <1.6499 [95th percentile]), and obese (≥1.6499 [95th percentile]), respectively. Healthy weight Z-scores range from ≥−1.6499 (5th percentile) to <1.0364 (85th percentile). To obtain smooth body composition Z-scores for toddlers (aged 0-3 years), we interpolated the Z-scores for BMI and weight-for-length for children aged 2 to 3 years; for patients aged >20 years, the Z-score was calculated based on reference data for individuals aged 20 years, as described in “Patients and methods.” Con, consolidation; E, end of each chemotherapy course; Ind, induction; m, months; S, start of each chemotherapy course; y, years.
Longitudinal changes in the median Z-scores for body mass index (A), weight (B), and height of patients during therapy and in the off-therapy period (C). The box corresponds to the interval from the first quartile to the third quartile. The line dividing the box indicates the median Z-score. The whiskers represent 1.5 times the interquartile range values, and values outside these ranges are shown as green dots (•). Significant differences from baseline values are represented by asterisks (*). Asterisks and letters in red represent increases in Z-scores from the baseline values; asterisks and letters in blue represent decreases in Z-scores from the baseline values. For panel A, blue, orange, and red lines show the Z-score cutoffs for underweight (<−1.6499, [5th percentile]), overweight (≥1.0364 [85th percentile] to <1.6499 [95th percentile]), and obese (≥1.6499 [95th percentile]), respectively. Healthy weight Z-scores range from ≥−1.6499 (5th percentile) to <1.0364 (85th percentile). To obtain smooth body composition Z-scores for toddlers (aged 0-3 years), we interpolated the Z-scores for BMI and weight-for-length for children aged 2 to 3 years; for patients aged >20 years, the Z-score was calculated based on reference data for individuals aged 20 years, as described in “Patients and methods.” Con, consolidation; E, end of each chemotherapy course; Ind, induction; m, months; S, start of each chemotherapy course; y, years.
Clinical characteristics affecting Z-scores for BMI, height, and weight during and after therapy
Patients aged ≥10 years at diagnosis had higher BMI Z-scores at each time point (P ≤ .044 for all time points) than did younger patients in linear models that also included risk group (standard/high vs low), sex (female vs male), race (white vs black), diagnostic WBC count (< 50 × 109/L vs ≥ 50 × 109/L), and CNS leukemia status (CNS1 vs CNS2, CNS3, or traumatic tap with blasts) as predictors of BMI Z-score (supplemental Figure 2A; supplemental Table 9). No other predictor in these models was significantly associated with BMI Z-score at any time point.
Similarly, weight Z-scores were higher among children aged ≥10 years at diagnosis than among younger children at all time points (P ≤ .014 for all time points) (supplemental Figure 2C; supplemental Table 10). Also, weight Z-scores were significantly higher for male patients than for female patients from the end of therapy until 8 months after therapy (P ≤ .049 for each time point) (supplemental Figure 2D; supplemental Table 10).
The median height Z-scores were significantly higher in patients aged ≥10 years at diagnosis than in those younger than 10 years at the end of induction 2 (P = .010) and from the end of consolidation 1 (P = .045) to the end of consolidation 2 (P = .040) (supplemental Figure 2E; supplemental Table 11). However, no significant differences were observed between age groups at later times. In addition, median height Z-scores were significantly higher for boys than for girls from the beginning of treatment to the end of consolidation 2 (P ≤ .034 for all) (supplemental Figure 2F; supplemental Table 11).
Associations between body composition at diagnosis and outcome
We evaluated the associations of BMI group at diagnosis with outcome. There were no significant differences among the 3 BMI groups (P = .911) in 5-year EFS, which was 60.0% (95% CI, 52.8% to 68.2%) for healthy-weight patients, 58.6% (95% CI, 45.8% to 74.9%) for obese/overweight patients, and 59.1% (95% CI, 41.7% to 83.7%) for underweight patients (Figure 3A). Similarly, the 5-year OS rates were 73.5% (95% CI, 66.8% to 80.8%) for healthy-weight patients, 71.6% (95% CI, 59.7% to 86.0%) for obese/overweight patients, and 68.5% (95% CI, 50.2% to 93.4%) for underweight patients (P = .968) (Figure 3B). There were also no differences in the incidence of refractory/relapsed disease (P = .489) (Figure 3C) or death in first remission (P = .439) (Figure 3D) among the 3 BMI groups.
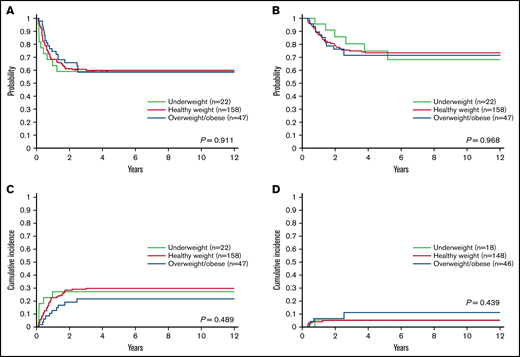
Outcomes of patients based on body mass index category. (A) Event-free survival, (B) overall survival, (C) cumulative incidence of refractory/relapsed disease, and (D) cumulative incidence of death in first remission according to body mass index category at diagnosis in 227 children with acute myeloid leukemia. Data were analyzed with the patients categorized by body mass index as underweight, healthy weight, or overweight/obese.
Outcomes of patients based on body mass index category. (A) Event-free survival, (B) overall survival, (C) cumulative incidence of refractory/relapsed disease, and (D) cumulative incidence of death in first remission according to body mass index category at diagnosis in 227 children with acute myeloid leukemia. Data were analyzed with the patients categorized by body mass index as underweight, healthy weight, or overweight/obese.
The associations of Z-scores for BMI, height, and weight at diagnosis with EFS and OS were also not significant when evaluated as continuous variables in a spline model (supplemental Figure 3A-F).
Association of adverse events with BMI and weight Z-scores at diagnosis and changes in BMI and weight Z-scores during induction therapy
At diagnosis, higher BMI and weight Z-scores were associated with higher incidences of hemorrhagic adverse effects before induction 2 (hazard ratio [HR], 1.38; 95% CI, 1.12-1.70 for BMI; and HR, 1.36; 95% CI, 1.13-1.64 for weight) and respiratory adverse effects after induction 2 (HR, 1.69; 95% CI, 1.17-2.43 for BMI; and HR, 1.57; 95% CI, 1.17-2.11 for weight) (Table 2).
Analysis of associations of grade 3 or 4 adverse events from diagnosis to the end of induction 2 and in subsequent therapies with decreases in Z-scores for body mass index and weight during induction and with Z-scores at diagnosis
| Reported adverse events | Body mass index | ||||||
|---|---|---|---|---|---|---|---|
| Decrease in Z-score from diagnosis to induction 2 | Z-score at diagnosis | ||||||
| Before induction 2 | N | HR | 95% CI | P | HR | 95% CI | P |
| Cardiovascular | 26 | 1.16 | 0.60-2.26 | .662 | 1.16 | 0.87-1.55 | .321 |
| Gastrointestinal | 76 | 1.08 | 0.75-1.56 | .675 | 0.95 | 0.78-1.17 | .646 |
| Anorexia/nausea/vomiting | 22 | 0.84 | 0.45-1.58 | .597 | 0.91 | 0.62-1.33 | .625 |
| Colitis/typhlitis | 31 | 0.83 | 0.46-1.49 | .527 | 1.24 | 0.96-1.61 | .095 |
| Diarrhea | 13 | 1.15 | 0.50-2.64 | .742 | 1.05 | 0.77-1.42 | .764 |
| Mucositis | 18 | 1.28 | 0.51-3.23 | .605 | 1.19 | 0.85-1.66 | .319 |
| Hemorrhage | 25 | 0.86 | 0.60-1.23 | .419 | 1.38 | 1.12-1.70 | .003* |
| Hepatic | 37 | 1.33 | 0.91-1.94 | .139 | 0.81 | 0.59-1.10 | .174 |
| Infection/febrile neutropenia | 186 | 1.04 | 0.88-1.23 | .618 | 0.97 | 0.86-1.09 | .576 |
| Respiratory | 32 | 1.50 | 0.72-3.12 | .275 | 1.06 | 0.82-1.37 | .672 |
| Neurologic/psychiatric | 14 | 0.74 | 0.34-1.64 | .459 | 0.93 | 0.66-1.32 | .685 |
| After induction 2 | |||||||
| Cardiovascular | 12 | 1.34 | 0.69-2.60 | .381 | 1.36 | 0.81-2.28 | .237 |
| Gastrointestinal | 44 | 1.14 | 0.73-1.79 | .564 | 1.13 | 0.91-1.40 | .281 |
| Anorexia/nausea/vomiting | 15 | 0.72 | 0.33-1.58 | .414 | 1.28 | 0.96-1.70 | .088 |
| Colitis/typhlitis | 20 | 1.12 | 0.56-2.24 | .751 | 1.10 | 0.75-1.62 | .621 |
| Diarrhea | 9 | 1.31 | 0.26-6.71 | .746 | 1.34 | 0.87-2.06 | .019 |
| Mucositis | 4 | 1.59 | 0.67-3.76 | .289 | 0.80 | 0.29-2.22 | .662 |
| Hemorrhage | 17 | 1.15 | 0.77-1.72 | .500 | 0.81 | 0.57-1.15 | .235 |
| Hepatic | 19 | 1.69 | 0.85-3.38 | .138 | 1.10 | 0.73-1.64 | .655 |
| Infection/febrile neutropenia | 144 | 1.12 | 0.86-1.45 | .402 | 1.05 | 0.91-1.21 | .499 |
| Respiratory | 19 | 1.29 | 0.56-2.95 | .551 | 1.69 | 1.17-2.43 | .005* |
| Neurologic/psychiatric | 13 | 0.79 | 0.25-2.49 | .691 | 1.17 | 0.84-1.61 | .360 |
| Reported adverse events | Weight | ||||||
|---|---|---|---|---|---|---|---|
| Decrease in Z-score from diagnosis to induction 2 | Z-score at diagnosis | ||||||
| Before induction 2 | N | HR | 95% CI | P | HR | 95% CI | P |
| Cardiovascular | 26 | 1.47 | 0.73-2.95 | .278 | 1.06 | 0.80-1.41 | .683 |
| Gastrointestinal | 76 | 1.54 | 1.11-2.14 | .010* | 0.90 | 0.73-1.12 | .349 |
| Anorexia/nausea/vomiting | 22 | 1.27 | 0.78-2.08 | .339 | 0.84 | 0.56-1.25 | .385 |
| Colitis/typhlitis | 31 | 1.00 | 0.57-1.73 | .987 | 1.17 | 0.88-1.54 | .278 |
| Diarrhea | 13 | 2.04 | 0.87-4.76 | .101 | 1.18 | 0.88-1.57 | .268 |
| Mucositis | 18 | 2.23 | 1.37-3.60 | <.001* | 1.25 | 0.94-1.66 | .127 |
| Hemorrhage | 25 | 0.87 | 0.54-1.42 | .579 | 1.36 | 1.13-1.64 | <.001* |
| Hepatic | 37 | 1.27 | 0.82-1.96 | .280 | 0.84 | 0.63-1.12 | .229 |
| Infection/febrile neutropenia | 186 | 1.16 | 0.94-1.42 | .154 | 0.96 | 0.87-1.07 | .491 |
| Respiratory | 32 | 1.54 | 0.85-2.78 | .154 | 1.01 | 0.75-1.36 | .949 |
| Neurologic/psychiatric | 14 | 0.59 | 0.21-1.63 | .308 | 0.80 | 0.59-1.09 | .164 |
| After induction 2 | |||||||
| Cardiovascular | 12 | 1.27 | 0.53-3.06 | .589 | 1.36 | 0.84-2.20 | .205 |
| Gastrointestinal | 44 | 1.69 | 1.13-2.53 | .010* | 1.08 | 0.86-1.35 | .515 |
| Anorexia/nausea/vomiting | 15 | 1.19 | 0.59-2.42 | .625 | 1.18 | 0.93-1.51 | .173 |
| Colitis/typhlitis | 20 | 1.04 | 0.45-2.40 | .927 | 1.19 | 0.84-1.68 | .327 |
| Diarrhea | 9 | 2.78 | 1.51-5.13 | .001* | 1.16 | 0.67-1.99 | .601 |
| Mucositis | 4 | 3.40 | 1.05-11.11 | .042* | 0.58 | 0.09-3.59 | .554 |
| Hemorrhage | 17 | 0.79 | 0.39-1.60 | .520 | 0.86 | 0.59-1.25 | .418 |
| Hepatic | 19 | 2.27 | 1.24-4.13 | .008* | 1.12 | 0.78-1.60 | .541 |
| Infection/febrile neutropenia | 144 | 1.38 | 1.06-1.81 | .018* | 1.00 | 0.87-1.15 | .976 |
| Respiratory | 19 | 1.78 | 0.99-3.22 | .056 | 1.57 | 1.17-2.11 | .003* |
| Neurologic/psychiatric | 13 | 1.04 | 0.39-2.75 | .943 | 1.19 | 0.87-1.64 | .283 |
N, number.
P <.05
We further evaluated the association of changes in Z-scores for BMI and weight from diagnosis to the end of induction 2 with the incidence of adverse effects (Common Terminology Criteria for Adverse Effects grade ≥3) (Table 2). No association was seen between changes in BMI Z-score and adverse effects. Importantly, a decrease in weight Z-score was significantly associated with gastrointestinal toxicities (HR, 1.54; 95% CI, 1.11-2.14), especially mucositis (HR, 2.23; 95% CI, 1.37-3.60), during the 2 induction therapy courses and with increased risk for gastrointestinal toxicities (HR, 1.69; 95% CI, 1.13-2.53), including diarrhea (HR, 2.78; 95% CI, 1.51-5.13), mucositis (HR, 3.40; 95% CI, 1.05-11.11), hepatic dysfunction (HR, 2.27; 95% CI, 1.24-4.13), and infection/febrile neutropenia (HR, 1.38; 95% CI, 1.06-1.81), in the subsequent treatment phases.
Figure 4 shows the associations of Z-scores for BMI and weight at diagnosis and changes in the Z-scores for BMI and weight from diagnosis to the end of induction 2 with EFS, OS, refractory/relapsed disease, and death in first remission. No significant associations were seen with BMI Z-score at diagnosis or with subsequent changes in BMI Z-score. However, higher weight Z-scores were associated with lower incidences of refractory or relapsed disease (HR, 0.82; 95% CI, 0.67-0.99) and higher incidences of death in first remission (HR, 1.31; 95% CI, 1.01-1.70). Furthermore, a greater decrease in weight Z-score was significantly associated with death in first remission (HR, 1.97; 95% CI, 1.10-3.53). The patients who died in first remission are listed in supplemental Table 12.
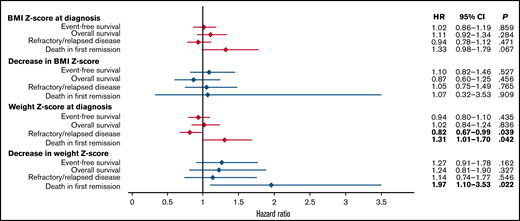
The association of Z-scores for body mass index and weight at diagnosis and decreases in those Z-scores during induction therapy with treatment outcomes.
The association of Z-scores for body mass index and weight at diagnosis and decreases in those Z-scores during induction therapy with treatment outcomes.
Longitudinal changes in Z-scores for BMI, weight, and height at HCT and afterward and the associations of the Z-scores at HCT with clinical outcomes
As the main objective of this study was to investigate the influence of intensive AML chemotherapy on body composition changes, we censored those patients who underwent HCT. However, considering that 74 of the 227 patients (32.6%) had undergone HCT at the completion of protocol chemotherapy (Table 1), we evaluated changes in BMI, weight, and height Z-scores at and after HCT and the association of the Z-scores at HCT with clinical outcomes in these patients.
Z-scores for BMI and weight were relatively stable after HCT except at 2 months (both) and 4 months (weight Z-score only) after HCT (supplemental Tables 13 and 14). The median BMI Z-score at HCT was 0.296, which decreased significantly to 0.123 with a mean paired change of −0.267 at 2 months after HCT (P < .001), but the BMI Z-scores at other time points were not significantly different. Similarly, the median weight Z-score at HCT was 0.082, which decreased significantly to −0.121 with a mean paired change of −0.231 at 2 months after HCT (P < .001) and to 0.029 with a mean paired change of −0.241 at 4 months after HCT (P = .005). However, significant decreases in height Z-score were seen at all of the time points after HCT (P < .032 for all time points) (supplemental Table 15). For example, the median height Z-score at HCT was −0.211, which further decreased to −0.617 with a mean paired change of −0.253 at 12 months after HCT (P < .001).
When the associations of BMI, weight, and height Z-scores at HCT with EFS, OS, refractory/relapsed disease, and death in remission were evaluated, both higher BMI Z-scores (HR, 1.46; 95% CI, 1.21-1.75) and higher weight Z-scores (HR, 1.49; 95% CI, 1.27-1.75) were associated with higher incidences of death in remission (supplemental Figure 4).
Discussion
This study evaluated Z-scores for BMI, weight, and height at diagnosis in pediatric patients with AML, the longitudinal changes from diagnosis to 5 years off therapy, and the impact on treatment outcomes and adverse effects. Median Z-scores for weight and height declined during therapy, whereas Z-scores for weight and BMI increased and height Z-scores remained low after completion of therapy. The decrease in height Z-score was exacerbated in patients who underwent HCT. BMI Z-score or category at diagnosis was not associated with outcome, but higher weight Z-scores were associated with lower incidences of refractory/relapsed disease and higher incidences of death in first remission. Furthermore, the decreases in weight Z-scores during induction therapy were associated with increased incidences of adverse effects and death in first remission.
In patients with ALL, weight gain starts during induction therapy as a consequence of exposure to chemotherapy agents (eg, glucocorticoids and asparaginase), an unhealthy diet, and inactivity, and it persists even after completion of therapy.4,15 Conversely, with intensive AML chemotherapy given as 4 or 5 recurrent blocks, Z-scores for weight and height decreased significantly from baseline during therapy. Although BMI Z-scores also decreased, they remained relatively similar during treatment, possibly because of the decreases in Z-scores for both weight and height. Therefore, we suggest that clinicians should not rely on BMI alone as a marker of nutritional status but should also closely monitor weight and height. These findings suggest that early interventions for nutrition and appropriate daily physical activities should be implemented at or immediately after diagnosis of AML.
Importantly, Z-scores for weight and BMI increased significantly after completion of chemotherapy, peaking with 23.6% of survivors being obese at 12 months off therapy and ∼40% being overweight/obese during the off-therapy period. This rate represents a doubling from that at diagnosis and exceeds the nationally reported rates, putting survivors at increased risk of metabolic syndrome.16 The cumulative burden of chronic health conditions was greatest in pediatric AML survivors, as compared with survivors of other hematologic malignancies, and body composition abnormalities were the most common grade 3 to 5 adverse effects.17 Intensive AML chemotherapy can cause organ damage such as cardiac dysfunction. In addition, unhealthy dietary and behavioral habits (such as inactivity) established during treatment can persist after completion of therapy, as has been reported in ALL survivors.17,18 It is also important to follow the linear growth of survivors, because height Z-scores were significantly lower than baseline scores not only during therapy but also throughout the off-therapy period. As ∼50% of our patients were 10 years or older and would normally have been expected to experience a growth spurt, it is possible that intensive chemotherapy stalled their linear growth, beginning during the first course of induction; therefore, it will be important to evaluate whether their final height has been affected. The expected decrease in the final height was less than 3 cm in both male and female patients who received chemotherapy alone, but the linear growth was further affected by HCT. Nutritional and physical activity support must be continued for survivors to maintain a healthy weight during the off-therapy period, although the recommended approaches differ from those used during therapy. Endocrine evaluation should be considered for patients with short stature.19,20
Z-scores for BMI and weight were significantly higher at all time points in patients aged ≥10 years at diagnosis. This contrasts with the findings of studies of patients with ALL, which have shown that younger children are at risk for obesity during and/or after treatment.21-23 Obesity is more prevalent with older age in the general pediatric population,3 and as age is not considered as a risk factor in AML treatment, chemotherapy can have similar effects across all ages, thus preserving the age difference in Z-scores for BMI and weight at diagnosis. Moreover, an unhealthy lifestyle after treatment is more prevalent among older survivors than among younger survivors because of the more independent lifestyle of the former group.18,24,25
Previous studies of AML by the Children’s Cancer Group and St. Jude demonstrated that patients in unhealthy BMI categories (underweight or overweight/obese) at diagnosis had significantly worse survival and more treatment-related mortality, especially that due to infection and hemorrhage, when compared with healthy-weight individuals.7,8 However, in the current study with more recent protocol cohorts, there was no significant difference in relapse, survival, or treatment-related mortality across BMI category groups or Z-scores at diagnosis. We acknowledge that the patients who were treated at St. Jude on the AML 02 protocol and were 2 years of age or older partly overlap with the patients in our previous study, which examined patients in the AML 87, 91, 97, and 02 studies treated at all of the participating institutions.8 In recent decades, advances have been made in preventing and treating infections in patients with AML, including the introduction of standardized guidelines for antibiotic prophylaxis and management of neutropenic fever, better education for patient families and clinical staff, and early intervention by infectious disease consultants.26-29 Transfusion support and management of hyperleukocytosis have also improved.30 These advances in supportive care, as well as improvements in chemotherapy and transplantation, might have contributed to the outcomes being similar regardless of BMI status at diagnosis. However, although there were no differences in EFS or OS, higher weight Z-scores at diagnosis were associated with lower incidences of refractory/relapsed disease and higher incidences of death in first remission. Patients with higher weight Z-scores had received higher doses of chemotherapy, as compared with those given to the patients with ideal body weight, and this could have led to better anti-AML effects but worse toxic death. Although a higher BMI Z-score at diagnosis was associated with a higher incidence of death in first remission, the association did not reach statistical significance. For HCT recipients, both BMI and weight Z-scores at HCT were associated with higher incidences of death in remission. Therefore, it will be important to evaluate the effects of both weight Z-score and BMI Z-score in future studies to improve the management of the effects of AML treatment.
The changes in BMI Z-score were not associated with toxicities or death in remission. This may reflect the subtle decreases in BMI Z-scores during therapy, because both weight Z-scores and height Z-scores decreased during that period. However, a decrease in weight Z-score during the 2 induction-therapy courses was associated with an increased incidence of adverse effects, especially impairment of the gastrointestinal tract or hepatic function or infection/febrile neutropenia, and with an increased incidence of death in first remission. A decrease in weight Z-score can lead to or result from adverse effects, especially those involving the gastrointestinal tract, and other confounding factors and conditions can also play roles in this association. Weight loss, especially in the presence of mucositis, would have led to an increase in infection/febrile neutropenia after induction therapy. This association suggests the importance of early multidisciplinary interventions by nutritionists, pharmacists, gastroenterologists, and oncologists for better control of nausea/vomiting and to provide supplemental nutrition with high-calorie formula, appetite stimulants, enteral feeding, or parenteral nutrition. Previous studies showed that no standard nutrition protocols were being used in the pediatric oncology population,31-33 and this was the case in our study. Although parenteral nutrition was preferentially used during this study, enteral feeding is currently preferred as a safe way of providing nutrition for any child with an undamaged and functional gastrointestinal tract.32,34 Common nutritional intervention approaches should be developed and integrated into cancer treatment protocols.
This study had some limitations. Because of the disease relapses and/or individualized treatment strategies including transplant and salvage therapy, the numbers of patients declined over time as a result of censoring. As we had no information on whether patients had reached their final adult height, the longitudinal effects of chemotherapy on height Z-scores may have been underestimated, and we were unable to evaluate their impact on adverse effects or outcomes. Our study lacks information on other clinical factors that can contribute to body composition changes, such as physical activity and other anthropometric measurements (eg, waist circumference and waist-to-height ratio), as well as the effects of nutrition supports. However, to our knowledge, this is the first study to describe longitudinal changes in body composition in patients with AML and the associations of changes in weight Z-scores with outcomes.
In conclusion, the current study revealed a distinct pattern of body composition changes in pediatric patients with AML, showing a contrast in the changes in Z-scores for weight and BMI between the on-therapy and off-therapy periods and persistently low height Z-scores after the initiation of therapy. The recent advances in chemotherapy and supportive care contributed to the similar outcomes regardless of BMI status at diagnosis, but higher weight Z-scores were associated with less refractory/relapsed disease and higher incidences of death in remission. A decrease in weight Z-score during induction therapy was associated with toxicities and death in remission. Efforts to minimize weight loss during therapy and weight gain after therapy, along with close monitoring and intervention for short stature and supportive care for patients with a higher weight Z-score at diagnosis and/or a greater subsequent decrease in weight Z-score, can improve the quality of life of children and adolescents with AML.
Acknowledgments
The authors thank Keith A. Laycock, Editor in the Life Sciences, for scientific editing of the manuscript.
This work was supported by National Cancer Institute grant CA21765 and by the American Lebanese Syrian Associated Charities.
Authorship
Contribution: H.I. designed research; M.I., M.S., J.C.P., B.M.T., C.-H.P., R.C.R., J.E.R., and H.I. collected data; M.I., M.S., L.W., S.B.P., and H.I. analyzed and interpreted data; L.W. and S.B.P. performed statistical analysis; M.I., M.S., and H.I. wrote the manuscript; and all authors reviewed and edited the manuscript.
Conflict-of-interest disclosure: The authors declare no competing financial interests.
The funding organizations had no role in the design and conduct of the study; the collection, management, analysis, and interpretation of the data; the preparation, review, or approval of the manuscript; or the decision to submit the manuscript for publication. The content is solely the responsibility of the authors and does not necessarily represent the official views of the National Institutes of Health.
Correspondence: Hiroto Inaba, Department of Oncology, St. Jude Children’s Research Hospital, 262 Danny Thomas Place, Mail Stop 260, Memphis, TN 38105,. e-mail: hiroto.inaba@stjude.org.

