

Key Points
Early changes in ctDNA dynamics are prognostic in untreated MCL.
Bortezomib maintenance after bortezomib-based induction therapy does not improve outcome in untreated MCL.

Abstract
Mantle cell lymphoma (MCL) is biologically and clinically heterogeneous and would benefit from prognostic biomarkers to guide management. Circulating tumor DNA (ctDNA) is a novel prognostic biomarker in diffuse large B-cell lymphoma that may have applicability in MCL. We analyzed ctDNA dynamics in previously untreated patients with MCL who received induction therapy with bortezomib and DA-EPOCH-R for 6 cycles followed by random assignment to observation or bortezomib maintenance in responding patients in a prospective phase 2 study. Most patients also underwent initial treatment window of bortezomib alone prior to induction. Serum was collected pretreatment, after the window, after cycles 1 and 2, at the end of induction, and at each follow-up visit along with restaging computed tomography scans. Next-generation sequencing was used to identify and quantify ctDNA encoding the immunoglobulin receptor sequences in serum as markers of minimal residual disease. Fifty-three patients were enrolled, with a median follow-up of 12.7 years. Patients without detectable ctDNA after 2 cycles of induction had longer progression-free survival (PFS) and overall survival (OS) compared with those with detectable ctDNA (median PFS, 2.7 vs 1.8 years; overall P = .005; median OS, 13.8 vs 7.4 years; overall P = .03). Notably, in vivo assessment of ctDNA dynamics during the bortezomib window was not prognostic, and there was no difference in PFS or OS with bortezomib maintenance. ctDNA monitoring after induction showed that molecular relapse preceded clinical relapse in some cases. In conclusion, interim ctDNA negativity strongly correlates with improved survival and supports the investigation of response-adapted strategies. This trial was registered at www.clinicaltrials.gov as #NCT00114738.
Introduction
Mantle cell lymphoma (MCL) is biologically and clinically heterogeneous, resulting in highly variable outcomes.1 Management strategies of initial disease range from treatment deferral to intensive induction therapy.2-6 After induction therapy, responding patients frequently undergo autologous stem cell transplantation (ASCT) consolidation and/or extended rituximab maintenance.7,8 The continuous rate of relapse after ASCT suggests this strategy is neither curative nor justified in all patients.9 Although tissue-based molecular assays of tumor proliferation and consideration of histology and genetics of MCL can identify high-risk subgroups,10-13 patient-specific criteria to guide treatment strategies, such as treatment intensity and duration, are lacking.
DA-EPOCH-R (dose-adjusted infusional etoposide) has led to a complete response (CR) in >90% of patients with untreated MCL, but most patients progress within 4 years.14,15 Bortezomib, a proteasome inhibitor, has been shown to improve outcome in MCL when combined with induction chemotherapy.16-20 A randomized phase 3 study demonstrated that VR-CAP (bortezomib with rituximab, cyclophosphamide, doxorubicin, and prednisone) improves CR and both progression-free survival (PFS) and overall survival (OS) compared with R-CHOP (rituximab plus cyclophosphamide, doxorubicin, vincristine, and prednisone) in patients ineligible for ASCT.16,17 The median duration of CR in patients treated with VR-CAP was markedly longer (42.1 vs 18.0 months), suggesting a subgroup of patients with MCL are uniquely sensitive to bortezomib.21 Bortezomib has also been administered as maintenance or consolidation therapy, but its benefit has not been established in these settings.18,22,23
The depth of response to induction therapy in MCL can be refined beyond conventional response criteria through the analysis of minimal residual disease (MRD). MCL involves the recurrent chromosomal translocation t(11;14), resulting in aberrant expression of cyclin D1, which serves as a reliable marker of MRD. Multiple studies have shown that MRD analyzed by polymerase chain reaction (PCR) of t(11;14) is an independent predictor of clinical outcome in MCL.24-27 These studies, however, have focused on patients undergoing ASCT and have not addressed the prognostic impact of MRD during induction therapy. The risk of MCL recurrence after induction treatment is ever present, and surveillance imaging scans cannot identify molecular or low tumor volume recurrences.28 Indeed, reliable molecular assays would be of significant value to study and guide treatment decisions before clinical relapse. As proof of principle, 1 study demonstrated that rituximab use after ASCT could be guided by MRD to delay clinical relapse.27 Nonetheless, MRD is currently not standard in MCL, and post-induction treatment is decided empirically.
Next-generation sequencing (NGS)–based assays can be used to detect circulating tumor DNA (ctDNA) encoding the immunoglobulin receptor sequences in the peripheral blood of patients with B-cell lymphoma.29-31 These assays can be used to detect and quantify MRD in the absence of a positive PCR assay.32 Circulating tumor DNA has been shown to be an independent prognostic marker in diffuse large B-cell lymphoma, and is likely to be of use in MCL as well.29,30,33 In a small study of 24 patients with MCL, ctDNA was detectable in 17 (71%) and was successfully used to track serial samples throughout therapy with targeted agents.34 Indeed, the ability of ctDNA to provide a continuous reassessment of tumor burden during and after therapy may provide a dynamic and precise method for individualizing treatment when compared with baseline factors.35 We report that early ctDNA dynamics predict clinical outcome in previously untreated patients with MCL treated with bortezomib-based induction therapy without ASCT.
Patients and methods
Study design and patients
We conducted a prospective phase 2 window study of bortezomib alone followed by induction with bortezomib and DA-EPOCH-R in untreated MCL. Patients who achieved at least a partial response (PR) to induction were randomly assigned to maintenance bortezomib or observation. Patients were enrolled between September 2005 and January 2016, and the data lock was in March 2021. Eligibility included a histologic diagnosis of MCL, no prior treatment, age ≥18 years, Eastern Cooperative Oncology Group performance status ≤3, adequate organ function unless disease related, negative pregnancy test in women of childbearing potential, and other criteria (data supplement). Patients with HIV, peripheral neuropathy grade ≥2, or central nervous system involvement were excluded.
Trial oversight
The study was sponsored by the Lymphoid Malignancies Branch of the National Cancer Institute. Bortezomib was provided by Millennium Pharmaceuticals (Takeda Oncology Company). The study was conducted in accordance with the principles of the Declaration of Helsinki and approved by the National Cancer Institute institutional review board. All patients provided written informed consent. Exemption from institutional review board review was obtained for the deidentified analysis of ctDNA performed by Adaptive Biotechnologies.
Study treatment
Treatment was divided into 3 parts. Part A included IV bortezomib (1.3 mg/m2) on days 1, 4, 8, and 11 over 21 days. Part B was induction therapy with DA-EPOCH-R36 plus IV bortezomib (1.3 mg/m2) on days 1 and 4 of a 21-day cycle for up to 6 cycles. The doses of etoposide, doxorubicin, and cyclophosphamide were pharmacodynamically adjusted based on neutrophil nadir, and all patients received filgrastim until absolute neutrophil recovery (supplemental Figure 1). Vincristine was dose reduced by 50% for grade 1 motor neuropathy or sensory neuropathy with pain and was held for grade ≥2 neuropathy. If neuropathy resolved with dose reduction, vincristine could be reescalated. In Part C, patients who maintained PR or better 12 weeks after induction therapy without grade ≥2 neuropathy were randomly assigned to observation or maintenance IV bortezomib (1.3 mg/m2) on days 1, 4, 8, and 11 of a 56-day cycle for up to 10 cycles. Patients randomly assigned to observation were allowed to cross over to maintenance at progression. All patients received prophylaxis to prevent Pneumocystis jiroveci and herpes zoster reactivation.
Study assessments and clinical end points
Pretreatment evaluation included laboratory investigations, computed tomography (CT) and [18F]fluorodeoxyglucose (FDG) positron emission tomography (PET) scans, bone marrow aspirate and biopsy, colonoscopy with blind biopsy, and peripheral blood flow cytometry (data supplement). Tumor response was assessed by CT scan using the International Working Group criteria after the bortezomib window and after cycles 4 and 6 of induction therapy.37 FDG-PET scans were performed after cycle 6, and best overall response was determined by the Lugano response criteria.38 Surveillance imaging CT scans were performed every 4 months for 2 years, every 6 months during years 2 to 4, and then annually.
Research samples including 10 mL of serum for ctDNA were prospectively collected at protocol-defined time points, including pretreatment, after the bortezomib window, after cycles 1 and 2 of induction therapy, at the end of induction, and at each follow-up visit. Samples were processed immediately and stored at −70°C for future analysis (data supplement).
Tumor clonotypes were identified from pretreatment formalin-fixed paraffin-embedded (FFPE) specimens via PCR amplification of immunoglobulin heavy chain gene (IGH)–VDJ, IGH-DJ, and IGκ or IGλ regions using universal consensus primers, along with BCL1/BCL2, followed by NGS.29,39 In patients without FFPE samples, tumor clonotypes were identified from other pretreatment samples, including bone marrow clot or frozen tumor cells. All tumor clonotypes were tracked in serum throughout therapy and during surveillance as markers of MRD. The unit of quantitation was the number of lymphoma molecules (1 tumor cell equivalent) per milliliter, with a limit of detection of 1 lymphoma molecule per sample.
FDG-PET scans used a 3-dimensional time-of-flight mode Philips Gemini TF FDG-PET/CT scanner. Three nuclear medicine physicians independently and blindly assessed the images. Regions of interest were drawn over the entire lesion(s), and maximum and mean standardized uptake values (SUVs) were obtained. Volumes of interest (VOIs) ∼1 cm in diameter were drawn near the aortic root to determine the mean blood pool, and a VOI ∼3 cm was drawn over the normal liver. SUVmax was defined as the SUV of the maximum intensity voxel within the VOI. Metabolic tumor volume (MTV) was calculated using a 41% threshold for the segmentation step.40 Total MTV (TMTV) was the sum of all the metabolic volumes of all lesions. Spleen was considered involved if focal uptake or diffuse uptake was >150% of the liver background.41 Total lesion glycolysis (TLG) was calculated by multiplying MTV of the area showing the highest uptake by SUVmean of the lesion. Whole-body TLG (TLG-W) was the sum TLG of all lesions.
The primary end point was investigator-assessed PFS after bortezomib maintenance vs observation. Secondary objectives included response to bortezomib monotherapy, toxicity profile, and OS. Exploratory objectives included the prognostic utility of ctDNA, including correlations with traditional prognostic markers.
Statistical analysis
PFS was calculated from the date of enrollment until the date of progression, death, or last follow-up. Median follow-up was calculated as median intervals from enrollment until final data cutoff. Overall survival was calculated from the enrollment date until date of death or last follow-up. The Kaplan-Meier method was used for survival analysis, and a 2-tailed log-rank test was used to determine the significance of the difference. Association of pretreatment ctDNA levels with PFS was determined using a Cox proportional hazards model. Continuous parameters were compared between 2 groups using the Mann-Whitney test or t test and compared among 3 groups with analysis of variance. Comparisons between pairs of dichotomous parameters were made using Fisher’s exact test, and comparisons of ordered categorical parameters between 2 groups were made using an exact Cochran-Armitage test for trend. Correlations between ctDNA and other variables were determined using Spearman correlation analysis, with |r| > 0.70 indicating a strong correlation.
Results
Patient characteristics
Fifty-three patients were enrolled; 41 (77%) were men, and the median age was 59 years (range, 41-75), including 24 (45%) age ≥60 years (Table 1). According to MCL International Prognostic Index (MIPI) risk categories, 25 patients (47%) were low risk, 19 (36%) intermediate risk, and 9 (17%) were high risk. Elevated lactate dehydrogenase levels were observed in 21 patients (40%). Clinical characteristics included stage IV disease by the Ann Arbor staging system and ≥1 site of extranodal involvement in all 53 patients (100%), with peripheral blood by flow cytometry (100%), bone marrow (96%), and gastrointestinal tract (77%) being the most common sites. Seven patients (13%) had blastoid morphology, and the Ki-67 proliferation index was <10% in 12 (27%), 10% to 29% in 23 (52%), and ≥30% in 9 patients (20%); data were missing in 9 cases.
Patient characteristics
| Characteristic | All patients (N = 53) | Bortezomib maintenance (n = 14) | Observation (n = 16) | Not able to randomly assign (n = 23) |
|---|---|---|---|---|
| Age, y | ||||
| Median (range) | 59 (41-75) | 54 (42-73) | 58 (43-72) | 63 (46-76) |
| ≥60 | 24 (45) | 6 (43) | 6 (38) | 12 (52) |
| Male sex | 41 (77) | 12 (86) | 13 (81) | 16 (70) |
| MIPI risk category | ||||
| Low | 25 (47) | 8 (57) | 8 (50) | 9 (39) |
| Intermediate | 19 (36) | 5 (36) | 7 (44) | 7 (30) |
| High | 9 (17) | 1 (7) | 1 (6) | 7 (30) |
| Elevated LDH | 21 (40) | 5 (36) | 6 (38) | 10 (43) |
| Nonnodal disease | 7 (13) | 2 (14) | 2 (13) | 3 (13) |
| Extranodal involvement | ||||
| Peripheral blood | 53 (100) | 14 (100) | 16 (100) | 23 (100) |
| Bone marrow | 51 (96) | 14 (100) | 15 (94) | 22 (96) |
| Gastrointestinal tract* | 40 (77) | 11 (78) | 14 (88) | 15 (68) |
| Histologic subtype | ||||
| Blastoid | 7 (13) | 1 (7) | 2 (12) | 4 (17) |
| Classic | 46 (87) | 13 (93) | 14 (88) | 19 (83) |
| Ki-67 status, % | ||||
| <10 | 12 (27) | 2 (18) | 3 (25) | 7 (33) |
| 10-29 | 23 (52) | 7 (64) | 5 (42) | 11 (52) |
| ≥30 | 9 (20) | 2 (18) | 4 (33) | 3 (14) |
| Missing | 9 | 3 | 4 | 2 |
Data are presented as n (%) unless otherwise indicated.
LDH, lactate dehydrogenase; MIPI, Mantle Cell Lymphoma International Prognostic Index.
One patient in the group that could not be randomly assigned was not evaluated for gastrointestinal tract involvement.
Clinical outcome
Six patients (11%) did not participate in the bortezomib window because of clinical reasons and proceeded directly to induction therapy (Figure 1). Forty-seven patients participated in the bortezomib window, and 39 had measurable disease by CT (supplemental Figure 2). Tumor size decreased on CT in 25 patients (64%), including 4 (11%) who achieved a PR to bortezomib. Tumor size increased or did not change after bortezomib in 14 patients (36%). Fifty-one patients (96%) completed all 6 cycles of induction therapy. Thirty patients (57%) were randomly assigned to bortezomib maintenance (n = 14) or observation (n = 16). Twenty-three patients (43%) were ineligible for random assignment because of peripheral neuropathy (n = 17), lack of response (n = 4), withdrawal of consent (n = 1), and hemorrhage (n = 1). Of the 14 patients in the maintenance arm, 12 (86%) achieved a CR after induction therapy, and all 16 patients in the observation arm were in CR after induction therapy. Four patients (25%) crossed over to bortezomib maintenance at disease progression.
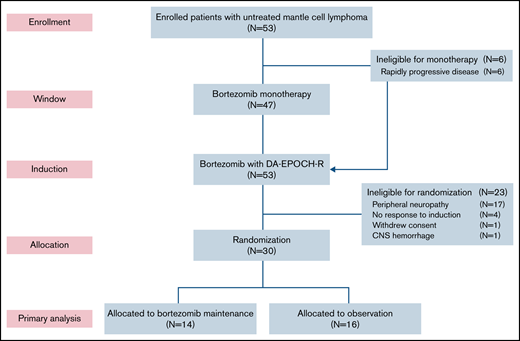
CONSORT diagram. Patients first received bortezomib as monotherapy in a window for 21 days, except for those with rapidly progressive disease, who proceeded directly to induction therapy. Patients who responded to induction and did not have significant peripheral neuropathy were randomly assigned to bortezomib maintenance or initial observation. DA-EPOCH-R, dose-adjusted etoposide, doxorubicin, and cyclophosphamide with prednisone, vincristine, and rituximab; CNS, central nervous system.
CONSORT diagram. Patients first received bortezomib as monotherapy in a window for 21 days, except for those with rapidly progressive disease, who proceeded directly to induction therapy. Patients who responded to induction and did not have significant peripheral neuropathy were randomly assigned to bortezomib maintenance or initial observation. DA-EPOCH-R, dose-adjusted etoposide, doxorubicin, and cyclophosphamide with prednisone, vincristine, and rituximab; CNS, central nervous system.
With a median potential follow-up of 12.7 years, the median PFS was 2.4 years (95% confidence interval [CI], 1.6-2.9), and the median OS was 10.9 years (95% CI, 6.9 to not estimated [NE]; Figure 2A-B). Among the 30 randomly assigned patients, there was no difference in PFS or OS for bortezomib maintenance vs observation (median PFS, 2.3 years [95% CI, 1-4.1] vs 2.6 years [95% CI, 1.6-7.6], P = .39; median OS, 10.9 years [95% CI, 3.4 to NE] vs not reached, overall P = .32; Figure 2C-D). We also found no difference in PFS or OS for patients receiving bortezomib maintenance when compared with 34 patients who did not receive bortezomib maintenance (combining those randomly assigned to observation and those ineligible for random assignment; median PFS, 2.3 years (95% CI, 1.0-4.1) vs 2.8 years (95% CI, 1.7-3.9), overall P = .58; median OS, 10.9 years (95% CI, 3.4 to NE) vs 13.8 years (95% CI, 7.4-13.8), overall P = .42; supplemental Figures 3 and 4).

Kaplan-Meier estimates of PFS and OS of patients enrolled with untreated MCL. Median follow-up was 12.7 years. (A) The 5-year PFS of all patients was 23.1% (95% CI, 13-35). (B) The 5-year OS of all patients was 78.3% (95% CI, 64-87). (C) The 5-year PFS of patients randomly assigned to bortezomib maintenance vs observation was 14.3% (95% CI, 2-37) vs 37.5% (95% CI, 15-60; P = .39). (D) The 5-year OS of patients randomly assigned to bortezomib maintenance vs observation was 69.2% (95% CI, 37-87) vs 87.5% (95% CI, 59-97; P = .32).
Kaplan-Meier estimates of PFS and OS of patients enrolled with untreated MCL. Median follow-up was 12.7 years. (A) The 5-year PFS of all patients was 23.1% (95% CI, 13-35). (B) The 5-year OS of all patients was 78.3% (95% CI, 64-87). (C) The 5-year PFS of patients randomly assigned to bortezomib maintenance vs observation was 14.3% (95% CI, 2-37) vs 37.5% (95% CI, 15-60; P = .39). (D) The 5-year OS of patients randomly assigned to bortezomib maintenance vs observation was 69.2% (95% CI, 37-87) vs 87.5% (95% CI, 59-97; P = .32).
Toxicity
Grade ≥3 neutropenia occurred in 56% of cycles, including ≥1 episode of febrile neutropenia in 21 patients (40%), and 8% of cycles, respectively. Grade ≥3 thrombocytopenia occurred in 36% of cycles (supplemental Table 1). The most important nonhematologic toxicity was neuropathy. Grade ≥2 neuropathy occurred in 28 patients (53%), including 8 patients (15%) with grade ≥3 neuropathy (supplemental Table 2). Grade ≥2 neuropathy improved to grade 1 in 4 patients (14%) and resolved completely in 4 patients (14%) each. Seventeen (33%) and 24 patients (45%) required dose reduction of bortezomib and vincristine, respectively. Both bortezomib and vincristine were discontinued in 7 patients (13%) because of neuropathy, and an additional 2 patients (4%) discontinued bortezomib, 1 each because of grade 2 neuropathy and elevated creatinine.
Tumor clonotype identification and tracking
Of 53 enrolled patients, 52 (98%) had pretreatment tissue samples for tumor clonotype identification, including 46 with FFPE samples and 3 each with frozen tumor cells or a bone marrow clot specimen, respectively (supplemental Figure 5). At least 1 tumor clonotype was identified in all 46 patients (100%) with FFPE samples and all 3 patients (100%) with frozen tumor cells. One patient (33%) with only a bone marrow clot section available had a tumor clonotype identified. Overall, 50 patients (96%) with pretreatment tissue samples had ≥1 tumor clonotype identified for MRD tracking. Forty-two patients (84%) had ≥1 tumor clonotype identified, with a median of 3 clonotypes (range, 1-7) per patient. IGH, IGK, and IGL sequences were identified in 50 (100%), 32 (64%), and 21 patients (42%), respectively. Tumor clonotypes were successfully tracked in 587 serum samples (96%) throughout therapy, with a median serum volume assessed of 0.52 mL (range, 0.25-0.89). The limit of detection was experimentally determined to be 1.9 lymphoma molecules per mL, but the experiments were not designed to resolve differences between patients with 1 vs >1 clonotype.
Prognostic value of pretreatment ctDNA
We hypothesized that pretreatment ctDNA may provide a quantitative measure of tumor burden and be associated with prognostic factors. Of 48 patients with a pretreatment serum sample, 47 (98%) had detectable ctDNA, with a median concentration of 743.0 lymphoma molecules per mL (range, 0 to 1 × 10⁵) before receiving treatment (Figure 3A). Blastoid histology was associated with higher median ctDNA compared with classic histology (median, 4392.2 lymphoma molecules per mL [range 1631-9158] vs 427.5 lymphoma molecules per mL [range 0 to 1 × 10⁵]; P = .0025). Significant differences in ctDNA were observed across MIPI risk groups, with median concentrations of 143.1 (range, 3.9 to 2.27 × 10³) in low-risk, 1419.1 (range, 0 to 2.53 × 10⁴) in intermediate-risk, and 6518.9 (42 to 1.01 × 10⁵) lymphoma molecules per mL in high-risk patients (global P = .0094; Figure 3B). This was driven largely by the difference in the median ctDNA of low-risk compared with high-risk patients by MIPI (P = .0004). We also observed a trend in ctDNA level across Ki67 categories, with median concentrations of 77.5 (range, 1.4-33 166) for Ki67 <10%, 453.1 (range, 0-4905) for Ki67 of 10% to 29%, and 1529.1 (range, 59-3073) lymphoma molecules per mL for Ki-67 ≥30% (P = .33; Figure 3C). Patients with nonnodal disease had a higher ctDNA level compared with those with nodal disease (median, 6076.5 molecules per mL [range, 24.2-33 166] vs 540.0 molecules per mL [range, 1.4-101 008]; P = .04), despite no difference in absolute lymphocyte count (supplemental Figure 6).
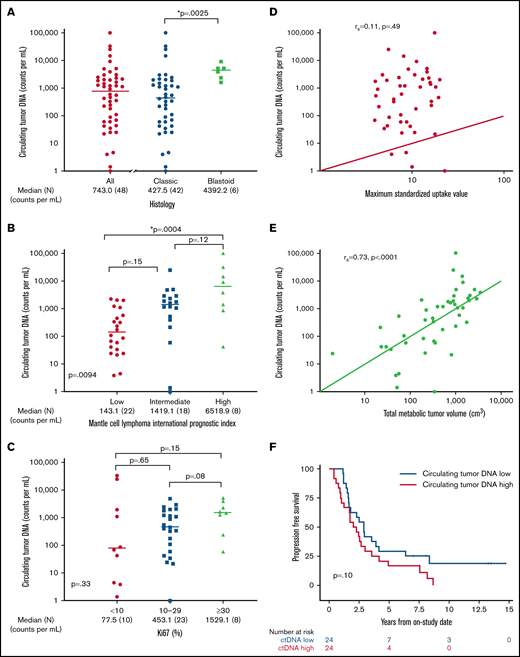
Pretreatment ctDNA is associated with other prognostic variables. (A) Scatter plot shows the median pretreatment ctDNA for all patients and the relationship of pretreatment ctDNA in classic histology compared with blastoid histology. (B) Scatter plot shows pretreatment ctDNA across MIPI categories. (C) Scatter plot demonstrates the relationship of pretreatment ctDNA and the Ki67 proliferation index. (D) Spearman correlation of pretreatment ctDNA and SUVmax on baseline FDG-PET scan. (E) Spearman correlation of pretreatment ctDNA and TMTV on baseline FDG-PET scan. (F) Kaplan-Meier estimates of PFS in patients above the median (ctDNA high) compared with below the median (ctDNA low). *P < .05.
Pretreatment ctDNA is associated with other prognostic variables. (A) Scatter plot shows the median pretreatment ctDNA for all patients and the relationship of pretreatment ctDNA in classic histology compared with blastoid histology. (B) Scatter plot shows pretreatment ctDNA across MIPI categories. (C) Scatter plot demonstrates the relationship of pretreatment ctDNA and the Ki67 proliferation index. (D) Spearman correlation of pretreatment ctDNA and SUVmax on baseline FDG-PET scan. (E) Spearman correlation of pretreatment ctDNA and TMTV on baseline FDG-PET scan. (F) Kaplan-Meier estimates of PFS in patients above the median (ctDNA high) compared with below the median (ctDNA low). *P < .05.
We also explored the relationship of pretreatment ctDNA with baseline FDG-PET scan. Across all patients, the median SUVmax was 8.8 (range, 3.9-22.7), TMTV was 518.6 cm3 (range, 1.9-3859.2), and TLG-W was 1808.4 cm3 (range, 4.1-19 025.2; supplemental Table 3). Although pretreatment ctDNA did not correlate with SUVmax (r = 0.11; P = .49; Figure 3D), it was strongly correlated with TMTV (r = 0.73; P < .0001; Figure 3E) and TLG-W (r = 0.71; P < .0001; supplemental Figure 7). Progression-free survival was not statistically different between patients with pretreatment ctDNA above the median (ctDNA high) and those with ctDNA below the median (ctDNA low) - median, 2.1 years (95% CI, 1.0-3.0) vs 2.9 years (95% CI, 1.6-4.1); P = .10, respectively; Figure 3F. Overall survival was also not different between the ctDNA high and ctDNA low groups (median, 10.9 years [95% CI, 4.0 to NE] vs 13.8 years [95% CI, 6.8 to NE]; P = .12; supplemental Figure 8). However, when we analyzed baseline ctDNA as a continuous variable, we noted that higher pretreatment ctDNA level was modestly associated with shorter PFS (hazard ratio, 1.4; 95% CI, 1.0-2.0; P = .03) and OS (hazard ratio, 1.883; 95% CI, 1.2-3.1; P = .01).
ctDNA dynamics during induction therapy
We hypothesized that ctDNA dynamics during treatment may predict clinical outcome. First, we assessed changes in ctDNA after the bortezomib window in 41 patients (supplemental Figure 9). The overall change in ctDNA after bortezomib monotherapy demonstrated a broad distribution, with a median change of −30% (range, −100% to +531%). Twenty-six patients (63%) had a decrease in ctDNA, including 15 whose ctDNA decreased ≥50% from baseline. Patients with a decrease in ctDNA of ≥50% after bortezomib did not have improved PFS compared with those with a <50% decrease (median, 3.5 years [95% CI, 1.9-2.9] vs 1.9 years [95% CI, 1.7-7.6]; P = .18), but these patients did demonstrate a weak trend toward improved PFS (supplemental Figure 10). We analyzed the concordance of change in ctDNA during the window with change in tumor size on CT in 36 patients. In most patients, change in both ctDNA and CT scan were concordant, but we noted only a modest (r = 0.39) correlation (supplemental Figure 11).
We also explored the prognostic significance of ctDNA dynamics during induction therapy compared with post-induction radiographic response in 50 evaluable patients. Forty-two patients (84%) achieved CR, 5 (10%) achieved PR, and 3 (6%) had no response to induction therapy by Lugano criteria (supplemental Figure 12). Only 3 patients (7%) who achieved CR had detectable ctDNA after induction therapy, whereas 7 (88%) who achieved less than a CR had persistently detectable ctDNA. Overall, the number of patients with no detectable ctDNA was 14 (28%) after 1 cycle and 23 (46%) after 2 cycles of induction therapy and 40 (80%) at the end of induction (Figure 4A), Notably, among the 8 patients who achieved less than a CR at the end of induction, an early look at ctDNA after 1 and 2 cycles of induction showed detectable sequences in 8 (100%) and 7 patients (88%), respectively, suggesting early evaluation may predict treatment resistance (Figure 4B).
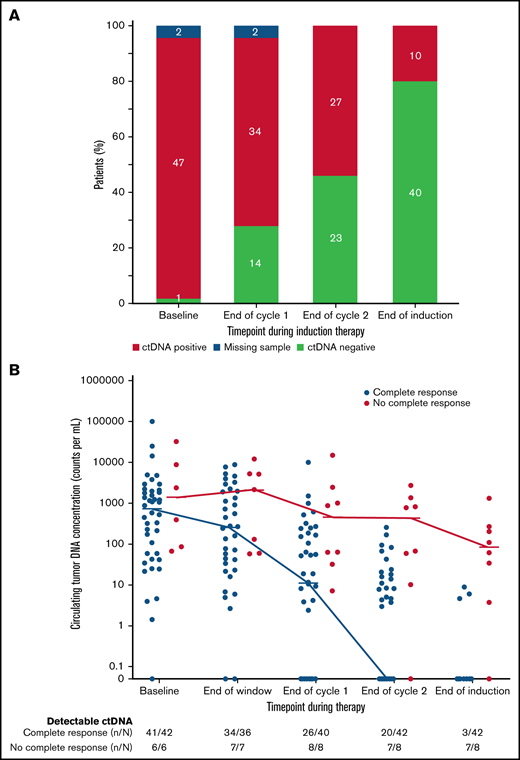
Circulating tumor DNA dynamics during induction therapy. (A) Qualitative ctDNA response to induction therapy after 1 cycle, after 2 cycles, and at the end of induction therapy. (B) Quantitative ctDNA response after the bortezomib window and after 1 cycle, after 2 cycles, and at the end of induction therapy.
Circulating tumor DNA dynamics during induction therapy. (A) Qualitative ctDNA response to induction therapy after 1 cycle, after 2 cycles, and at the end of induction therapy. (B) Quantitative ctDNA response after the bortezomib window and after 1 cycle, after 2 cycles, and at the end of induction therapy.
We next assessed the clinical significance of achieving undetectable ctDNA at landmark time points during induction therapy and found that patients with undetectable vs detectable ctDNA had a better outcome. The median PFS and OS of patients without or with detectable ctDNA at end of induction therapy were 2.6 years (95% CI, 1.7-3.9) vs 1.5 years (95% CI, 0.4-2.0; P = .003) and 12.4 years (95% CI, 7.6 to NE) vs 3.9 years (95% CI, 0.4 to NE; P = .02), respectively (Figure 5A-B). Notably, ctDNA dynamics after the first 2 cycles also predicted survival. The median PFS and OS for patients without detectable ctDNA after 2 cycles of induction therapy were significantly better compared with PFS and OS in those with detectable ctDNA (2.7 years [95% CI, 1.7-8.1] vs 1.8 years [95% CI, 1.2-2.9]; P = .005 and 13.8 years [95% CI, 5.8 to NE] vs 7.4 years [95% CI, 5.1-10.9]; P = .03, respectively; Figure 5C-D). Furthermore, the median PFS for patients without detectable ctDNA after only 1 cycle of induction therapy was improved compared with that in those with detectable ctDNA (7.3 years [95% CI, 2.9 to NE] vs 1.7 years [95% CI, 1.2-2.5]; P = .002; Figure 5E), but the median OS was not statistically different (13.8 years [95% CI, 5.5-13.8] vs 7.6 years [95% CI, 5.8-12.4]; P = .07; Figure 5F).
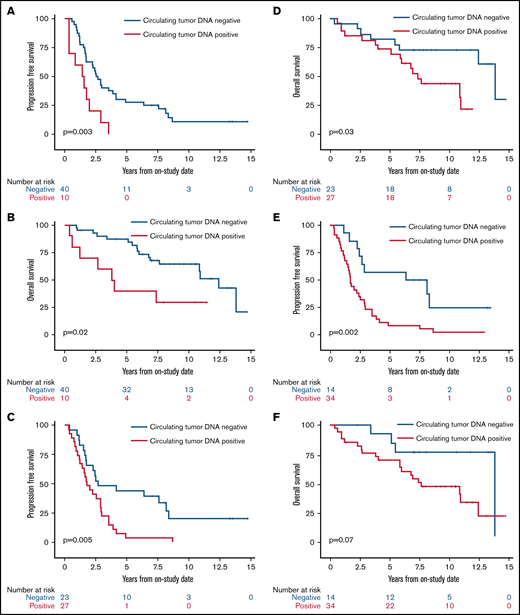
Kaplan-Meier estimates of PFS and OS based on ctDNA detection at landmark time points during induction therapy. (A) PFS in patients with no detectable ctDNA (blue) compared with patients with detectable ctDNA (red) at the end of induction therapy. (B) OS in patients with no detectable ctDNA (blue) compared with patients with detectable ctDNA (red) at the end of induction therapy. (C) PFS in patients with no detectable ctDNA (blue) compared with patients with detectable ctDNA (red) after 2 cycles of induction therapy. (D) OS in patients with no detectable ctDNA (blue) compared with patients with detectable ctDNA (red) after 2 cycles of induction therapy. (E) PFS in patients with no detectable ctDNA (blue) compared with patients with detectable ctDNA (red) after 1 cycle of induction therapy. (F) OS in patients with no detectable ctDNA (blue) compared with patients with detectable ctDNA (red) after 1 cycle of induction therapy.
Kaplan-Meier estimates of PFS and OS based on ctDNA detection at landmark time points during induction therapy. (A) PFS in patients with no detectable ctDNA (blue) compared with patients with detectable ctDNA (red) at the end of induction therapy. (B) OS in patients with no detectable ctDNA (blue) compared with patients with detectable ctDNA (red) at the end of induction therapy. (C) PFS in patients with no detectable ctDNA (blue) compared with patients with detectable ctDNA (red) after 2 cycles of induction therapy. (D) OS in patients with no detectable ctDNA (blue) compared with patients with detectable ctDNA (red) after 2 cycles of induction therapy. (E) PFS in patients with no detectable ctDNA (blue) compared with patients with detectable ctDNA (red) after 1 cycle of induction therapy. (F) OS in patients with no detectable ctDNA (blue) compared with patients with detectable ctDNA (red) after 1 cycle of induction therapy.
We next analyzed if the achievement of undetectable ctDNA after cycle 1 or 2 of induction therapy could risk stratify pretreatment prognostic subgroups. In patients with a low-risk MIPI score, achievement of undetectable ctDNA after cycle 1 was associated with longer PFS compared with those with detectable levels (median, 8.4 years [95% CI, 2.3 to NE] vs 1.7 years [95% CI, 1.2-2.9]; P = .02; supplemental Figure 13A). Similarly, achievement of undetectable ctDNA after cycle 2 was associated with longer PFS compared with those with detectable levels (median, 4.2 years [95% CI, 1.5 to NE] vs 1.8 years [95% CI, 1.2-3.5]; P = .03; supplemental Figure 13B). Achievement of undetectable ctDNA after cycle 1 or 2 was not associated with longer PFS in patients with an intermediate- or high-risk MIPI score (data not shown).
In patients with low Ki-67 proliferation index (<10%), achievement of undetectable ctDNA after cycle 1 or 2 was associated with longer PFS compared with those with detectable levels (median, 8.1 vs 1.1 years; P = .02; supplemental Figure 14A and 7.5 vs 1.0 years; P = .01; supplemental Figure 14B, respectively). Achievement of undetectable ctDNA after cycle 1 or 2 was not associated with longer PFS in patients with an intermediate (10% to 29%) or high (>30%) Ki-67 proliferation index (data not shown).
We were interested to know if the timing of becoming undetectable by ctDNA was significant. We compared the outcome of patients who became undetectable after cycle 1 or 2 (early molecular response) with that of patients who did not achieve undetectable levels until the end of induction (late molecular response). Of 34 patients with detectable ctDNA after cycle 1, 24 (71%) became undetectable at the end of induction, and these patients had shorter PFS compared with those with undetectable levels after cycle 1 (median, 1.6 years [95% CI, 0.8-2.6] vs 6.8 years [95% CI, 1.9 to NE]; P = .01; supplemental Figure 15A). Similarly, of 27 patients with detectable ctDNA after cycle 2, 18 (67%) became undetectable at the end of induction, and these patients had shorter PFS compared with those undetectable after cycle 2 (median, 2.0 years [95% CI, 0.8-2.6] vs 6.8 years [95% CI, 1.3-7.7]; P = .02; supplemental Figure 15B).
ctDNA as a marker of early relapse
Forty-seven patients completed induction therapy and proceeded to Part C of therapy (maintenance or observation; Figure 6). Of 40 patients with no detectable ctDNA after induction therapy, 6 (15%) remained free from progression at a median of 9 years after induction therapy, with no detectable ctDNA at each time point. Three of these patients were in the observation arm, 2 were in the maintenance arm, and 1 was not randomly assigned. Interestingly, the median pretreatment ctDNA for these long-term nonprogressors was lower than that for progressors (37.86 lymphoma molecules per mL [range, 1.4-1100] vs 1131.98 lymphoma molecules per mL [range, 0 to 1 × 10⁵]; P = .013; supplemental Table 4). Only 1 (17%) of 6 long-term nonprogressors had nonnodal disease. Thirty-four patients (72%) without detectable ctDNA at the end of induction relapsed after a median of 22.8 months (range, 2-98). In 21 (62%) of these cases, ctDNA became detectable before or coincident with radiologic progression, with a median lead time of 7.2 months (range, 0-74).
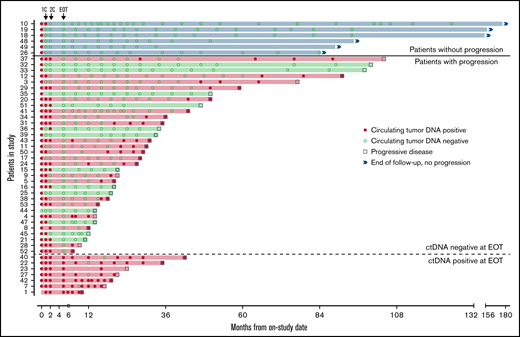
Circulating tumor DNA after induction therapy. Patients (n = 47) who responded to induction therapy and proceeded to part C of therapy (maintenance or observation) were included. Serum collected at protocol-defined time points was analyzed blinded to clinical outcomes for the detection of ctDNA (red circle) or absence of detectable ctDNA (green circle). Six patients (blue shade and above bold line) had no detectable ctDNA at end of induction therapy (EOT) and were without radiologic progression at the time of data cutoff. Thirty-four patients (below bold line and above dotted line) had no detectable ctDNA at EOT and were monitored until radiologic progression (square). Seven patients (below dotted line) had detectable ctDNA at EOT and were monitored until radiologic progression. Twenty-eight patients (red shade) progressed and had ctDNA positivity at the time of or before progression, whereas 13 patients (green shade) progressed with no prior detectable ctDNA. 1C, end of the first cycle of induction therapy; 2C, end of the second cycle of induction therapy.
Circulating tumor DNA after induction therapy. Patients (n = 47) who responded to induction therapy and proceeded to part C of therapy (maintenance or observation) were included. Serum collected at protocol-defined time points was analyzed blinded to clinical outcomes for the detection of ctDNA (red circle) or absence of detectable ctDNA (green circle). Six patients (blue shade and above bold line) had no detectable ctDNA at end of induction therapy (EOT) and were without radiologic progression at the time of data cutoff. Thirty-four patients (below bold line and above dotted line) had no detectable ctDNA at EOT and were monitored until radiologic progression (square). Seven patients (below dotted line) had detectable ctDNA at EOT and were monitored until radiologic progression. Twenty-eight patients (red shade) progressed and had ctDNA positivity at the time of or before progression, whereas 13 patients (green shade) progressed with no prior detectable ctDNA. 1C, end of the first cycle of induction therapy; 2C, end of the second cycle of induction therapy.
In the other 13 patients (38%), ctDNA remained persistently undetectable despite radiologic progression. In 6 of these 13 cases, relapse was isolated to 1 anatomic site, including cervical node (n = 2), maxilla (n = 1), ileum (n = 1), testis (n = 1), and spinal cord (n = 1). In 4 cases, no serum was available within 12 months of progression, and in 3 cases, ctDNA remained undetectable despite disease relapse at multiple sites. All 7 patients (15%) with persistently detectable ctDNA after induction therapy progressed after a median of 14.4 months (range, 5-37), and ctDNA remained detectable at most time points in both the bortezomib maintenance (n = 3) and observation arms (n = 4). In these patients, a pattern of sharp increases in ctDNA was noted preceding radiologic progression (supplemental Figure 16).
Discussion
We prospectively assessed the utility of ctDNA dynamics before and during initial therapy for MCL. Circulating tumor DNA dynamics as early as after 1 cycle of induction therapy correlated with CR and clinical outcome. Based on an NGS-based assay of ctDNA encoding the immunoglobulin receptor sequences, we showed that tumor clonotypes suitable for tracking in peripheral blood were identifiable in virtually all cases in which a pretreatment high disease burden sample was available. Pretreatment ctDNA as a continuous parameter was prognostic in our study, and we showed that it was strongly correlated with measures of overall tumor burden, including TMTV and TLG-W from baseline FDG-PET scans and MIPI. Furthermore, serial monitoring of ctDNA after induction therapy identified molecular relapse before clinical relapse by months in many cases, although the sensitivity was limited when relapse was isolated to a single anatomic site and/or when the monitoring interval was >6 months. This may also be related to the quantity of serum available at each time point; a higher volume of blood may result in better outcome with ctDNA. Interestingly, a small subset of patients with durable remission without clinical relapse also had persistently undetectable ctDNA years after therapy, suggesting that not all patients with MCL require consolidation or maintenance. Clinically, there was no benefit of bortezomib maintenance after induction treatment, and further study with this regimen is not indicated.
Our results extend and expand upon prior observations that achieving molecular remission after ASCT correlates with better survival in MCL.24-27 Because a suitable molecular marker is not found in up to 30% of patients with methods such as allele-specific oligonucleotide quantitative PCR for BCL1/IGH and clonal IGH rearrangements, our results indicate that NGS-based methods that do not rely on the presence of circulating lymphoma cells have broader applicability. Furthermore, ctDNA obviates the need for invasive bone marrow biopsies and allows serial monitoring.
We found a strong association between pretreatment ctDNA and tumor burden based on analysis of TMTV and TLG-W from pretreatment PET scans, which are prognostic in MCL.41 Interestingly, we did not observe a correlation with pretreatment ctDNA or SUVmax, which has also shown prognostic utility in MCL.42 We also observed a strong correlation between baseline ctDNA and MIPI scores. Taken together, our results suggest that various PET parameters may capture distinct underlying tumor biology with different prognostic implications, as recently demonstrated in follicular lymphoma.43
We observed much higher levels of pretreatment ctDNA in patients with blastoid histology compared with those with classic histology, but we did not find a statistical relationship between pretreatment ctDNA and tumor proliferation as measured by Ki-67 index. These observations were limited by the small number of patients in our study and known variability associated with Ki-67 analysis.44 Given the importance of tumor proliferation for outcome in MCL,10 additional studies should seek to better define the relationship between ctDNA and tumor proliferation, which can vary across anatomic compartments.45
The strengths of our study include prespecified collection of serum within a prospective clinical trial that included paired CT scans during surveillance to identify disease progression even in the absence of symptoms. In addition, the analysis of ctDNA performed at a central laboratory was blinded to clinical outcome. Our "window-of-opportunity" study design allowed us to show that ctDNA changes rapidly after targeted agents.
Important limitations of our study include a small sample size that limits generalizability to other treatments for MCL, including lenalidomide, ibrutinib, acalabrutinib, and chimeric antigen T-cell receptor therapy and other chemotherapy regimens. Our study used a combination chemotherapy approach, with the addition of a targeted agent as induction therapy, but the prognostic importance of MRD at the end of therapy may evolve as induction therapies improve and change over time. It will be important for all future studies testing novel agents and combinations in MCL to study the prognostic role of MRD throughout therapy.
Our ctDNA analysis was restricted to serum samples because we did not collect peripheral blood mononuclear cells or plasma for comparison. After our study was initiated, seminal studies in diffuse large B-cell lymphoma demonstrated that plasma is the preferred analyte for ctDNA and should be prioritized in future studies. Serum is contaminated with germ line DNA from white blood cells, and therefore, the allele fraction of ctDNA is lower compared with plasma.46-48 The resulting higher allele fraction in plasma facilitates genotyping from ctDNA, particularly when baseline tumor tissue is not available.46 Preliminary results from another study using NGS-based sequencing assays as part of frontline therapy in MCL have reported that MRD tracking is also successful in the cellular compartment.49 Additional studies are needed to determine the optimal peripheral blood compartment for ctDNA analysis in MCL.
The ctDNA assay used in our study requires a high disease burden sample for baseline identification of tumor clonotypes, which may affect its routine use. In older FFPE samples, there may be more difficult-to-identify tumor clonotypes, which is likely in part driven by declining quality of the DNA. Other emerging technologies that do not require baseline tumor tissue may be more broadly applicable and could allow for the study of clonal evolution or epigenetic changes during therapy.50,51 Furthermore, newer technologies with improved limits of detection may improve the prognostic significance over that observed in our study.51 In our study, despite the fact that most patients achieved MRD negativity at the end of therapy, the differences in PFS were modest. This further strengthens the rationale behind studying the dynamics of ctDNA throughout therapy to improve prognostication. Although we found multiple cases of relapse that were not preceded by reappearance of ctDNA, they were often associated with localized disease at relapse and/or had an interval of >6 months between an available ctDNA specimen and relapse. Because the risk of relapse in MCL extends indefinitely in most patients, additional studies are required to define the appropriate intervals for surveillance. Improvements in the sensitivity of ctDNA assays with lower limits of detection may improve the ability to detect molecular relapse before clinical symptoms or radiographic imaging.29,33 It should be noted that in MCL, the appearance of molecular relapse alone is not currently an indication for standard treatment, and the clinical utility of early treatment of relapsed MCL remains unproven.
In conclusion, we show that tumor-specific clonotypes can be identified in virtually all cases of MCL for tracking in peripheral blood, and we show that early ctDNA dynamics during induction therapy are associated with survival outcome. Indeed, the relatively favorable outcome of patients with early clearance of ctDNA may provide a valuable tool to determine the need for aggressive consolidation treatment and serve as a backbone for risk-adapted strategies. Further study of ctDNA is warranted in MCL and other lymphoma subtypes as novel combinations of targeted agents and immunotherapy agents emerge.
Acknowledgments
The authors would like to thank all the patients and their caregivers who participated on this clinical trial. The authors acknowledge Margaret Shovlin and Joan Aaron for their assistance in clinical and data management.
This work was funded by the Intramural Research Programs of the National Cancer Institute and the National Heart, Lung, and Blood Institute, National Institutes of Health (NIH). Bortezomib was provided by Millennium Pharmaceuticals (Takeda Oncology Company), and the NIH Clinical Center provided commercial supply of all other study drugs.
The content is solely the responsibility of the authors and does not necessarily represent the official views of the National Institutes of Health. Millennium Pharmaceuticals (Takeda Oncology Company) had no role in trial design or data interpretation.
Authorship
Contribution: W.H.W., K.D., and A.W. were responsible for conception and design. All authors provided study materials or patients and performed collection and assembly of data. R.L., M.R., and S.M.S. analyzed and interpreted data, and all authors reviewed the analysis and provided comments and approval. R.L. wrote the first manuscript draft, edited by M.R., and all authors provided input on and approved the final version. All authors attest to the accuracy of the data and the fidelity of the trial to the protocol.
Conflict-of-interest disclosure: A.J. and E.Y. are employed by Adaptive Biotechnologies. A.W. has received grant funding from Pharmacyclics, Acerta, Merck, Verastem, Nurix, and Genmab. The remaining authors declare no competing financial interests.
Correspondence: Mark Roschewski, Lymphoid Malignancies Branch, CCR, NCI, Building 10, Room 4N115, National Institutes of Health, Bethesda, MD 20892; e-mail: mark.roschewski@nih.gov.

