

Key Points
High expression level of SORT1/LAMP2 in lenalidomide-resistant cells enhanced EV secretion and cell adhesion ability.
Silencing the SORT1/LAMP2 in lenalidomide-resistant cells canceled cell adhesion and restored drug sensitivity.

Abstract
Multiple myeloma (MM) is a hematopoietic malignancy whose prognosis has improved with the development of new agents such as lenalidomide over the last decade. However, long-term exposure to drugs induces the acquisition of resistance by MM cells and leads to treatment failure and poor prognosis. Here, we show the molecular and cellular mechanisms of lenalidomide resistance in MM. In a comparison between lenalidomide-resistant cell lines and the parental cell lines, extracellular vesicle (EV) secretion and adherence abilities were significantly elevated in the resistant cells. Whole-transcriptome analysis revealed that the SORT1 and LAMP2 genes were key regulators of EV secretion. Silencing of these genes caused decreased EV secretion and loss of cell adhesion in the resistant cells, resulting in increased sensitivity to lenalidomide. Analysis of publicly available transcriptome data confirmed the relationship between genes related to EV secretion and cell adhesion and patient prognosis. Together, our findings reveal a novel mechanism of lenalidomide resistance in MM mediated by EV secretion and cell adhesion via SORT1 and LAMP2.
Introduction
Multiple myeloma (MM) is a hematopoietic malignancy characterized by clonal proliferation of malignant plasma cells. MM develops as a result of the evolutionary process in which normal plasma cells transition through the premalignant stage to smoldering myeloma and myeloma that requires treatment.1 Although understanding of the molecular drivers underlying the onset and progression of the disease has advanced, the course of clinical disease is highly heterogeneous due to the diversity in molecular mutations.2-5 In recent years, the prognosis of MM has been improved by the development of therapeutic agents such as immunomodulatory drugs (IMiDs), proteasome inhibitors, and antibody drugs; however, most patients eventually experience relapse and often exhibit multidrug resistance because of long-term exposure to these drugs. In particular, IMiDs have been used for long-term maintenance therapy after autologous bone marrow transplantation. Mechanistically, IMiDs directly bind cereblon (CRBN), which is their main target, leading to degradation of Ikaros (IKZF1) and Aioros (IKZF3), transcription factors that are essential for MM cell survival. Mutations in these genes have historically been thought to be the main cause of drug resistance6 ; however, the mechanisms underlying the acquisition of resistance to IMiDs are not fully understood. For example, Dimopoulos et al7 showed that MM cells acquired resistance to IMiDs in a CRBN-independent manner. In MM, cell adhesion is also considered to be important for drug resistance.8-10 Kobune et al9 showed that the ability of MM cells to adhere to bone marrow stromal cells in an autocrine manner is enhanced, which affects drug sensitivity. The existence of other drug resistance mechanisms independent of CRBN is suspected. Therefore, there is still an urgent need to define the molecular mechanisms of resistance to IMiDs.
It has been suggested that clones with drug resistance transmit information to other clones or cells in the bone marrow microenvironment, resulting in a change in this microenvironment favorable for MM cell survival.11-13 Extracellular vesicles (EVs) have attracted attention as novel tools for cell-to-cell communication.14-16 EVs also play important roles in MM progression by educating bone marrow–surrounding cells for their favorable tumor microenvironment.17-20 For instance, fibroblasts in bone marrow uptake MM cell–derived EVs containing microRNA-27b-3p and microRNA-214-3p and then obtain proliferative capacity and resistance in apoptosis.17 In contrast, bone marrow stromal cells also secrete EVs for interactions with MM cells.21,22 In addition, MM cell–derived EVs are known to be involved in bortezomib resistance23-27 ; however, IMiD resistance via EVs has not been reported. Thus, a better understanding of EV-mediated intercellular communication could be helpful for elucidating MM pathophysiology. The current study investigated the contributions of EVs derived from resistant MM cells-derived to IMiDs resistance via enhancement of cell adhesion ability.
Materials and methods
Cell culture
The MM cell lines KMS21, KMS27, and KMS34 were kindly provided by T. Otsuki (Kawasaki Medical University, Okayama, Japan). The lenalidomide-resistant cell lines KMS21R, KMS27R, and KMS34R were established by one of the authors (Y.H.) and have been exposed to low-dose lenalidomide for nearly 1 year (Y.H., manuscript submitted August 2021). Cells were cultured in RPMI 1640 medium (Gibco) supplemented with 10% fetal bovine serum and 1% Antibiotic-Antimycotic (Gibco), and cells were maintained in an atmosphere of 95% air and 5% carbon dioxide. MM cell lines were also cultured on fibronectin (FN)-coating glasses (GG-18-FIBRONECTIN, Neuvitro Corporation) or cocultured with bone marrow stromal cells (PCS-500-012, ATCC). We also prepared FN-coated plates (10838039001, Roche). Coating plates were made according to the manufacturer’s instructions. Bone marrow stromal cells were cultured with MesenPro medium (12746012, Gibco) supplemented with 1% Antibiotic-Antimycotic.
Reagents
The following antibodies were used for the ExoScreen assay: mouse monoclonal anti-human CD9 (clone 12A12, Cosmo Bio) and CD63 (clone 8A12, Cosmo Bio). These antibodies were used to modify either acceptor beads or biotin following the manufacturer’s protocol. The negative control small interfering RNA (siRNA) (SI03650318) was purchased from AllStars, and the TSG101 siRNA (SI02655184) was purchased from Qiagen. The SORT1 and LAMP2 siRNAs (siGENOME SMART pool siRNA M-010620 and M-011715, respectively) were purchased from Dharmacon. Lenalidomide was purchased from Selleck Chemicals.
EV isolation
Cancer cells were seeded in serum-free advanced RPMI 1640 medium supplemented with 2 mM l-glutamine and 1% Antibiotic-Antimycotic. After incubation for 48 hours, conditioned medium was filtered through a 0.22 µm filter (Millipore) and centrifuged at 2000g for 10 minutes to remove cell debris. For EV preparation, conditioned medium was ultracentrifuged at 110c000g for 70 minutes at 4°C. The EV protein concentration was measured by using a Micro BCA Protein Assay Kit (Thermo Fisher Scientific). This study was conducted according to the 2018 Minimal Information for Studies of Extracellular Vesicles guidelines.28
Western blotting
The following antibodies were used as primary antibodies: mouse monoclonal anti-human CD9 (clone 12A12, dilution 1:1000) and CD63 (clone 8A12, dilution 1:1000) from Cosmo Bio. Anti-SORT1 (ab16640, dilution 1:1000, Abcam), anti-LAMP2 (HPA029100, dilution 1:1000, Sigma-Aldrich), STAT-3 (9139s, dilution 1:1000, Cell Signaling Technology), p-STAT3 (Y705) (9145s, dilution 1:1000, Cell Signaling Technology), VLA-4 (67040-1, dilution 1:1000, Proteintech), and Cereblon (NBP1-91810, dilution 1:1000, Novus Biologicals) were also purchased. Secondary antibodies (horseradish peroxidase–conjugated anti-mouse IgG, NA931; horseradish peroxidase–conjugated anti-rabbit IgG, NA934; both dilutions 1:5000) were purchased from GE Healthcare. Mini-PROTEAN TGX gels (4% to 20%, Bio-Rad) were used, and the same amount of protein was loaded in each lane. Bound antibodies were visualized by chemiluminescence using an ImmunoStar LD kit, and luminescence images were analyzed in a LuminoImage analyzer (LAS-4000; Fujifilm Inc.).
ExoScreen assay system
In brief, cancer cells (2 × 10⁴) were seeded in 96-well plates in serum-free advanced RPMI 1640 medium supplemented with 1% glutamine and 1% Antibiotic-Antimycotic. After 48 hours of incubation, an ExoScreen assay was performed. The plate was read in an EnSpire Alpha 2300 Multilabel Plate reader using an excitation wavelength of 680 nm and an emission wavelength of 615 nm. Background signals obtained from filtered advanced RPMI 1640 medium or phosphate-buffered saline were subtracted from the measured signals.29
Cell proliferation assay
Cell viability was determined by using Cell Counting Kit-8 (Dojindo) according to the manufacturer’s instructions, and the absorbance at 450 nm was measured by using an EnVision Multilabel Plate Reader (PerkinElmer) and a SpectraMax iD3 plate reader (Molecular Devices). Next, 5 × 10³ MM cells were seeded into 96-well plates and lenalidomide added at each concentration. The signal was measured 72 hours later.
Transwell assay
We used a coculture system with 0.4-μm pore size transwell membranes (Corning, 353095). Resistant cells were seeded into the upper chamber, and sensitive cells were seeded into the lower chamber. The cells were cocultured for 1 week. One week later, the cells were washed to except nonadherent cells. The number of adherent cells and nonadherent cells were counted.
Procedure of the experiments with ultra-low–binding plates
Next, 2 × 10⁴ lenalidomide-resistant cells were seeded into normal 96-well plates (Thermo Fisher Scientific, 167008) or ultra-low–binding 96-well plates (Corning, 3474). The cells were incubated for 96 hours with lenalidomide. After incubation, cellular proliferation was measured by using cell viability assay.
Caspase activity assay
Caspase activity was determined by using the Caspase-Glo 3/7 Assay System (Promega), according to the manufacturer’s instructions. Luminescence was measured by using an EnVision Multilabel Plate Reader and a SpectraMax iD3 plate reader.
siRNA transfection
The Neon System from Thermo Fisher Scientific was used for siRNA transfection. Optimization followed the manufacturer’s instructions. Briefly, 1 × 10⁶ cells were resuspended in E buffer with each siRNA, then pulsed and seeded in culture dishes.
Nanoparticle tracking analysis
EVs were resuspended in phosphate-buffered saline and further diluted for analysis in a NanoSight LM10-HS system according to the manufacturer’s protocol.
RNA extraction
Total RNA was extracted from cultured cells by using QIAzol reagent and an miRNeasy Mini Kit (Qiagen). RNA quantity and quality were determined by using a NanoDrop ND-1000 spectrophotometer (Thermo Fisher Scientific) and an Agilent bioanalyzer (Agilent Technologies).
Quantitative real-time polymerase chain reaction
Total RNA was extracted from cultured cells by using QIAzol reagent and an miRNeasy Mini Kit. RNA quantity and quality were determined by using a NanoDrop ND-1000 spectrophotometer (Thermo Fisher Scientific). For quantitative reverse transcription polymerase chain reaction analysis, complementary DNA was reverse transcribed from total RNA using a High Capacity cDNA Reverse Transcription Kit (Applied Biosystems). The data were collected and analyzed by using StepOne Software version 2.3 (Applied Biosciences). All messenger RNA quantification data were normalized to the expression data for β-actin. TaqMan probes for SORT1 (Hs00361760_m1 SORT1), LAMP2 (Hs00174474 m1 LAMP2), and β-actin (Hs01060665_g1 ACTB) were purchased from Applied Biosystems. CRBN and β-actin primers were purchased from Eurofins (CRBN forward: TGTGTTGCCTTCAACCATGT; reverse: AGCGAGGCCATGAAGTTAGA, β-actin forward: GGAGGAGCTGGAAGCAGCC; reverse: GCTGTGCTACGTCGCCCTG).
Knockdown of LAMP2, SORT1, and CRBN by using lentivirus
The short hairpin RNAs (shRNAs) targeting CRBN were purchased from Santa Cruz Biotechnology (control shRNA, sc-108060-SH; sh-LAMP2, sc-29390-SH; and sh-SORT1, sc-42119-SH). The plasmids were electroporated with the envelop plasmid and packaging plasmid by using the Neon System.
Reanalysis of available data sets in a public database
Single-cell RNA-sequencing (scRNA-seq) data sets deposited in the Gene Expression Omnibus database (GSE106218 and GSE110499)30 were used for expression analysis of the drug resistance signature genes. scRNA-seq analysis was performed with ‘Seurat’ in R version 3.6.1 (R Foundation for Statistical Computing).31 Log normalization was performed with the function ‘NormalizeData’ in Seurat. Samples were log normalized and scaled by the number of genes and percentage of mitochondrial reads. We performed principal component analysis for dimensionality reduction and single-cell clustering with Seurat. The dimensionality-reduced cell clustering data are shown as a uniform manifold approximation and projection plot generated by the function ‘runUMAP’ in Seurat. Module analysis was performed with the function ‘AddModuleScore’ using the principal component 1 (PC1)/PC2 signature genes (supplemental Figure 8C).
RNA-seq data sets of MM cell lines were downloaded from the Cancer Cell Line Encyclopedia (https://portals.broadinstitute.org/ccle). Expression data for SORT1 and LAMP2 were extracted from the RNA-seq data.
Clinical microarray data sets of patients with MM were downloaded from the Gene Expression Omnibus database (GSE19784 and GSE136324).32,33 Microarray analysis and RMA normalization were performed by using the ‘affy’ package. We subjected the clinical data sets to survival analysis, which was executed by the ‘ggplot2′, “survminer,” and “survival” packages with R version 3.6.1., described previously.34,35
Statistical analysis
The data presented in the bar graphs are the mean ± standard deviations of at least 3 independent experiments. Statistical analyses between 2 groups were performed by using the Student t test. P < .05 was considered to be statistically significant. For multiple comparisons, the significance of differences in the average values was analyzed by using one-way analysis of variance with Dunnett’s post hoc test. The log-rank test in survival analysis was performed by using the ‘survminer’ package in R version 3.6.1.
Results
Increased EV secretion in lenalidomide-resistant MM cells
As discussed in the Materials and methods, we established 3 different lines of lenalidomide-resistant MM cells (KMS21R, KMS27R, and KMS34R) via long-term exposure to lenalidomide (Figure 1A; supplemental Figure 1A). KMS21R was derived from KMS21, a highly sensitive MM cell line, and the 50% inhibitory concentration of lenalidomide in KMS21R cells was ∼400-fold greater than that in the parental cell line KMS21 (Figure 1A-B, left panel). KMS27R was derived from KMS27, a cell line with moderate sensitivity to lenalidomide (Figure 1A-B, right panel). KMS34, the parental cell line of KMS34R, was originally resistant to lenalidomide, and KMS34R cells also exhibited high resistance to lenalidomide. Interestingly, the resistant cells exhibited the ability to attach onto noncoating culture dishes (supplemental Figure 1A-C). We also tried to culture MM cell lines on FN-coated plates (supplemental Figure 1D) or in coculture with bone marrow stromal cells (supplemental Figure 1E), which are physiologically more similar to a bone marrow environment. In both conditions, not only the resistant cells but part of the parental cell lines as well attached to the culture dishes. The number of adherent cells was counted (supplemental Figure 1F).
![Comparative analysis of parental and lenalidomide-resistant MM cell lines. (A) Illustration of the method for establishing lenalidomide-resistant cell lines. Relative resistance score (Rel. resistance) = (resistant cell 50% inhibitory concentration [IC50]/parental cell IC50). (B) Cell viability assay with Cell Counting Kit-8. The values were normalized to those of the negative control. The cells were incubated for 72 hours. (C) Caspase activity was measured with a caspase 3/7 assay kit. Cisplatin was used as a positive control. The cells were incubated for 72 hours. (D) Heatmap showing gene expression in lenalidomide-resistant cells and parental cells. P < .05, fold change (FC) > 1.5. (E) Gene set enrichment analysis results showing the enriched pathways in resistant cell lines. (F) Heatmap showing gene expression in the snare interaction in vesicular transport-associated gene set. (G) Measurement of EV secretion by an ExoScreen assay. The vertical axis in the graphs shows the ExoScreen signals normalized to the cell viability signals. Signal values were normalized to those of the negative control. The cells were incubated for 72 hours. (H) Nanoparticle tracking analysis (NTA). The particle count was normalized to the cell count. (I) The particle size indicates the median size. The error bars indicate standard deviation values. *P < .05. FDR, false discovery rate; Len, lenalidomide; max, maximum; min, minimum; NES, normalized enrichment score; N.S., not significant.](https://ash.silverchair-cdn.com/ash/content_public/journal/bloodadvances/6/8/10.1182_bloodadvances.2021005772/3/m_advancesadv2021005772f1.png?Expires=1767718853&Signature=HwY8ZH5l2AVUqHBmrD-McBlis9I6LP3WszJ9Ko8pEwRX2MPJBzSpTpRgi1sN1CW1Z4uATn9wC9k9NZecer-wrSah-cD00fnAzKrwnYzkXkmR2ibQmrztGqFB06GCUuKlw~0fPMbmrH2-RjchSMfQVs4IOra-p6Mamw3rJAb6VCzxVVI8TfdW-0unYrnbaLdF-tvUjEluB7vA0vFffNfMXYmM5YpxzfyEYfB8ohNXGOVjqBUxSNJ2WfmSwqawpDeE7JO--lzfiZW4BlgONMW-MS4Opgrhj1QaGdYIMxLuf-KIV8wnEhAHFbinMvZz9SgvZC63EY18cqAMPSfvvpAauw__&Key-Pair-Id=APKAIE5G5CRDK6RD3PGA)
Comparative analysis of parental and lenalidomide-resistant MM cell lines. (A) Illustration of the method for establishing lenalidomide-resistant cell lines. Relative resistance score (Rel. resistance) = (resistant cell 50% inhibitory concentration [IC50]/parental cell IC50). (B) Cell viability assay with Cell Counting Kit-8. The values were normalized to those of the negative control. The cells were incubated for 72 hours. (C) Caspase activity was measured with a caspase 3/7 assay kit. Cisplatin was used as a positive control. The cells were incubated for 72 hours. (D) Heatmap showing gene expression in lenalidomide-resistant cells and parental cells. P < .05, fold change (FC) > 1.5. (E) Gene set enrichment analysis results showing the enriched pathways in resistant cell lines. (F) Heatmap showing gene expression in the snare interaction in vesicular transport-associated gene set. (G) Measurement of EV secretion by an ExoScreen assay. The vertical axis in the graphs shows the ExoScreen signals normalized to the cell viability signals. Signal values were normalized to those of the negative control. The cells were incubated for 72 hours. (H) Nanoparticle tracking analysis (NTA). The particle count was normalized to the cell count. (I) The particle size indicates the median size. The error bars indicate standard deviation values. *P < .05. FDR, false discovery rate; Len, lenalidomide; max, maximum; min, minimum; NES, normalized enrichment score; N.S., not significant.
Comparative analysis of parental and lenalidomide-resistant MM cell lines. (A) Illustration of the method for establishing lenalidomide-resistant cell lines. Relative resistance score (Rel. resistance) = (resistant cell 50% inhibitory concentration [IC50]/parental cell IC50). (B) Cell viability assay with Cell Counting Kit-8. The values were normalized to those of the negative control. The cells were incubated for 72 hours. (C) Caspase activity was measured with a caspase 3/7 assay kit. Cisplatin was used as a positive control. The cells were incubated for 72 hours. (D) Heatmap showing gene expression in lenalidomide-resistant cells and parental cells. P < .05, fold change (FC) > 1.5. (E) Gene set enrichment analysis results showing the enriched pathways in resistant cell lines. (F) Heatmap showing gene expression in the snare interaction in vesicular transport-associated gene set. (G) Measurement of EV secretion by an ExoScreen assay. The vertical axis in the graphs shows the ExoScreen signals normalized to the cell viability signals. Signal values were normalized to those of the negative control. The cells were incubated for 72 hours. (H) Nanoparticle tracking analysis (NTA). The particle count was normalized to the cell count. (I) The particle size indicates the median size. The error bars indicate standard deviation values. *P < .05. FDR, false discovery rate; Len, lenalidomide; max, maximum; min, minimum; NES, normalized enrichment score; N.S., not significant.
As a first step to elucidate the molecular and cellular mechanisms of lenalidomide resistance in MM, we used KMS21, KMS21R, KMS27, and KMS27R cells because the parental cells clearly showed higher sensitivities to lenalidomide than the resistant cells, and the resistant cells had lower caspase activity than the parental cells (Figure 1B-C). Because a similar trend was not observed for KMS34 and KMS34R (supplemental Figure 1D-E), these cell lines were excluded from this experiment. Whole-transcriptome analysis showed differentially expressed genes, with 521 upregulated and 89 downregulated genes in the resistant cells (Figure 1D). Gene set enrichment analysis revealed that the gene sets of “Interferon (IFN)α response,” “IFNγ response,” “Mitotic spindle,” “Cell adhesion,” and “Snare interaction in vesicular transport” were significantly enriched in the resistant cells (Figure 1E; supplemental Figure 2A). A heatmap of the cell adhesion–related genes also showed high expression in the resistant cells (supplemental Figure 2B-C). IFN signaling is well known to be related to MM progression.36
Cell adhesion is also considered to be one of the critical factors for drug resistance acquisition, and we observed that our resistant cell lines (KMS27R and KMS34R) attached tightly to culture dishes, whereas KMS21R cells exhibited weak attachment (supplemental Figure 1A). Based on the gene set enrichment analysis results, we focused on the “Snare interaction in vesicular transport” gene set because this gene set is tightly associated with EV secretion, and EV secretion is well known to modulate drug sensitivity.37 As shown in Figure 1F, genes such as SNAP23 and VAMP3, which are important for EV secretion, were highly upregulated in the resistant cells. As expected, the ExoScreen assay and nanoparticle tracking analysis showed that resistant cells secreted a greater number of EVs (Figure 1G-H; supplemental Figure 3A). Expression of the EV markers CD9 and CD63 was confirmed by western blotting (supplemental Figure 3B). Consistent with previous reports,38 the size of EVs was decreased (Figure 1I).
EVs derived from lenalidomide-resistant MM cells influence lenalidomide resistance and cell adhesion in sensitive cell lines
We next examined the effect of EVs secreted by lenalidomide-resistant MM cells on the parental MM cells. For this purpose, a coculture system with 0.4-μm pore size transwell membranes was used (Figure 2A). In this system, cells in the upper chamber could not migrate into the lower chamber; only soluble proteins and EVs could move down to the lower chamber. The most resistant cell line, KMS34R, was seeded in the upper chamber, and the sensitive cell lines KMS21 and KMS27 were seeded in the lower chamber. After 1 week of coculture, the number of surviving cells in the presence of lenalidomide was determined. As shown in Figure 2B and supplemental Figure 4A and B, when cocultured with KMS34R, the number of KMS21 and KMS27 cells in the presence of lenalidomide was slightly increased. In contrast, KMS34 cells cultured with KMS34R cells did not show a clear change in drug sensitivity because KMS34 cells were initially resistant to lenalidomide (Figure 2B, right panel). Seeding the KMS21 and KMS27 cells in FN coating also clearly increased drug resistance when their resistant cells cocultured. Unexpectedly, we found that the sensitive cells cocultured with resistant cells became adherent to the culture dishes (Figure 2C; supplemental Figure 4C). EV-depleted conditioned medium was used as a control. The treatment of the EV-depleted conditioned medium did not influence cell adhesion (supplemental Figure 4D). Thus, to further investigate the cell adhesion–related function of EVs derived from lenalidomide-resistant MM cells, we cocultured KMS21 and KMS27 with resistant cell lines (KMS21R, KMS27R, and KMS34R) and quantified the numbers of adherent and nonadherent KMS21 cells (Figure 2D). Coculture with the resistant cell lines markedly increased the number of adherent cells, suggesting that EVs might contribute to cell adhesion in MM.

Relationship between cell adhesion ability and lenalidomide resistance. (A) Illustration of the coculture experiment setup. The resistant cells were seeded in the upper chamber, and the parental cells were seeded in the lower chamber. After 1 week of coculture, the numbers of adherent and nonadherent cells were determined. After cell counting, cells were reseeded into a new 96-well plate to measure lenalidomide sensitivity. (B) Cell viability assay of cocultured cells with Cell Counting Kit-8. The values were normalized to those of the negative control. Parental cells (KMS21, KMS27, and KMS34) were cocultured with KMS34R cells. (C) Representative images of KMS21 and KMS27 cells after coculture with lenalidomide-resistant cells. Bars represent 50 μm. (D) Fraction of cells from each sample after coculture (left). Total cell numbers in each sample (right). (E) Illustration of the cell adhesion experiment setup with ultra-low attachment plates. Each lenalidomide-resistant cell line was seeded at 5000 cells per well, and after 96 hours, cell proliferation was measured with a cell viability assay. (F) Cell viability assay of KMS21R, KMS27R, and KMS34R cells using ultra-low attachment plates. The values were normalized to those of the negative control. The error bars indicate standard deviation values. *P < .05.
Relationship between cell adhesion ability and lenalidomide resistance. (A) Illustration of the coculture experiment setup. The resistant cells were seeded in the upper chamber, and the parental cells were seeded in the lower chamber. After 1 week of coculture, the numbers of adherent and nonadherent cells were determined. After cell counting, cells were reseeded into a new 96-well plate to measure lenalidomide sensitivity. (B) Cell viability assay of cocultured cells with Cell Counting Kit-8. The values were normalized to those of the negative control. Parental cells (KMS21, KMS27, and KMS34) were cocultured with KMS34R cells. (C) Representative images of KMS21 and KMS27 cells after coculture with lenalidomide-resistant cells. Bars represent 50 μm. (D) Fraction of cells from each sample after coculture (left). Total cell numbers in each sample (right). (E) Illustration of the cell adhesion experiment setup with ultra-low attachment plates. Each lenalidomide-resistant cell line was seeded at 5000 cells per well, and after 96 hours, cell proliferation was measured with a cell viability assay. (F) Cell viability assay of KMS21R, KMS27R, and KMS34R cells using ultra-low attachment plates. The values were normalized to those of the negative control. The error bars indicate standard deviation values. *P < .05.
Because a relationship between cell adhesion and drug resistance has been reported,9,10 we then examined the effect of cell adhesion on lenalidomide resistance in MM cells (Figure 2E). Comparative analysis of lenalidomide sensitivity between normal and ultra-low attachment conditions revealed that KMS27R and KMS34R cells exhibited a significant decrease in viability in the presence of lenalidomide under the ultra-low attachment condition, suggesting that the cells became sensitive to lenalidomide under the nonadherent condition (Figure 2F, middle and right panels). In contrast, the sensitivity of KMS21R cells, which were very weakly attached, did not change under the ultra-low attachment condition (Figure 2F, left panel).
Our transcriptome profiling of all cell lines revealed that lenalidomide-targeted pathways such as those mediated by IKZF1 and IKZF3 were significantly inhibited in resistant cell lines, and this inhibition was maintained under lenalidomide exposure (supplemental Figure 5). Thus, in line with previous reports, our findings suggest that resistant MM cell lines acquire resistance to lenalidomide in a CRBN-independent manner, presumably related to EV secretion.
SORT1 and LAMP2 regulated lenalidomide sensitivity and EV secretion in MM cells
To identify key molecules responsible for lenalidomide resistance, EV secretion, and cell adhesion, we compared transcriptome data between 4 resistant cell lines (KMS21R, KMS27R, KMS34, and KMS34R) and 2 sensitive cell lines (KMS21 and KMS27). As shown in Figure 3A and B, we narrowed down the data set to 118 genes according to fold change and P value (Figure 3C) and then selected 13 genes by using a literature search. An siRNA targeting each of these 13 genes was electroporated into KMS27R cells (Figure 3B), and after 72 hours, cell viability and caspase activity were evaluated in cells treated with lenalidomide at a concentration of 100 μm (Figure 3D-E). After this screen, 8 genes (SORT1, LAMP2, USP25, RAD51AP1, PRTFDC1, AASS, CASP7, and CLSTN3) were further analyzed to quantify EV secretion by the ExoScreen assay (Figure 3F). According to this screen, we focused on SORT1 and LAMP2 because their expression levels were low in sensitive cell lines, and their silencing increased caspase activity under the lenalidomide exposure condition (Figure 3E) and decreased EV secretion (Figure 3F). The increased protein levels of SORT1 and LAMP2 in the resistant cell lines were confirmed by western blotting (Figure 3G-H). SORT1 protein levels were obviously increased in KMS21R and KMS27R cells compared with KMS21 and KMS27 cells, respectively, although we found a slight increase even in KMS34R cells compared with KMS34 cells (Figure 3H, right panel). In addition, previous studies have already shown that acquired lenalidomide-resistant cells are associated with high expression of p-STAT3 or VLA-4. Although the protein level of STAT3 and p-STAT3 was upregulated in the resistant cells, the protein level of VLA-4 was not changed (Figure 3G).

Screening of genes responsible for EV secretion in resistant MM cells. (A) Flow diagram for the selection of candidate genes related to EV secretion. (B) Illustration of the method used for EV secretion-related gene screening. (C) Heatmap showing the 118 genes highly expressed in lenalidomide-resistant cell lines (resistant, KMS21R, KMS27R, KMS34, and KMS34R; sensitive, KMS21 and KMS27). (D) Cell viability assay of cells with knockdown of the 13 selected genes in the presence of lenalidomide. (E) Caspase activity assay of cells with knockdown of the 13 selected genes in the presence of lenalidomide. (F) ExoScreen assay of cells with knockdown of the selected 8 genes. The values were normalized to those of the negative control (NC). (G) Western blotting for SORT1, LAMP2, VLA-4, STAT3, p-STAT3, and β-actin in the 6 cell lines used in this study. Proteins were loaded at 15 μg per lane. (H) Quantitative reverse transcription polymerase chain reaction analysis of the expression levels of LAMP2 and SORT1. Each expression value was normalized to that in the corresponding parental cell line.
Screening of genes responsible for EV secretion in resistant MM cells. (A) Flow diagram for the selection of candidate genes related to EV secretion. (B) Illustration of the method used for EV secretion-related gene screening. (C) Heatmap showing the 118 genes highly expressed in lenalidomide-resistant cell lines (resistant, KMS21R, KMS27R, KMS34, and KMS34R; sensitive, KMS21 and KMS27). (D) Cell viability assay of cells with knockdown of the 13 selected genes in the presence of lenalidomide. (E) Caspase activity assay of cells with knockdown of the 13 selected genes in the presence of lenalidomide. (F) ExoScreen assay of cells with knockdown of the selected 8 genes. The values were normalized to those of the negative control (NC). (G) Western blotting for SORT1, LAMP2, VLA-4, STAT3, p-STAT3, and β-actin in the 6 cell lines used in this study. Proteins were loaded at 15 μg per lane. (H) Quantitative reverse transcription polymerase chain reaction analysis of the expression levels of LAMP2 and SORT1. Each expression value was normalized to that in the corresponding parental cell line.
We investigated the correlation between CRBN and LAMP2 and SORT1 in both the public database and data sets of our cell lines (supplemental Figure 6A-B). Furthermore, we established CRBN knockdown of KMS27R cells (supplemental Figure 6C-D). The protein level of CRBN was ∼50% reduced; however, cell adhesion ability was not changed (supplemental Figure 6E).
SORT1 and LAMP2 also influenced cell adhesion and lenalidomide sensitivity in MM cells
Because the relationship between EV secretion and cell adhesion was observed in MM cells (Figure 2), we examined whether the silencing of either SORT1 or LAMP2 also affects cell adhesion. To this end, we established stable knockdown of either SORT1 or LAMP2 by lentivirus-delivered shRNA in resistant MM cells (KMS21R, KMS27R, and KMS34R) (supplemental Figure 7A). The knockdown efficiency of SORT1 and LAMP2 was confirmed by western blotting (Figure 4A). Inhibition of EV secretion was verified by the ExoScreen assay in the silenced resistant cell lines (Figure 4B). Then, because KMS27R cells with silencing of SORT1 and LAMP2 exhibited marked phenotypic changes (Figure 4A-B), we used these cells and sought to determine whether attenuating SORT1 and LAMP2 gene expression influences cell adhesion (Figure 4C). When either SORT1 or LAMP2 was knocked down, we observed that most of the cells were detached from the culture dishes and the number of attached cells was significantly reduced (Figure 4D-E), whereas cell viability, including that of both attached and floating cells, was not changed in the absence of lenalidomide (Figure 4F). The same phenotype was observed when in the FN-coated plates (Figure 4G). This finding indicates that SORT1 and LAMP2 regulate cell adhesion in MM cells in a direct or an indirect manner.
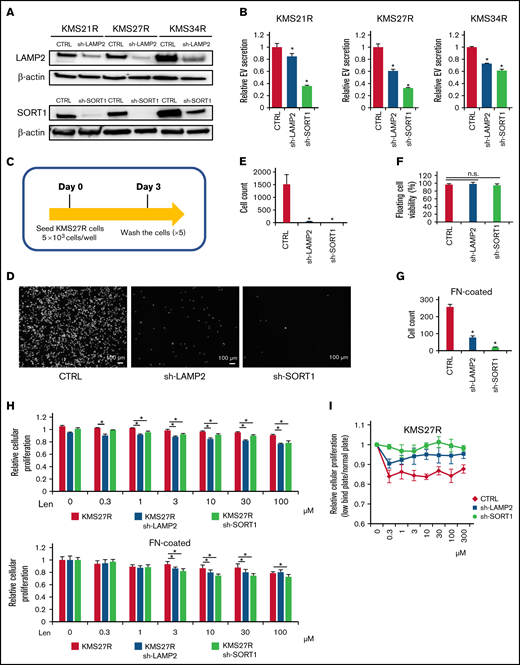
Functional analysis of LAMP2 and SORT1 knockdown in lenalidomide-resistant MM cells. (A) Western blotting for SORT1, LAMP2, and β-actin in cells with stable knockdown of SORT1 and LAMP2 via shRNA. Proteins were loaded at 15 μg per lane. (B) EV secretion was measured with an ExoScreen assay. Each signal value was normalized to that of the control (CTRL). (C) Illustration of the method used for the adhesion experiment. Seventy-two hours after seeding, cells were washed 5 times with phosphate-buffered saline (-), and the numbers of attached cells were counted. (D) Picture of KMS27R cells with LAMP2 or SORT1 knockdown. Bars represent 100 μm. (E) Cell counts of the adherent cells in panel D. (F) The viability of nonadherent cells was estimated by using trypan blue staining. The values were normalized to the total cell number. (G) Cell counts of the adherent cells using FN-coated plates. (H) Cell viability assay of KMS27R cells with LAMP2 or SORT1 knockdown in the presence of lenalidomide. The values were normalized to those of the negative control (0 μM lenalidomide). Top, normal plate; bottom, FN-coated plate. (I) Comparative analysis of KMS27R cells with LAMP2 or SORT1 knockdown cultured in normal and ultra-low attachment conditions via the cell viability assay. The signal values for the ultra-low attachment plate were normalized to those for the normal plate. The error bars indicate standard deviation values. *P < .05. Len, lenalidomide; n.s., not significant.
Functional analysis of LAMP2 and SORT1 knockdown in lenalidomide-resistant MM cells. (A) Western blotting for SORT1, LAMP2, and β-actin in cells with stable knockdown of SORT1 and LAMP2 via shRNA. Proteins were loaded at 15 μg per lane. (B) EV secretion was measured with an ExoScreen assay. Each signal value was normalized to that of the control (CTRL). (C) Illustration of the method used for the adhesion experiment. Seventy-two hours after seeding, cells were washed 5 times with phosphate-buffered saline (-), and the numbers of attached cells were counted. (D) Picture of KMS27R cells with LAMP2 or SORT1 knockdown. Bars represent 100 μm. (E) Cell counts of the adherent cells in panel D. (F) The viability of nonadherent cells was estimated by using trypan blue staining. The values were normalized to the total cell number. (G) Cell counts of the adherent cells using FN-coated plates. (H) Cell viability assay of KMS27R cells with LAMP2 or SORT1 knockdown in the presence of lenalidomide. The values were normalized to those of the negative control (0 μM lenalidomide). Top, normal plate; bottom, FN-coated plate. (I) Comparative analysis of KMS27R cells with LAMP2 or SORT1 knockdown cultured in normal and ultra-low attachment conditions via the cell viability assay. The signal values for the ultra-low attachment plate were normalized to those for the normal plate. The error bars indicate standard deviation values. *P < .05. Len, lenalidomide; n.s., not significant.
Finally, we investigated whether knockdown of these genes affects lenalidomide sensitivity. After knockdown of the SORT1 and LAMP2 genes in KMS27R cells, lenalidomide sensitivity was restored to a level comparable to that of the parental cell line KMS27 (Figure 4H). In addition, we cocultured KMS21 with KMS21R, sh-LAMP2 KMS21R, and sh-SORT1 KMS21R cells (supplemental Figure 7B). As expected, KMS21 cells decreased the drug sensitivity when cocultured with KMS21R, whereas the coculture with sh-LAMP2 KMS21R and sh-SORT1 KMS21R cells did not. Furthermore, the knockdown of LAMP2 and SORT1 did not affect the CRBN expression (supplemental Figure 7C-D). When the sensitivity to lenalidomide was compared between normal and ultra-low attachment conditions, the effect of ultra-low attachment plate conditions was completely abolished in cells with silencing of SORT1 (Figure 4I), because SORT1 knockdown induced the detachment of KMS27R cells, and no significant differences in cell viability were observed between the normal and ultra-low attachment conditions (supplemental Figure 7E). Collectively, these findings indicate that the SORT1 and LAMP2 genes were associated with lenalidomide sensitivity via cell adhesion and EV secretion. These secreted EVs may contribute to transferring drug resistance to bystander cells by conferring cell adhesion ability on MM cells.
Contribution of EV secretion and cell adhesion–related genes to MM patient prognosis
Because a mutual interaction between the SORT1 and LAMP2 genes has been reported,39 correlation analysis revealed a significant association between the expression levels of the SORT1 and LAMP2 genes in the cell lines used in this study (r = 0.98; P < .001) (Figure 5A). A similar trend was observed in MM cell lines from the Cancer Cell Line Encyclopedia database (Figure 5B).7,40 The expression levels of SORT1 and LAMP2 were lower in the cell lines that had high sensitivity to lenalidomide, whereas the lenalidomide-resistant cell lines expressed higher levels of the SORT1 and LAMP2 genes.

Contribution of EV secretion and cell adhesion–related genes to MM patient prognosis. (A) A scatter plot showing the relationship between LAMP2 and SORT1 expression in the 6 cell lines used in this study. The x-axis indicates LAMP2 expression, and the y-axis indicates SORT1 expression. (B) Scatter plot showing the relationship of LAMP2 and SORT1 expression in a publicly available Cancer Cell Line Encyclopedia data set. Each dot indicates an MM cell line; red, cell lines in our data set; blue, cell lines that are known to be partially resistant or resistant to lenalidomide. (C) Uniform manifold approximation and projection (UMAP) plot classifying patient outcomes as aggressive or passive. (D) UMAP plot of MM cells focusing on the PC1 signature (left). Violin plot of PC1 signature genes among patient states (right). (E) UMAP plot of MM cells focusing on the PC2 signature (left). Violin plot for PC2 signature genes among patient states (right). (F) Violin plots for LAMP2 and SORT1 gene expression among patient states. (G-H) Violin plots for EV biogenesis-associated gene expression among patient states, among PC2 signature genes (G) and typical EV marker (H).
Contribution of EV secretion and cell adhesion–related genes to MM patient prognosis. (A) A scatter plot showing the relationship between LAMP2 and SORT1 expression in the 6 cell lines used in this study. The x-axis indicates LAMP2 expression, and the y-axis indicates SORT1 expression. (B) Scatter plot showing the relationship of LAMP2 and SORT1 expression in a publicly available Cancer Cell Line Encyclopedia data set. Each dot indicates an MM cell line; red, cell lines in our data set; blue, cell lines that are known to be partially resistant or resistant to lenalidomide. (C) Uniform manifold approximation and projection (UMAP) plot classifying patient outcomes as aggressive or passive. (D) UMAP plot of MM cells focusing on the PC1 signature (left). Violin plot of PC1 signature genes among patient states (right). (E) UMAP plot of MM cells focusing on the PC2 signature (left). Violin plot for PC2 signature genes among patient states (right). (F) Violin plots for LAMP2 and SORT1 gene expression among patient states. (G-H) Violin plots for EV biogenesis-associated gene expression among patient states, among PC2 signature genes (G) and typical EV marker (H).
Next, we reanalyzed the single-cell transcriptome profiles of publicly available MM data sets30 to examine whether EV secretion and cell adhesion are related to MM patient prognosis. The data set contained myeloma cells in bone marrow from 9 patients and in extramedullary sites from 4 patients (supplemental Figure 8A). Thirteen patients were divided into 2 groups: 7 patients with a prognosis of <2 years and 6 patients with a prognosis of >2 years (Figure 5C). When we analyzed our bulk RNA-seq data of the 6 MM cell lines used in this study, the principal component analysis plot showed that PC1 represented the difference in patients and that PC2 was considered to show the difference in patient state (supplemental Figure 8B). The PC1 and PC2 signature genes are listed in supplemental Figure 8C. We observed a group of PC1 and PC2 signature genes (Figure 5D-E) in the scRNA-seq data of patients with MM and found that a group of PC2 signature genes was significantly enriched in the patients with overall survival (OS) <2 years (Figure 5E); no significant difference was seen in a group of PC1 signature genes (Figure 5D). Because the PC2 signature included genes related to EV secretion and cell adhesion (supplemental Figure 8C, bottom), this result highlighted that these genes are clinically associated with MM patient prognosis. In addition, LAMP2 was found to be significantly upregulated in the patients with OS <2 years (Figure 5F), although the SORT1 expression level merely tended to increase. In the PC2 signature, genes related to EV secretion, such as CAV1, CD9, TSPAN7, and AHNAK (Figure 5G), and cell adhesion, such as CD44 (supplemental Figure 9), were also detected at high levels in patients with OS <2 years. The typical EV marker genes CD63 and TSG101, which were not included in the PC2 signature, were also significantly elevated in patients with OS <2 years (Figure 5H).
Furthermore, we reanalyzed the microarray data set including ∼300 patients with MM (GSE19784).32 The Kaplan-Meier analysis showed that a high LAMP2 expression profile was significantly correlated with poor prognosis in both OS (Figure 6A) and progression-free survival (PFS) (Figure 6B). In contrast, patients with high SORT1 expression prolonged their OS and PFS. Because the data set used in GSE19784 did not include the patients who were treated with lenalidomide, we reanalyzed GSE136324, which contained >200 patients treated with lenalidomide (TT3b, TT4, and TT5).33 High SORT1 expression was significantly correlated with poor prognosis (Figure 6C). These findings suggest that the expression level of SORT1 might be directly related to lenalidomide resistance in the patients. Thus, analysis of this publicly available clinical data revealed that EV secretion and cell adhesion, which are likely mediated by SORT1 and LAMP2, are associated with patient prognosis in MM.
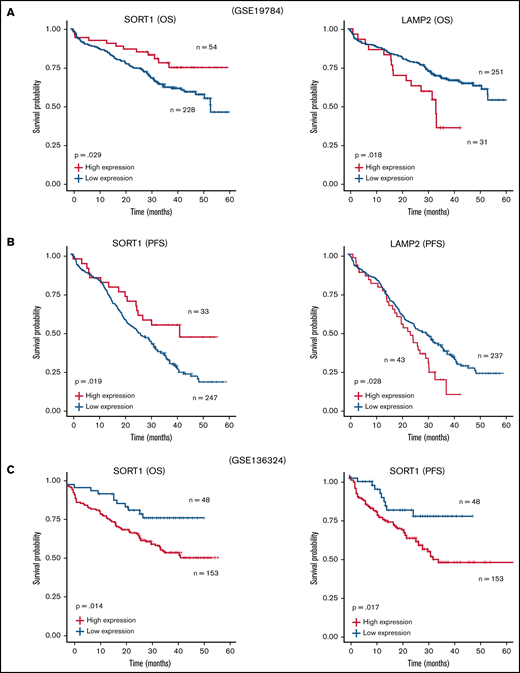
Survival analysis with SORT1 and LAMP2 expression profiles in clinical MM. (A-B) Kaplan-Meier plots with SORT1 and LAMP2 expression profiles in GSE19784 data sets using end points of OS status (A) and PFS status (B). Low expression of SORT1 correlated to poor prognosis with OS (high, n = 54; low, n = 228) and PFS (high, n = 33; low, n = 247) end points. High expression of LAMP2 correlated to poor prognosis with OS (high, n = 31; low, n = 251) and PFS (high, n = 43; low, n = 237) end points. (C) Kaplan-Meier plots with SORT1 expression profiles in GSE136324 data sets using end points of OS status (left panel) and PFS status (right panel). High expression of SORT1 correlated to poor prognosis with OS (high, n = 153; low, n = 48) and PFS (high, n = 153; low, n = 48) end points.
Survival analysis with SORT1 and LAMP2 expression profiles in clinical MM. (A-B) Kaplan-Meier plots with SORT1 and LAMP2 expression profiles in GSE19784 data sets using end points of OS status (A) and PFS status (B). Low expression of SORT1 correlated to poor prognosis with OS (high, n = 54; low, n = 228) and PFS (high, n = 33; low, n = 247) end points. High expression of LAMP2 correlated to poor prognosis with OS (high, n = 31; low, n = 251) and PFS (high, n = 43; low, n = 237) end points. (C) Kaplan-Meier plots with SORT1 expression profiles in GSE136324 data sets using end points of OS status (left panel) and PFS status (right panel). High expression of SORT1 correlated to poor prognosis with OS (high, n = 153; low, n = 48) and PFS (high, n = 153; low, n = 48) end points.
Discussion
Accumulating evidence has shown that targeting EVs might be a new therapeutic strategy for cancer. Understanding the secretory mechanisms of EVs in cancer cells may improve this strategy. However, the mechanism of EV biogenesis in cancer cells remains elusive because the secretory pathway is considered to differ depending on the cell of origin.15 In general, cancer cells secrete a greater number of EVs than normal cells.41 This characteristic indicates that inhibition of cancer cell–derived EVs will have a significant impact on the development of EV-targeted therapies.
In the current study, we identified novel EV secretion-related genes, SORT1 and LAMP2, which were highly expressed in lenalidomide-resistant cell lines and regulated EV secretion and cell adhesion in MM cell lines. Our findings indicate that EVs derived from lenalidomide-resistant MM cells partially conferred resistance on sensitive parental MM cell lines. Considering the effect of EVs, another important question is what kind of molecules in/on EVs is responsible for lenalidomide resistance in MM cells. For example, Safaei et al42 showed that ovarian cancer cells sorted lysosomal proteins abnormally and loaded cisplatin transporters into EVs, which could result in cisplatin efflux from cancer cells. Furthermore, because cargo transferred in EVs can induce a genetic change in the tumor microenvironment, drug-resistant cancer cells hijack this mechanism to confer resistance on sensitive cells.38,42 In this way, EVs promote cancer cell survival through both autocrine and paracrine mechanisms that transform drug-sensitive cells into resistant cells. Although SORT1 and LAMP2 were identified to positively regulate EV secretion in MM, we did not focus on the cargo of EVs in resistant cells, which likely contained key factors for transferring drug resistance to sensitive cells. Thus, identification of the key molecules for EV-mediated drug resistance is important43,44 and is the next challenge.
We also observed morphologic changes in KMS27R and KMS34R cells from a round shape to a spindle shape. In MM, cell adhesion is important for cell survival.10,45,46 Cell adhesion is also considered to contribute to the efficient transfer of EVs to other cells in the bone marrow microenvironment. Kohmo et al47 showed that lung cancer cells expressed high levels of CD9, and increased cell adhesion capacity led to increased drug resistance. High level of CD9 was observed in our resistant cell–derived EVs and aggressive state of clinical samples. These results indicate that resistant cell–derived EVs were transferred to recipient drug-sensitive cells and then led to the CD9 expression onto the surface of the lenalidomide-sensitive cell membrane. Further investigations, such as animal studies and experiments in sophisticated coculture systems with bone marrow stromal cells and immune cells, are required. Because the changes observed in vitro are considered unnatural, ideally, in vivo imaging of MM cells would provide better insight into how resistant cells emerge in MM.
SORT1 was originally known to be associated with endosomes. However, because circulating endothelial cells in patients with metastatic cancer have been reported to highly express the SORT1 gene,48 SORT1 might also be related to cell extravasation. In MM, cancer cells are normally confined to the bone marrow; however, in some cases, MM cells are observed outside of the bone marrow. This condition is called extramedullary disease (EMD) and is closely associated with poor prognosis in MM32 ; the mechanism of EMD development is not fully elucidated. Because our data indicated that SORT1 positively regulated cell adhesion as well as EV secretion, high expression of SORT1 might be correlated with the EMD phenotype. LAMP2 is a well-known key protein in the chaperone-mediated autophagy pathway, and its expression is reportedly elevated in breast tumor tissues.49 Qadir et al50 reported the relationship between LAMP2 and EVs. In a neck squamous cell carcinoma cell line, cancer cell–derived EVs, but not normal cell–derived EVs, were shown to modulate the expression of LAMP2. Babuta et al51 reported the relationship between autophagy and exosome biogenesis and found that knockdown of LAMP2 increased EV release from hepatocytes and macrophages. Although their finding is ostensibly contradictory to our results, autophagy and exosome biogenesis could be reciprocally connected.
There are 2 limitations in the current study. One is that we failed to examine whether the effect of SORT1/LAMP2 is specific or suppression of EV suffices to restore lenalidomide sensitivity. It is due to a lack of the optimal experimental model to adequately inhibit EV secretion in MM cells. We have tried a neutral SMase2 inhibitor, GW4869, which is broadly used for EV suppression. However, GW4869 treatment caused only ∼20% of EV suppression in MM cells and was considered not suitable for fully evaluating the effect of EV suppression on restoration of lenalidomide sensitivity. Another limitation is that the precise molecular mechanism on the relationship among EVs, cell adhesion, and drug sensitivity is unknown. Previous studies have already shown that acquired drug-resistant MM cells are associated with high expression of VLA-4, STAT3, p-STAT3, or CD44.52-54 Our data confirmed higher expression of drug resistance-related genes, such as STAT3, p-STAT3 in all resistant cell lines, and silencing of LAMP2 or SORT1 decreased STAT3 and p-STAT3. In other words, the JAK/STAT pathway was activated by long-term exposure to lenalidomide. To elucidate EV-related drug resistance, the JAK/STAT pathway could be one of the therapeutic targets and would be further investigated for precise molecular mechanisms.
In conclusion, our comparative analysis between resistant and sensitive MM cell lines followed by whole-transcriptome analysis identified novel EV secretion regulators, SORT1 and LAMP2, which also regulated cell adhesion as well as lenalidomide resistance. In addition, continuous exposure of the EVs secreted by resistant cell converts drug-sensitive cells to drug-resistant cells. This is a novel mechanism of lenalidomide resistance in patients with MM (Figure 7). Finally, considering clinical applications, suppressing EVs by inhibiting their biogenesis or blocking secreted EVs with specific antibodies may be feasible approaches to prevent the acquisition of drug resistance in MM. Also, SORT1 could be a novel prognostic biomarker in MM.

Acknowledgments
The authors thank M. Abe for the support on this study. They thank all members of the Hattori and Ochiya laboratories for fruitful discussion.
This study was supported by the Practical Research for Innovative Cancer Control (19ck0106366h0003) from the Japan Agency for Medical Research and Development, the “Development of Diagnostic Technology for Detection of miRNA in Body Fluids” grant from the Japan Agency for Medical Research and Development, Keio University Doctoral Student Grant-in-Aid Program, and Multiple Myeloma Research Grant from Myeloma Patients and Families, Japan.
Authorship
Contribution: Fundamental research project was launched by T.O. and Y.H.; T.Y. and J.N. designed the experimental plan; T.Y. and Y.Y. performed experiments; T.Y. performed revisions; Y.H. established the lenalidomide-resistant cell lines; T.Y., Y.Y., and J.N. analyzed data; and T.Y., M.K., and T.O. wrote the manuscript with contribution from all coauthors.
Conflict-of-interest disclosure: The authors declare no competing financial interests.
Correspondence: Takahiro Ochiya, Department of Molecular and Cellular Medicine, Institute of Medical Science, Tokyo Medical University, 6-7-1, Nishishinjyuku, Shinjyuku-ku, Tokyo 160-0023, Japan; e-mail: tochiya@tokyo-med.ac.jp or Yutaka Hattori, Division of Clinical Physiology and Therapeutics, Faculty of Pharmacy, Keio University, 1-5-30, Shibakoen, Minato-ku, Tokyo 105-8512, Japan; e-mail: hattori-yt@pha.keio.ac.jp.

