

Key Points
We observed stable excess rates of secondary malignancies over time among lymphoma patients compared with the general population.
In follicular lymphoma, decreasing rates of secondary myelodysplastic syndrome and acute myeloid leukemia were observed after 2009.

Abstract
Considering treatment changes and an improved prognosis of non-Hodgkin lymphoma (NHL) over time, knowledge regarding long-term health outcomes, including late effects of treatment, has become increasingly important. We report on time trends of second primary malignancies (SPMs) in Swedish NHL patients, encompassing the years before as well as after the introduction of anti-CD20 antibody therapy. We identified NHL patients in the Swedish Cancer Register 1993 to 2014 and matched comparators from the Swedish Total Population Register. The matched cohort was followed through 2017. By linking to the Swedish Lymphoma Register, subcohort analyses by NHL subtype were performed. Flexible parametric survival models were used to estimate hazard ratios (HRs) with 95% confidence intervals (CIs) of SPM among patients and comparators. Among 32 100 NHL patients, 3619 solid tumors and 217 myelodysplastic syndrome (MDS)/acute myeloid leukemia (AML) cases were observed, corresponding to a 40% higher rate of solid tumors (HRsolid tumors = 1.4; 95% CI, 1.4-1.5) and a 5-fold higher rate of MDS/AML (HRMDS/AML = 5.2; 95% CI, 4.4-6.2) than for comparators. Overall, the observed excess risks for solid tumors or MDS/AML remained stable over the study period, except for follicular lymphoma, where the excess rate of MDS/AML attenuated with time (P for trend = .012). We conclude that NHL survivors have an increased risk of both solid tumors and hematologic malignancies, in particular MDS/AML. Stable excess risks over time indicate that contemporary treatment standards are not associated with modified SPM risk. Encouragingly, decreasing rates of MDS/AML were noted among patients with follicular lymphoma, possibly due to the increasing use of nonchemotherapy-based treatments.
Introduction
The population of non-Hodgkin lymphoma (NHL) survivors has grown substantially in recent decades due to the increasing incidence of many NHLs, aging populations in the Western world, and better treatment outcomes.1-3 With the improved treatment outcomes and the growing population of patients cured for NHL or living with NHL as a chronic disease, the interest for research in late toxicities has increased.1
A highly relevant and potentially life-threatening complication following treatment of lymphoma is the occurrence of second primary malignancies (SPMs) (ie, a non-NHL cancer diagnosed subsequent to the NHL). This includes, but is not limited to, cancers that are related to the treatment given for the NHL (eg, caused by immunosuppression or DNA damage from chemotherapy or radiation therapy). Previous studies have consistently shown increased risks of SPM in general and of myeloid malignancies in particular.4-14 However, many of these studies have not investigated the most recent time periods with modern treatments, and have included small, sometimes selected, patient groups. The last 2 decades have brought several changes to the standard-of-care treatments for NHL. These include primary treatment escalation (eg, the addition of etoposide and methotrexate in aggressive lymphomas15,16 ), increased use of consolidative autologous stem cell transplantation in transformed low-grade lymphomas and T-cell lymphomas,17 and additions of targeted therapies, most notably anti-CD20 antibody therapy such as rituximab, in B-cell lymphomas.18 Some of these changes could potentially lead to a higher risk of SPM, although the long-term impact of these changes remains uncertain. At the same time, the introduction of targeted therapies as single-agent primary treatment has led to reduced use of chemotherapy for low-grade B-cell lymphomas, which in turn could decrease the risk of SPM, in particular, treatment-related myeloid neoplasms.19
To address potential changes in the risk of SPM with changing treatment standards, we studied temporal trends in excess risks of SPM for NHL patients diagnosed from 1993 to 2014, followed through 2017, by comparing NHL survivors to matched population comparators using national Swedish register data.
Methods
Data sources and patient cohorts
We identified Swedish patients with NHL from 2 different national population-based registers. The Swedish Cancer Register (SCR) contains information on all cancers diagnosed in Sweden since 1958. The data are maintained by the National Board of Health and Welfare, and reporting to the register is mandatory by law for all health care providers.20 Whereas the SCR contains basic demographic and diagnostic data, detailed clinical information about lymphoma, such as subtype and stage, is absent. The Swedish Lymphoma Register (SLR) was initiated by the Swedish Lymphoma Group in 2000 and contains detailed physician-reported clinical data. Although the reporting to the SLR is not mandated by law, the register covers around 95% of the cases in the SCR.2 Dates of death, required for patient follow-up, was linked via the Swedish Cause-of-Death Register.
Two cohorts of NHL patients were created to address both long-term temporal trends and more detailed analyses of subtype-specific excess risks. The first cohort (SCR cohort) initially consisted of 33 062 cases with NHL (ICD-7 codes: 200, 202) diagnosed 1993 through 2014, aged ≥18 years. Exclusions were made for patients with WHO/HS/CANC/24.1 histology codes indicating nonlymphoma diagnoses (n = 13), uncertain basis for diagnosis (eg, without histopathological confirmation, n = 58), autopsy findings (n = 567), and missing information on birth year or death dates (n = 34 + 4). Further, by linkage to the Swedish National Patient Register, we excluded patients with a prior history of human immunodeficiency virus (HIV) infection (n = 86) and allogeneic hematopoietic stem cell transplantation or solid organ transplantation (n = 200) since immunocompromised patients are known to have pronounced cancer risks for reasons related to the underlying disorders. The final SCR cohort encompassed 32 100 NHL patients (supplemental Figure 1).
The second cohort (SLR subcohort) consisted of patients diagnosed after 1 January 2000 and was created by further linking detailed NHL subtype data from the SLR. In the SLR subcohort, patients who were registered in the SCR but for whom no data had been reported to the SLR (n = 1467) or where inconsistencies were found between the SCR and SLR registrations (n = 13) were excluded, leaving 21 695 patients for analysis.
Our investigation focuses specifically on SPMs of myeloid origin since these have shown to be associated with chemotherapy agents commonly used in lymphoma care (eg, alkylating agents and topoisomerase II inhibitors).19,21,22 From the year 2000 and onward (SLR cohort), we assessed the risk of myelodysplastic syndrome (MDS) and acute myeloid leukemia (AML) among high-grade vs low-grade NHL and among the most common NHL subtypes by morphology.
Population comparators
Comparators from the general population were identified by sampling with replacement from the Swedish Total Population Register. The comparators were individually matched to the NHL patients at the date of diagnosis by year of birth and sex (with 5 comparators per case except for 2 cases for whom only 4 comparators were available). On the matching date, the comparators had to be alive and free from previous history of NHL, HIV, or transplantation. The comparators included 160 498 individuals for the SCR cohort and 108 474 individuals for the SLR subcohort.
Follow-up and outcomes
The start of follow-up was set to 30 days (for MDS/AML outcomes) or 90 days (for solid tumor outcomes) after the date of NHL diagnosis (matching date for comparators) since cases occurring before that are unlikely to be related to the lymphoma or its treatment. Thus, by masking the immediate time period after NHL diagnosis, malignancies that were discovered incidentally during the lymphoma workup and unlikely to be true SPM outcomes were eliminated from the analyses. The matched cohorts were followed until diagnosis of a malignancy, date of death, or 31 December 2017, whichever came first. Based on the SCR cohort, 2 separate analyses were performed with MDS/AML and solid tumors as the main outcomes. Additional analyses were performed to assess the risk of other hematological malignancies, including myeloproliferative neoplasms (MPNs) and chronic myeloid leukemia (CML), Hodgkin lymphoma, multiple myeloma, lymphatic leukemia (excluding chronic lymphocytic leukemia [CLL]), and for different subtypes of solid tumors by anatomic location (with pooling of rare cancer forms and clinically relevant categorizations, eg, separating melanoma and nonmelanoma skin cancers) (supplemental Table 1). For each SPM group, time to the first SPM in that group was analyzed without censoring for other prior SPMs of a different type.
In the SLR subcohort with NHL patients diagnosed in 2000 or later, we focused the investigation on the risk of MDS/AML. Using morphological NHL subtype data from the SLR, separate analyses were performed by lymphoma aggressiveness (ie, high-grade and low-grade lymphomas) (supplemental Table 1) and by major subtypes (diffuse large B-cell lymphoma [DLBCL], follicular lymphoma [FL], mantle cell lymphoma, marginal zone lymphoma, Burkitt lymphoma, and T/NK-cell lymphoma).
The study was approved by the Stockholm Regional Ethics Committee (Dnr 2012/298-31-1) and was performed in accordance with the Declaration of Helsinki.
Statistical methods
Demographic characteristics of NHL patients and population comparators were summarized descriptively. Incidence rates (IR) of SPMs and 95% confidence intervals (CIs) were calculated, stratified by age at diagnosis (<70 and ≥70 years), sex, calendar period of diagnosis (1993-1999, 2000-2004, 2005-2009, 2010-2014) and, in the SLR subcohort, by lymphoma aggressiveness and major morphological subtype.
In the SCR cohort, hazard ratios (HRs) with 95% CI contrasting rates of SPM between patients and comparators were estimated using flexible parametric survival models. These models use restricted cubic splines to model the baseline hazard rate but are otherwise similar to Cox regression models with respect to interpretation.23 All models were adjusted for sex, age, and calendar period of diagnosis and parameterized such that comparators were the reference group. Likelihood ratio tests were used to sequentially test for interaction between case/comparator status and the variables included in the model.
For the analyses of temporal trends of SPM incidence (for NHL overall and stratified by subtype), we modeled the effect of calendar year using a restricted cubic spline (with internal knots placed at the 33rd and 66th percentiles of the calendar year distribution). We further included interaction terms between case/comparator status and the spline terms representing the calendar year of diagnosis. The models were used to estimate the HR of SPM, comparing cases to comparators for each point of calendar time, and summarize the trends graphically. To investigate temporal trends, we restricted the effect of the calendar year to be linear and tested if the effect of being a case (vs comparator) was modified by the calendar year.
To assess that the results for the temporal trends were not driven by the choice for number and location of knots in the restricted cubic spline, we also performed a sensitivity analysis with alternative knots configuration (with degrees-of-freedom ranging from 1 [linear spline] to 5).
All statistical analyses were performed using Stata (Stata Statistical Software, Release 16; StataCorp LLC, College Station, TX).
Third-party restrictions apply to the availability of the used data. The authors are therefore prevented from providing access or sharing the individual-level patient data.
Results
SCR cohort 1993-2014
Patient characteristics.
In the SCR cohort with 32 100 NHL patients, the median age at diagnosis was 70 years (interquartile range [IQR], 60-78 years), with a slight male predominance (55.1%) (Table 1). The distribution of the NHL patients between calendar periods showed a gradual increase in the number of NHL cases. The median follow-up time for the cohort was 7.1 years (IQR, 3.8-12.2 years).
IRs and HRs with 95% CIs of solid tumors and MDS/AML comparing lymphoma patients diagnosed 1993-2014, with follow-up through 2017, to matched population comparators in Sweden
| Solid tumors | MDS/AML | |||||||
|---|---|---|---|---|---|---|---|---|
| Lymphoma patients, n (%) | Comparators, n (%) | Events, n* | Rate* (per 1000 person-years) | HR (95% CI)†,‡ | Events, n* | Rate* (per 10 000 person-years) | HR (95% CI)†,‡ | |
| Comparators | − | 160 498 (100) | 22 485 | 16.0 (15.8-16.2) | 1.00 (ref) | 363 | 2.4 (2.2-2.7) | 1.00 (ref) |
| Patients | 32 100 (100) | − | 3 619 | 20.6 (19.9-21.3) | 1.4 (1.4-1.5) | 217 | 11.3 (9.9-12.9) | 5.2 (4.4-6.2) |
| Sex | ||||||||
| Male | 17 691 (55.1) | 88 454 (55.1) | 2 242 | 23.8 (22.8-24.8) | 1.40 (1.3-1.5) | 127 | 12.2 (10.3-14.5) | 5.0 (4.0-6.3) |
| Female | 14 409 (44.9) | 72 044 (44.9) | 1 377 | 16.9 (16.0-17.8) | 1.5 (1.4-1.5) | 90 | 10.2 (8.3-12.5) | 5.5 (4.2-7.2) |
| P§ | .326 | .602 | ||||||
| Age at diagnosis/matching date | ||||||||
| <70 y | 15 672 (48.8) | 78 360 (48.8) | 1 909 | 15.9 (15.2-16.6) | 1.3 (1.2-1.4) | 140 | 10.8 (9.2-12.8) | 7.2 (5.7-9.1) |
| ≥70 y | 16 428 (51.2) | 82 138 (51.2) | 1 710 | 30.6 (29.1-32.0) | 1.4 (1.4-1.5) | 77 | 12.2 (9.8-15.3) | 3.4 (2.6-4.4) |
| P§ | .006 | <.001 | ||||||
| Year of diagnosis/matching date | ||||||||
| 1993-1999 | 8 924 (27.8) | 44 619 (27.8) | 1 150 | 19.6 (18.5-20.8) | 1.5 (1.4-1.6) | 78 | 12.1 (9.7-15.1) | 5.9 (4.4-7.7) |
| 2000-2004 | 6 969 (21.7) | 34 845 (21.7) | 912 | 20.2 (18.9-21.6) | 1.4 (1.3-1.5) | 57 | 11.5 (8.9-14.9) | 6.5 (4.6-9.1) |
| 2005-2009 | 7 577 (23.6) | 37 885 (23.6) | 844 | 20.2 (18.9-21.7) | 1.3 (1.2-1.4) | 45 | 9.9 (7.4-13.3) | 4.3 (3.0-6.2) |
| 2010-2014 | 8 630 (26.9) | 43 149 (26.9) | 713 | 23.5 (21.8-25.2) | 1.4 (1.3-1.6) | 37 | 11.1 (8.1-15.4) | 3.9 (2.6-5.9) |
| P§ | .064 | .154 | ||||||
Events and rates by characteristics are presented for lymphoma patients only.
Mutually adjusted for matching factors sex, age at diagnosis, and calendar year of diagnosis.
Reference group: comparators.
From test for interaction.
Solid tumors
During follow-up, 3619 cases of solid tumors (first after NHL diagnosis) were observed among the NHL patients (IR, 20.6 per 1000 person-years; 95% CI, 19.9-21.3) and 22 485 cases among comparators (IR, 16.0 per 1000 person-years; 95% CI, 15.8-16.2). The median time from NHL diagnosis (or index date) to first solid tumor was 4.6 years (IQR, 2.1-8.5 years) for patients and 5.6 years (IQR, 2.7-9.9 years) for comparators.
The rate of solid tumors was 42% higher (HR, 1.4; 95% CI, 1.4-1.5) for patients than comparators when adjusted for matching factors and did not differ significantly by sex. NHL patients aged ≥70 years had a significantly higher rate (HR, 1.4; 95% CI, 1.4-1.5) of solid tumors than younger patents (HR, 1.3; 95% CI, 1.2-1.4) relative to comparators (P for interaction = .006). No significant effect modification was observed between different calendar periods of NHL diagnosis (P for interaction = .064) (Table 1; Figure 1).
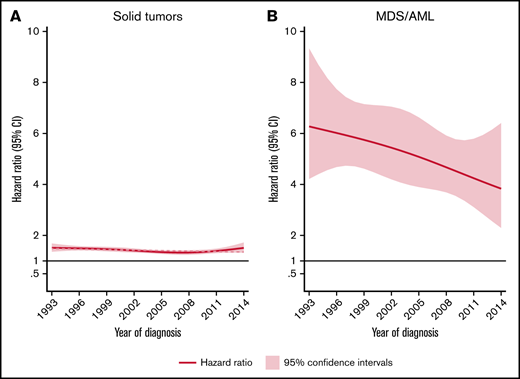
HRs and 95% CIs. Temporal trends of solid tumors (A) and MDS/AML (B), comparing lymphoma patients diagnosed 1993-2014 to matched population comparators.
HRs and 95% CIs. Temporal trends of solid tumors (A) and MDS/AML (B), comparing lymphoma patients diagnosed 1993-2014 to matched population comparators.
Analyses of specific solid cancer types revealed that the rate of cancer was higher in NHL patients (than for comparators) for 9 of 13 types assessed (Table 2). The excess rate was most prominent for nonmelanoma skin cancers (HR, 3.6; 95% CI, 3.3-3.8) but also significantly higher for cancer of the oropharynx and upper airway, gastrointestinal tract, lower respiratory system, bones and soft tissue, malignant melanomas, urinary tract, endocrine system, and cancer of unknown primary site (Table 2). We observed a slightly lower rate of cancers in the female genital organs in NHL patients than comparators (HR, 0.8; 95% CI, 0.7-1.0).
IRs and HRs with 95% CIs of different types of second primary solid tumors and hematological malignancies other than NHL and MDS/AML, comparing lymphoma patients diagnosed 1993-2014, with follow-up through 2017, to matched population comparators in Sweden
| Events, n | Median time to event years (IQR) | Rate (per 1000 person-years) | HR (95% CI)* | P | |
|---|---|---|---|---|---|
| Solid tumors | |||||
| Lip, oral cavity, pharynx, upper respiratory system | |||||
| Comparator | 560 | 5.8 (2.8-7) | 0.4 (0.4-0.4) | 1.0 (ref) | <.001 |
| Case | 117 | 4.3 (2.7-8.4) | 0.6 (0.5-0.8) | 1.8 (1.5-2.2) | |
| Gastrointestinal tract | |||||
| Comparator | 5182 | 5.7 (2.6-10.0) | 3.5 (3.4-3.6) | 1.0 (ref) | <.001 |
| Case | 742 | 4.6 (2.1-8.5) | 4.0 (3.7-4.3) | 1.27 (1.2-1.4) | |
| Lower respiratory system | |||||
| Comparator | 1926 | 5.6 (2.6-9.8) | 1.3 (1.2-1.4) | 1.0 (ref) | <.001 |
| Case | 331 | 5.2 (2.5-9.9) | 1.8 (1.6-2.0) | 1.5 (1.3-1.6) | |
| Thymus, bone cartilage and soft tissue sarcoma | |||||
| Comparator | 215 | 4.5 (2.3-9.6) | 0.1 (0.1-0.2) | 1.0 (ref) | <.001 |
| Case | 43 | 5.2 (2.6-9.3) | 0.2 (0.2-0.3) | 1.7 (1.2-2.4) | |
| Melanoma | |||||
| Comparator | 1136 | 6.2 (2.9-11.1) | 0.8 (0.7-0.8) | 1.0 (ref) | <.001 |
| Case | 224 | 4.8 (2.2-8.7) | 1.2 (1.1-1.4) | 1.7 (1.5-2.0) | |
| Nonmelanoma skin cancer | |||||
| Comparator | 2691 | 6.1 (2.8-10.9) | 1.8 (1.8-1.9) | 1.0 (ref) | <.001 |
| Case | 952 | 4.3 (2.0-8.2) | 5.2 (4.8-5.5) | 3.6 (3.3-3.8) | |
| Breast | |||||
| Comparator | 2265 | 5.6 (2.6-9.8) | 1.5 (1.5-1.6) | 1.00 (ref) | .252 |
| Case | 258 | 5.9 (2.8-10.7) | 1.4 (1.2-1.6) | 0.9 (0.8-1.1) | |
| Female genital organs | |||||
| Comparator | 1041 | 5.2 (2.5-9.6) | 1.5 (1.4-1.6) | 1.00 (ref) | .047 |
| Case | 103 | 5.1 (1.5-8.5) | 1.2 (1.0-1.5) | 0.8 (0.7-1.0) | |
| Male genital organs | |||||
| Comparator | 5574 | 5.6 (2.5-9.8) | 7.2 (7.0-7.4) | 1.00 (ref) | .578 |
| Case | 631 | 5.2 (2.3-9.3) | 6.4 (5.9-6.9) | 1.0 (0.9-1.1) | |
| Urinary tract | |||||
| Comparator | 2156 | 5.5 (2.7-10.0) | 1.5 (1.4-1.5) | 1.0 (ref) | <.001 |
| Case | 328 | 4.0 (1.2-8.4) | 1.8 (1.6-2.0) | 1.3 (1.2-1.5) | |
| Central nervous system | |||||
| Comparator | 435 | 5.5 (2.5-9.1) | 0.3 (0.3-0.3) | 1.0 (ref) | .087 |
| Case | 69 | 4.4 (1.5-8.9) | 0.4 (0.3-0.5) | 1.3 (1.0-1.6) | |
| Endocrine system | |||||
| Comparator | 337 | 4.8 (2.3-8.5) | 0.2 (0.2-0.3) | 1.0 (ref) | <.001 |
| Case | 73 | 2.3 (1.3-6.4) | 0.4 (0.3-0.5) | 1.7 (1.3-2.1) | |
| Ill-defined/unknown primary site | |||||
| Comparator | 796 | 5.0 (2.3-9.1) | 0.5 (0.5-0.6) | 1.0 (ref) | <.001 |
| Case | 145 | 4.2 (1.5-7.0) | 0.8 (0.7-0.9) | 1.6 (1.3-1.9) | |
| Hematological malignancies other than NHL and MDS/AML | |||||
| CML/MPN | |||||
| Comparator | 226 | 5.9 (3.0-11.7) | 0.2 (0.1-0.2) | 1.0 (ref) | .036 |
| Case | 39 | 3.5 (2.1-5.4) | 0.2 (0.2-0.3) | 1.4 (1.0-2.0) | |
| Hodgkin lymphoma | |||||
| Comparator | 33 | 6.0 (2.6-9.2) | 0.02 (0.02-0.03) | 1.0 (ref) | <.001 |
| Case | 37 | 6.0 (3.3-7.7) | 0.2 (0.1-0.3) | 8.7 (5.4-13.4) | |
| Multiple myeloma | |||||
| Comparator | 327 | 5.7 (2.6-9.4) | 0.2 (0.2-0.2) | 1.0 (ref) | .854 |
| Case | 37 | 4.9 (2.6-8.6) | 0.2 (0.1-0.3) | 1.0 (0.7-1.4) | |
| Lymphatic leukemia† | |||||
| Comparator | 37 | 5.4 (2.9-8.6) | 0.02 (0.02-0.03) | 1.0 (ref) | <.001 |
| Case | 17 | 3.4 (1.2-5.9) | 0.1 (0.1-0.1) | 3.7 (2.1-6.6) | |
Mutually adjusted for sex, age at diagnosis, and calendar year of diagnosis.
ALL and lymphoblastic/lymphocytic leukemia unspecified.
Hematological malignancies
Among NHL patients, 217 cases of MDS/AML were observed, compared with 363 among comparators, corresponding to an IR of 11.1 per 100 000 person-years (95% CI, 9.9-12.9) for patients, and 2.4 per 100 000 person-years (95% CI, 2.2-2.7) for comparators. Fourteen out of 61 MDS patients found among NHL survivors subsequently developed AML (the latter was not included as an outcome in the analysis) with a median of 4.7 months between the MDS and AML diagnoses (range, 0.4-23.5 months). Among comparators, 91 MDS cases were found, out of which 9 progressed to AML (median interval 11.2 months; range, 2.8-17.5 months).
The rate of MDS/AML was 5-fold increased for the NHL patients (HR, 5.2; 95% CI, 4.4-6.2) than for comparators. The median time to MDS/AML diagnosis among NHL patients was 4.2 years (IQR, 2.2-8.0 years). Although the absolute rates of MDS/AML were similar for patients below and above 70 years at NHL diagnosis (Table 1), there was evidence of interaction (P ≤ .001) with respect to the relative rates (with young patients having significantly larger excess rates than old patients, reflecting the lower background incidence of MDS/AML in younger individuals). With regard to temporal trends in MDS/AML risk, a tendency toward a reduced excess rate among NHL patients was seen during the more recent years (Figure 1B). This pattern was, however, not statistically significant when applying a test for linear trend (P = .125).
Excess rates were also seen for MPN, including CML (HR, 1.4; 95% CI, 1.0-2.03), and for lymphatic leukemias (excluding CLL) (HR, 3.7; 95% CI, 2.1-6.6). A pronounced excess rate was also observed for Hodgkin lymphoma (HR, 8.7; 95% CI, 5.4-13.9).
SLR cohort 2000-2014
In the subcohort of 21 695 NHL patients diagnosed and registered in the SLR 2000-2014, we assessed MDS/AML as the sole outcome. The median age at diagnosis in this cohort and distribution of sex was virtually the same as in the SCR cohort (Table 3). The median follow-up time was 7.1 years (IQR, 4.3-10.11). A total of 131 cases with MDS/AML were observed among NHL patients and 206 among comparators. The median time to MDS/AML among the patients was 3.7 years (IQR, 1.8-6.2). The absolute incidence rates were similar to those estimated in the SCR cohort, as were the excess rate of MDS/AML in the patients (HR, 4.8; 95% CI, 3.9-6.0). The excess rate was stable across the study period (supplemental Figure 2). Moreover, we observed no global evidence of effect modification by NHL aggressiveness or by major NHL subtypes. However, the excess rate of MDS/AML was highest for T-cell lymphoma patients (HR, 8.5; 95% CI, 4.0-18.2) (Table 3).
IRs and HRs with 95% CIs of MDS/AML comparing NHL patients in the SLR subcohort to matched population comparators
| Patients, n | Events, n | Rate(per 10 000 person-years) | HR(95% CI)* | P interaction | |
|---|---|---|---|---|---|
| Comparators | 108 474 | 206 | 2.4 (2.1-2.7) | 1.00 (ref) | NA |
| All NHL combined | 21 695 | 131 | 10.7 (9.0-12.7) | 4.8 (3.9-6.0) | |
| Sex† | |||||
| Male | 12 072 | 76 | 11.4 (9.1-14.2) | 4.7 (3.5-6.3) | .750 |
| Female | 9 623 | 55 | 10.0 (7.7-13.0) | 5.0 (3.6-7.1) | |
| Age at diagnosis† | |||||
| <70 y | 10 770 | 81 | 10.1 (8.2-12.6) | 7.8 (5.6-10.7) | <.001 |
| ≥70 y | 10 925 | 50 | 11.9 (9.0-15.6) | 3.1 (2.3-4.3) | |
| Period of diagnosis† | |||||
| 2000-2004 | 6 600 | 51 | 10.8 (8.2-14.2) | 6.0 (4.2-8.6) | .321 |
| 2005-2009 | 7 313 | 45 | 10.2 (7.6-13.7) | 4.5 (3.1-6.5) | |
| 2010-2014 | 7 782 | 35 | 11.4 (8.2-15.8) | 4.0 (2.6-6.1) | |
| Lymphoma group† | |||||
| Low-grade NHL | 10 091 | 57 | 8.8 (6.8-11.3) | 4.1 (3.0-5.7) | .355 |
| High-grade NHL | 11 088 | 70 | 12.8 (10.1-16.2) | 5.6 (4.2-7.6) | |
| Other/unknown | 516 | 4 | 17.7 (6.6-47.1) | 6.2 (1.7-21.8) | |
| Lymphoma subtype† | |||||
| Diffuse large B cell | 8 144 | 46 | 11.0 (8.3-14.7) | 5.1 (3.5-7.5) | .657 |
| Follicular | 3 593 | 27 | 10.2 (7.0-14.8) | 5.4 (3.2-9.0) | |
| Mantel cell | 1 360 | 9 | 15.1 (7.9-29.1) | 4.9 (2.2-10.9) | |
| Marginal zone | 1 298 | 6 | 7.0 (3.2-15.6) | 3.0 (1.1-8.0) | |
| Burkitt | 227 | 2 | 15.0 (3.8-60.2) | 3.2 (0.6-16.5) | |
| T cell | 1 648 | 13 | 17.0 (9.9-29.2) | 8.5 (4.0-18.2) | |
| Other | 5 425 | 28 | 9.3 (6.4-13.4) | 4.1 (2.6-6.4) | |
P values from tests for interaction.
Mutually adjusted for sex, age at diagnosis, and calendar year of diagnosis.
Restricted to NHL cases.
The excess rate of MDS/AML was generally stable throughout the study period (Table 3; supplemental Figure 1). There was a tendency of a decreased excess rate among low-grade NHL, but the trend was not statistically significant (P for trend = .08) (Figure 2). No changes were observed over time in high-grade NHL. For morphological subtypes, a stable HR was seen for DLBCL and T-NHL, whereas in patients with FL, a significant linear trend toward normalization of risk was demonstrated in patients diagnosed after 2009 (P for trend = .012) (Figure 2).

HRs and 95% CIs for temporal trends of MDS/AML, comparing lymphoma patients diagnosed 2000-2014 to comparators by lymphoma subtype in the Swedish Lymphoma Register cohort.
HRs and 95% CIs for temporal trends of MDS/AML, comparing lymphoma patients diagnosed 2000-2014 to comparators by lymphoma subtype in the Swedish Lymphoma Register cohort.
Discussion
In this large, population-based matched cohort study, we demonstrated a 5-fold higher risk for MDS/AML and an excess risk of 1.4 for solid tumors among NHL patients, compared with the matched general population. Overall, the excess risk remained stable over time with the exception of patients with FL, for whom the excess risk of MDS/AML diminished in later time periods. This is the first study to show a clear decrease in risk of MDS/AML among contemporaneously treated FL patients.
The excess risk of SPM in NHL demonstrated in our study is in line with previous literature, although prior studies vary in terms of design and sources of the study populations and most often lack data regarding subtypes.4-14 In a 2011 meta-analysis, Pirani et al found pooled relative risks of 1.88 for any secondary cancer and relative risk of 1.32 for solid tumors among patients with NHL.11 However, unlike the present study, none of the included studies covered the period after the introduction of rituximab into standard treatments for B-cell lymphomas. The fact that a similar risk of SPM was found in our study is thus reassuring, as there have been concerns that the B-cell depletion and decreased T-cell activity induced by rituximab may increase the risk of SPM.24
Brennan et al found a similar increase in the overall SPM risk in a large multinational pooled-register study (standardized incidence ratios [SIR], 1.47).5 Here, the risks of myeloid malignancies were markedly lower than in our study, which could perhaps be attributed to advancements in the diagnostics and classification of these diseases.
In a more recent register study, using data from the Surveillance, Epidemiology, and End Results (SEER) program, Tward et al found an SIR of 1.14 for SPMs overall, which is considerably lower than our findings, perhaps partly explained by a longer follow-up.14 Moreover, Bermejo et al studied pooled register data from 3 Nordic countries between 1980 and 2006.9 They present a relative risk of 2.11 for solid cancers among NHL patients. However, median follow-up was limited to 2 years, which could explain the higher risk.
In our study, we observed a great variation in the risk of different types of SPM. The risk of nonmelanoma skin cancer was noticeably high, which may be caused by surveillance bias and/or immunosuppression from NHL treatment.25 In contrast, increased risk for breast cancer was not seen, as is commonly shown in Hodgkin lymphoma survivors, where radiation therapy is part of standard therapy.26 Further, no increased risks for male genital cancer (including prostate cancer) or female genital cancer were observed. This is in line with a risk reduction of uterine cancer reported in the meta-analysis by Pirani et al11 and may imply protective antihormonal mechanisms following the NHL diagnosis and treatment, although the nature of epidemiological studies such as this precludes verification of causation and biological links.
Regarding hematological malignancies other than MDS/AML, we found a prominent rate increase for Hodgkin lymphoma. However, this result should be interpreted with caution as some of these may represent initial misclassification or transformations with the same cell-of-origin as the original NHL.27 The same applies to lymphatic leukemia, for which we also saw an increased risk among NHL patients.
At the subtype level, the incidence of MDS/AML did not differ significantly by NHL subtype, nor by stratification into high- and low-grade lymphoma. It is still noteworthy that T-cell lymphoma patients had a prominent >8-fold excess MDS/AML risk, although the number of events was small (n = 13).
During the study period, a gradual increase in the annual number of NHL cases was observed, reflecting previously described rising incidence and population growth.1 In NHL overall, no statistically significant temporal trends for excess risks of either solid cancers or MDS/AML were found during the study period. However, by NHL subtype, the excess risk for MDS/AML among patients with FL diminished over time, with a risk for MDS/AML comparable to the risk in the general population for patients diagnosed after 2009. This could potentially be explained by the paradigm shift in the management of FL and other low-grade B-cell lymphoma subtypes, with biological treatments such as rituximab monotherapy replacing or delaying chemotherapy and diminishing the need for radiation therapy in many cases.28
The fact that we see no temporal trends for SPM risk in all NHL indicates that the changes in treatment protocols during the study period have not been associated with a general change in the risk for SPM. Still, it is generally accepted that DNA damage due to chemotherapy and radiation therapy can lead to the development of new cancers.29 Furthermore, extensive investigations with medical imaging containing ionizing radiation may also increase cancer risk, although this causal relationship is less established.30 However, comparison between calendar periods is complicated as modern front-line treatment, which could potentially cause more DNA damage, may, in turn, be more effective, avoiding second-line treatments and thus reducing overall treatment toxicity. Other potential explanatory factors for increased risk of SPM among NHL patients include the extensive medical investigations performed at lymphoma diagnosis and subsequent frequent health care contacts which may identify new cancers. To minimize this potential bias in our study, we excluded all cancer diagnoses made within 1 and 3 months from the time of NHL diagnosis for MDS/AML and other cancers, respectively. Still, surveillance bias may account for some of the increased risks for SPM seen for NHL survivors in our study.
Another contributing factor to the increased risk of SPM among patients with NHL may be the immunosuppression, in particular T-cell suppression, caused by chemotherapy and steroids, a well-known risk factor for developing cancer.31 Biological links between the cells of origin of the NHL and SPM could in some cases also explain the excess risk observed in this study. An interesting example is the reported preexisting clonal hematopoiesis and common genetic aberrations linking some T-cell lymphoma subtypes to myeloid neoplasms,32 which could correspond to the excess rates of MDS/AML that were observed in T-cell lymphoma patients. Lastly, the data used to conduct this study did not include information on usual cancer risk factors, neither environmental nor genetic. Genetic predisposition to cancer is a potential risk factor for SPM, and, unfortunately, data regarding familial aggregation of cancer was not available in our NHL cohort, although the proportion of patients with familial predisposition to cancer in our study is likely low.
The strength of the present study is the large study population with unselected, consecutive patients with NHL, with subtype data available for a well-defined subcohort. Another advantage is the use of a matched (NHL-free) cohort for the calculation of cancer incidence rates in the general population rather than reported population statistics for cancer incidence. Further, a long tradition of collecting data in quality registers in Sweden enables the use of high-quality data sets with long follow-up times. Still, reliable subtype data are not available in the SCR,20 limiting subtype analyses to 2000 and onward when the SLR was established.2 Due to the rarity of SPMs, events are few despite our large study population, which hampered risk comparisons between subtypes. A limitation of the present study is the lack of detailed treatment data precluding us from analyzing associations between specific treatment and SPM risk (and even longer follow-up would be needed to fully evaluate risks of solid cancers, eg, in association with radiotherapy). Thus, further research is warranted to assess such associations to enable preventive measures such as adjustments in the treatment of NHL or adapted follow-up strategies for patients at high risk for SPM.
To conclude, NHL survivors are still at an increased risk of SPMs, both solid cancers and MDS/AML, following contemporaneous treatment protocols. Encouragingly, for patients with FL, the risk for secondary MDS/AML has diminished during the most recent decade.
Acknowledgment
This work was supported by the Nordic Cancer Union (grant: R241-A15031).
Authorship
Contribution: S.E., K.E.S., T.W., and J.J. designed the study; J.J., K.E.S., and S.E. retrieved the data and performed data preparations and the statistical analyses; S.E., K.E.S., T.W., and J.J. led the writing of the manuscript; and all authors interpreted the data and edited the manuscript.
Conflict-of-interest disclosure: R.R. reports honoraria from Abbvie, AstraZeneca, Janssen, Illumina, and Roche. T.C.E.-G. reports previous employment with Roche and speakers fee from Abbvie. L.H.J. reports honoraria for Takeda and Roche. K.E.S. is part of a research collaboration (unrelated to the present work) between Karolinska Institutet and Janssen Pharmaceutica NV for which Karolinska Institutet receives grant support (Ref: 5-63/2015). The remaining authors declare no competing financial interests.
Correspondence: Sandra Eloranta, Clinical Epidemiology Division T2, Department of Medicine Solna, Karolinska Institutet, Karolinska University Hospital, SE-171 76 Stockholm, Sweden; e-mail: sandra.eloranta@ki.se.

