

Key Points
Agglomeration and capture of agglomerates after travelling a lag distance of >100 µm creates SIPA as fast as 10 milliseconds.
Phase diagrams of SIPA controlled by VWF length and concentration provide mechanistic insights for various thrombotic and hemostatic events.

Abstract
Shear-induced platelet aggregation (SIPA) occurs under elevated shear rates (10 000 s−1) found in stenotic coronary and carotid arteries. The pathologically high shear environment can lead to occlusive thrombosis by SIPA from the interaction of nonactivated platelets and von Willebrand factor (VWF) via glycoprotein Ib–A1 binding. This process under high shear rates is difficult to visualize experimentally with concurrent molecular- and cellular-resolutions. To understand this fast bonding, we employ a validated multiscale in silico model incorporating measured molecular kinetics and a thrombosis-on-a-chip device to delineate the flow-mediated biophysics of VWF and platelets assembly into mural microthrombi. We show that SIPA begins with VWF elongation, followed by agglomeration of platelets in the flow by soluble VWF entanglement before mural capture of the agglomerate by immobilized VWF. The entire SIPA process occurs on the order of 10 milliseconds with the agglomerate traveling a lag distance of a few hundred microns before capture, matching in vitro results. Increasing soluble VWF concentration by ∼20 times in silico leads to a ∼2 to 3 times increase in SIPA rates, matching the increase in occlusion rates found in vitro. The morphology of mural aggregates is primarily controlled by VWF molecular weight (length), where normal-length VWF leads to cluster or elongated aggregates and ultra-long VWF leads to loose aggregates seen by others’ experiments. Finally, we present phase diagrams of SIPA, which provides biomechanistic rationales for a variety of thrombotic and hemostatic events in terms of platelet agglomeration and capture.
Introduction
Arterial thrombosis can lead to acute myocardial infarction or stroke, which are the leading cause of mortality in developed countries.1,2 The explosive growth of thrombus at an atherosclerotic stenosis requires rapid accumulation of platelets against wall shear rates (WSRs) typically above 10 000 s−1.3,4 Distinct from stagnant blood clotting that can be explained by Virchow’s triad, high shear thrombosis depends on an alternative triad that includes necessary blood constituents such as platelets and von Willebrand factor (VWF), a high shear environment, and a thrombotic surface such as subendothelial collagen matrix that adsorbs VWF.5-7 Occlusive arterial thrombosis has been successfully recreated in the laboratory using in vitro, ex vivo and in vivo experiments.3,8-11 Shear-induced platelet aggregation (SIPA), as the main driver of occlusive arterial thrombosis, is found to exclusively depend on glycoprotein Ib (GPIb-A1) bond formation independent of platelet activation.9,12-15
In addition to the macroscopic understanding of arterial thrombosis, considerable efforts have been dedicated to unraveling the suspension dynamics16-18 and binding kinetics19-22 of VWF given its crucial role in supporting platelet adhesion under elevated high shear.23 At the single-molecule level, the GPIb-A1 kinetic on rates have been measured19 or estimated24 to vary from 106 to 109 M−1s−1 to M−1s−1. This is much faster than the typical on rate (~ M−1s−1) of IIbIII-fibrinogen bond,25 which typically supports platelet adhesion and aggregation after platelet activation or at low shear rates (∼100 s−1).15 The GPIb-A1 bond lifetimes have also been measured to be ∼0.1 to 10 s using single-molecule techniques such as atomic force microscopy and optical tweezers,20,22,21 where often static flow conditions were imposed. Moreover, when exposed to sufficiently high shear rates (>6000 s−1), the tertiary structure of VWF changes from a globular state to elongated state, thus exposing more A1 domains available for multivalency24 and elevated binding affinity.16
The transit of platelets through a stenosis occurs in milliseconds over a distance of a few hundred microns,24,26 making it difficult to resolve the biophysical mechanism purely from experiment. Although GPIb-A1 binding kinetics can be measured at single-molecule level, the assembly of VWF and platelets into mural microthrombi involves both molecular- and cellular-level information that have generally not been integrated within a high-shear flow environment. To understand the biophysics of SIPA, we employ a multiscale in silico thrombosis model18,26-31 combined with in vitro thrombosis-on-a-chip experiments.12,32 We hypothesize that SIPA can be reconstructed in silico by simulating soluble VWF and nonactivated platelets in blood plasma, a thrombotic surface adhered with immobilized VWF, and a pathologically high-shear environment. Our in silico model predicts SIPA with good agreement with several experiments regarding the spatiotemporal characteristics of platelet aggregates. We then show that SIPA may be controlled by varying the VWF length and concentration, which further controls macroscopic thrombosis. Our SIPA model is shown to be a useful scale-bridging tool that can provide possible biophysical rationale for a variety of thrombotic and hemostatic pathologies.
Materials and methods
In silico multiscale model system based on the high-shear thrombosis triad
Occlusive atherothrombosis in an arterial stenosis (Figure 1A) occurs under pathologically high-shear conditions.3 In the high-shear environment, the mechanism for arterial thrombus formation is distinct from that required for the low-shear thrombosis (such as deep venous thrombosis) based on Virchow’s Triad.5,33 Specifically, the triad for occlusive atherothrombosis5-7 (Figure 1B) includes (1) platelets and VWF, (2) pathologically high shear rates (∼10 000 s−1), and (3) a prothrombotic surface such as collagen to adhere VWF (Figure 1B). Figure 1B schematically shows a microaggregate successfully formed in silico based on this triad. Our validated multiscale computational blood flow and clotting model18,26-31 for SIPA pertinent to the arterial thrombosis is selectively built upon these critical pathophysiological ingredients while neglecting other less contributory components for SIPA such as coagulation factors. The platelet and VWF conditions are set to mimic those in humans.27 Figure 1C schematically denotes the framework of the multiscale in silico model. More details of the model can be found in supplemental Materials.
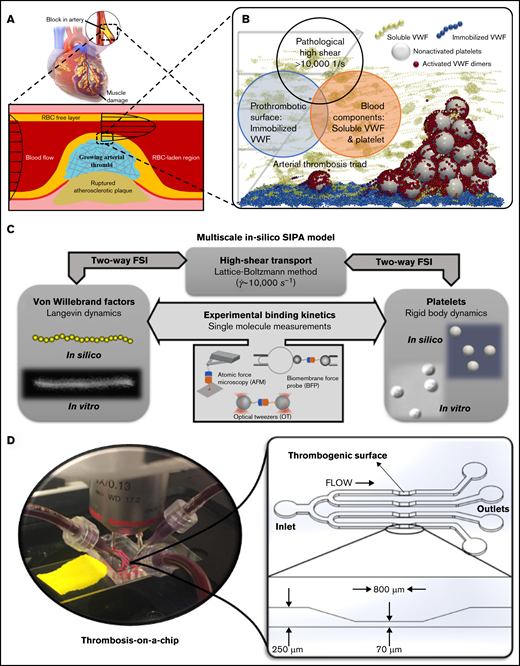
The biological basis, framework, and in vitro tool for the multiscale in silico model of SIPA. (A) Atherosclerosis creates a stenosis with wall shear rate to above 10 000 s−1, leading to an acute arterial thrombus if the plaque cap ruptures. (B) At the exposed collagen surface, SIPA stems from nonactivated platelets and VWF. We virtually construct SIPA in a computational model including immobilized VWF dimers as blue beads on the surface, soluble VWF depicted as yellow strings, and GPIb-A1 bonds as red beads. (C) Framework of the multiscale in silico method.26 VWFs and platelets are modeled in silico to match their biological counterparts based on in vitro measurements.14,16 The dynamics of VWF strands and platelets suspended in the blood subjected to high shear rates are resolved through the coupling among lattice-Boltzmann method, Langevin-dynamics, and rigid body dynamics with fluid-structure interactions (FSI). Platelet and VWF binding kinetics are incorporated to the model, where the kinetic rates can be measured through single-molecular measurements such as biomembrane force probe,50,51 optical tweezers,20,21 atomic force microscopy,52 etc. (D) A low-variability, high-throughput thrombosis-on-a-chip platform12 is used for the validation of the in silico results. Panels C and D partially adopt figures from previous publications14,16,32 with permission.
The biological basis, framework, and in vitro tool for the multiscale in silico model of SIPA. (A) Atherosclerosis creates a stenosis with wall shear rate to above 10 000 s−1, leading to an acute arterial thrombus if the plaque cap ruptures. (B) At the exposed collagen surface, SIPA stems from nonactivated platelets and VWF. We virtually construct SIPA in a computational model including immobilized VWF dimers as blue beads on the surface, soluble VWF depicted as yellow strings, and GPIb-A1 bonds as red beads. (C) Framework of the multiscale in silico method.26 VWFs and platelets are modeled in silico to match their biological counterparts based on in vitro measurements.14,16 The dynamics of VWF strands and platelets suspended in the blood subjected to high shear rates are resolved through the coupling among lattice-Boltzmann method, Langevin-dynamics, and rigid body dynamics with fluid-structure interactions (FSI). Platelet and VWF binding kinetics are incorporated to the model, where the kinetic rates can be measured through single-molecular measurements such as biomembrane force probe,50,51 optical tweezers,20,21 atomic force microscopy,52 etc. (D) A low-variability, high-throughput thrombosis-on-a-chip platform12 is used for the validation of the in silico results. Panels C and D partially adopt figures from previous publications14,16,32 with permission.
In vitro thrombosis-on-a-chip platform
Validation tests were run on a microfluidic thrombosis-on-a-chip system (Figure 1D) developed by our group,12,32 based on the high-shear thrombosis triad.32 Lightly heparinized human blood was used as the source of platelets and VWF, following previous studies.13,34 Channels are precoated with type 1 fibrillar collagen (100 ug/mL) (Chronopar, Chronolog, Inc.) as a thrombogenic surface to form an immobilized VWF (iVWF) layer. The flow is driven by the hydraulic height to impose an elevated WSR (∼10 000 s−1) at the stenotic section. For tests visualizing the aggregate location, a total of 40 channels were run with blood from 10 different donors. For the tests with altered VWF concentration, 12 channels with blood from a single healthy donor were run for each condition.
Blood collection and handling
Blood was collected from healthy volunteers recruited in accordance with the Georgia Tech Institutional Review Board. All subjects were older than 18 and had not taken any antiplatelet medications within 10 days prior to the blood draw. Subjects with known anemia, transmittable blood diseases, or bleeding disorders were excluded from the study. Blood was drawn into a 60 mL syringe containing 3.5 United States Pharmacopeia units per milliliter heparin using standard phlebotomy techniques. All controls occluded the channel in ∼240 s with ∼10% variability, implying a comparable soluble VWF (sVWF) level among all subjects. Immediately prior to testing, blood was diluted by adding phosphate-buffered saline or Alphanate (Grifols, S.A.) purified VWF solution at a ratio of 0.35 mL dilutant per 1 mL blood. Each 0.35 mL of Alphanate contains 95 IU VWF, raising the sVWF concentration to 20 times normal in 5 mL blood (normal concentration is estimated based on Casa et al35 ). Dilution tests 0.1 times normal sVWF follows published protocol35 without cell restoration as restoration does not affect SIPA under this concentration. Tests were run within 4 hours of collection.
Definition of endpoints
For in silico tests, we define agglomeration level as the compactness of platelet clusters quantified by /, where is the number of platelet pairs that are in contact and is the total number of platelets. The formed platelet clusters are termed agglomerates. Once an agglomerate is firmly captured on the thrombotic surface, it becomes a platelet aggregate as is often called in the thrombosis field. To quantify the capture of platelet agglomerates, we define a superficial velocity as the ensemble averaged velocity of all platelets normalized by the average fluid velocity. Integrating the dimensional superficial velocity (without normalization) over time defines a lag distance of the platelet agglomerate before its mural capture. For in vitro tests, we define average pixel intensity (API) to quantify the intensity of aggregate accumulation following previous study.35 We use occlusion time (OT) to quantify the rate of SIPA in vitro. The OT is defined as the time between blood entering the device and the mass accumulation at the outlet peaks (supplemental Materials; supplemental Figure 1B). Experimental statistics are based on mean plus or minus standard deviation (SD). Statistical significance (p < .05) was evaluated by unpaired Student's t test.
Results
Platelet agglomerates form in flow prior to surface capture
The dynamical process of SIPA is demonstrated in Figure 2, where we describe the process as 3 characteristic stages. Stage 1 (Figure 2A-C) features the elongation of VWF. With the shear rate beyond the critical shear rates (∼6000 s−1) for VWF elongation (also known as unfolding),16 the elongation event is shown to occur as fast as 0.2 milliseconds (Figure 2B) using an experimentally determined Lennard-Jones potential well depth.16,18 The change of VWF conformation from globular state to elongated state exposes many VWF A1 domains and extends the reach of the sVWF polymers to entangle several platelets simultaneously. During stage 1, the number of exposed GPIb-A1 bonds grows geometrically, with ∼1000 bonds available to bind within 1 millisecond as shown in Figure 2J.
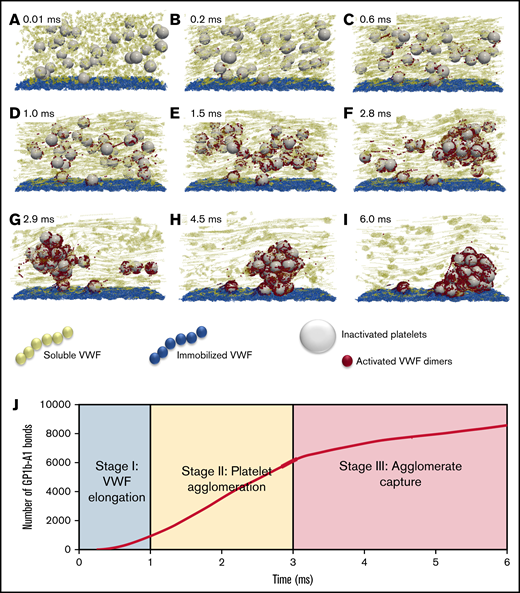
The time-lapse snapshots of SIPA divided into 3 stages. (A-C) Stage 1: VWF elongation. The activation of VWF requires its conformational change from a globular state to an elongated state. (D-F) Stage 2: agglomeration. Elongated soluble VWFs entangle platelets and form platelet agglomerates in flow. (G-I) Stage 3: capture. Suspended agglomerates contact the thrombotic surface (preadhered with immobilized VWF), roll, and eventually adhere to the surface and become a mural platelet aggregate. (J) The number of GPIb-A1 bonds over time. The number of GPIb-A1 bonds shows faster growth at stage 2 (agglomeration) compared with stage 1 and stage 3. The specific simulation here is performed at a shear rate of 10 000 s−1 with an sVWF concentration of 3 times normal plasma (NP)-VWF concentration and a VWF length of 1.6 m. The 3 times VWF concentration is selected to ensure 1 complete SIPA process would occur.
The time-lapse snapshots of SIPA divided into 3 stages. (A-C) Stage 1: VWF elongation. The activation of VWF requires its conformational change from a globular state to an elongated state. (D-F) Stage 2: agglomeration. Elongated soluble VWFs entangle platelets and form platelet agglomerates in flow. (G-I) Stage 3: capture. Suspended agglomerates contact the thrombotic surface (preadhered with immobilized VWF), roll, and eventually adhere to the surface and become a mural platelet aggregate. (J) The number of GPIb-A1 bonds over time. The number of GPIb-A1 bonds shows faster growth at stage 2 (agglomeration) compared with stage 1 and stage 3. The specific simulation here is performed at a shear rate of 10 000 s−1 with an sVWF concentration of 3 times normal plasma (NP)-VWF concentration and a VWF length of 1.6 m. The 3 times VWF concentration is selected to ensure 1 complete SIPA process would occur.
Stage 2 (Figure 2D-F), termed the agglomeration stage, is characterized by the formation of agglomerates in the flow due to the entanglement of platelets by sVWF through GPIb-A1 bonds. The separated platelets gradually assemble into a compact cluster (Figure 2F). During this stage, the number of GPIb-A1 bonds increases linearly from ∼1000 to ∼6000 bonds within ∼2 milliseconds, spanning ∼30 platelets (Figure 2J). Thus, ∼200 GPIb-A1 bonds per platelet seems to be sufficient to induce a cluster-like agglomerate in the flow.
Stage 3 (Figure 2G-I), termed the capture stage, initiates when the agglomerate grows sufficiently large that it reaches the iVWF surface (Figure 2G). The agglomerate translates and rolls on the iVWF surface for ∼3 milliseconds until firmly captured (Figure 2I). As shown in Figure 2J, the number of GPIb-A1 bonds continues to grow at a slower rate compared with the agglomeration stage. The growth of GPIb-A1 bonds in this period is presumably due to the binding of the iVWF A1 domains to free-platelet GP1b to capture the agglomerate. The drag force exerted on the platelet agglomerate can be estimated as according to the Stokes drag law, where is a characteristic diameter of a captured agglomerate and is the WSR. Using and 10 000 s−1, the drag force can be calculated as ∼6000 pN. Considering ∼2000 GPIb-A1 bonds formed during stage 3, each bond therefore experiences a ∼3 pN force on average, which is well below the bond rupture force limit (∼10-40 pN),13,20-22 confirming the feasibility for agglomerate capture.
SIPA is different from platelet rolling and platelet adhesion
Adhesion and rolling: To validate the computational framework for capturing the flow-mediated platelet-VWF binding, we simulated the rolling of single platelets on a VWF-A1–coated surface (A1 density is 10 ng/) under 2 levels of shear rates (1000 and 10 000 ) and compared with those measured in vitro by Yago et al.36 Figure 3A shows the instantaneous rolling velocity of a single platelet, where large fluctuations of instantaneous velocity are observed, similar to those reported in leukocyte rolling.37 Overall, the average rolling velocity calculated in silico agrees well with the experimental rolling velocity (Figure 3B), demonstrating the validity of the computational framework for platelet adhesion onto VWF via GPIb-A1 bond formation and rupture.26
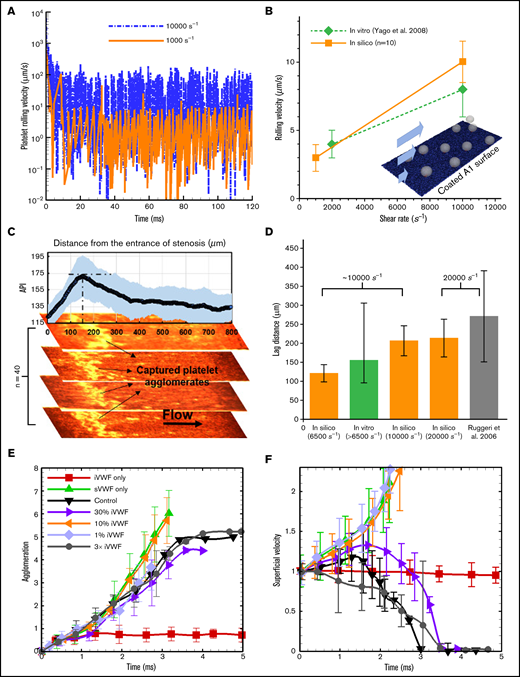
Agglomeration and capture define a lag distance in SIPA with different dependences on sVWF and iVWF. (A) The computed rolling velocity of a single platelet on a VWF-A1–coated surface under 2 shear rates. (B) The averaged rolling velocity (n = 10) compares favorably with existing in vitro measurements. (C) The capture of platelet agglomerates occurs after a lag distance of around 150 m in our thrombosis-on-a-chip device. The plot shows the API (n = 40) vs the distance from the entrance of the stenotic section, where the peak API denotes the location that most of the aggregates appear. The snapshots show representative occluded channels; the bright color denotes the captured platelet agglomerates. Flow is from left to right. (D) The lag distance of platelet agglomerates calculated from our in silico model compared against those observed in our and Ruggeri’s in vitro settings. The initial WSR of our in vitro setting is 6500 s−1, which would increase as the channel occludes.3 The WSR of the experiment setting by Ruggeri et al.13 is ∼20 000 s−1. Three WSRs, 6500, 10 000, and 20 000 s−1, were simulated, where the VWF/platelet conditions are the same as the experiment. Each in silico data (mean and SD) is based 6 runs with different VWF lengths (changing from 1.6 to 6.4 m). The lag distance (mean and SD) from Ruggeri et al is estimated from the dispersed number of platelet aggregates shown in Figure 2A taken after 7 s of whole blood perfusion. API of 175 and above is used to quantify the thrombus location. (E) The agglomeration level plotted against time. Agglomeration depends on sVWF but is insensitive to the presence of iVWF. (F) The superficial velocity (normalized by volume-averaged fluid velocity of ∼1.2 cm/s) plotted against time. The capture of the agglomerate requires the presence of iVWF, although excessive iVWF level does not shorten the lag distance. For panels E and F, a 6× normal sVWF concentration was used to obtain a faster capture event.
Agglomeration and capture define a lag distance in SIPA with different dependences on sVWF and iVWF. (A) The computed rolling velocity of a single platelet on a VWF-A1–coated surface under 2 shear rates. (B) The averaged rolling velocity (n = 10) compares favorably with existing in vitro measurements. (C) The capture of platelet agglomerates occurs after a lag distance of around 150 m in our thrombosis-on-a-chip device. The plot shows the API (n = 40) vs the distance from the entrance of the stenotic section, where the peak API denotes the location that most of the aggregates appear. The snapshots show representative occluded channels; the bright color denotes the captured platelet agglomerates. Flow is from left to right. (D) The lag distance of platelet agglomerates calculated from our in silico model compared against those observed in our and Ruggeri’s in vitro settings. The initial WSR of our in vitro setting is 6500 s−1, which would increase as the channel occludes.3 The WSR of the experiment setting by Ruggeri et al.13 is ∼20 000 s−1. Three WSRs, 6500, 10 000, and 20 000 s−1, were simulated, where the VWF/platelet conditions are the same as the experiment. Each in silico data (mean and SD) is based 6 runs with different VWF lengths (changing from 1.6 to 6.4 m). The lag distance (mean and SD) from Ruggeri et al is estimated from the dispersed number of platelet aggregates shown in Figure 2A taken after 7 s of whole blood perfusion. API of 175 and above is used to quantify the thrombus location. (E) The agglomeration level plotted against time. Agglomeration depends on sVWF but is insensitive to the presence of iVWF. (F) The superficial velocity (normalized by volume-averaged fluid velocity of ∼1.2 cm/s) plotted against time. The capture of the agglomerate requires the presence of iVWF, although excessive iVWF level does not shorten the lag distance. For panels E and F, a 6× normal sVWF concentration was used to obtain a faster capture event.
Lag distance: Distinct from platelet adhesion that involves platelet rolling starting from the entrance of the high-shear region, formation of mural aggregates requires a SIPA process involving the transport and assembly of platelet and VWF in the flow. As a result, our model predicts that platelet aggregates do not form for the initial ∼10 milliseconds at the entrance of a high-shear zone. Under fixed WSRs of 6500, 10 000, and 20 000 , we calculated average lag distances as 121, 206, and 212 µm (n = 6), respectively (Figure 3D), where the lag distance increases with shear rate. To validate these in silico predictions, we carried out platelet aggregation experiments (n = 40) under an initial WSR of 6500 , where the WSR would typically increase as thrombus accumulates.3 We observed platelet aggregates accumulate at a region that is an average of ∼155 m from the entrance of high-shear region (Figure 3C-D), lying in between our in silico results for 6500 and 10 000 . Separately, Ruggeri et al.13 observed a lag distance of in their microfluidic setting under a WSR of ∼20 000 , which also agrees well with our lag distance of 21250 m in silico. Overall, both in vitro and in silico results suggest a lag distance of at least 100 m in order for the agglomerate to be captured.
The specific roles of sVWF and iVWF in SIPA are different in the SIPA process, although both can elongate. To identify these roles, we selectively vary the concentrations of sVWF and iVWF separately in our simulation (which is difficult to realize in vitro).
sVWF controls agglomeration: Increasing sVWF concentration to 6 normal shortens the time required to create SIPA (data not graphed). Conversely, removing sVWF eliminates the platelet agglomeration as shown in Figure 3E, consistent with previous in vitro observations.13 With no sVWF, only a few platelets are captured by the iVWF with most platelets having a superficial velocity around 1 (moving with the background fluid), shown in Figure 3F. In contrast, removing iVWF while maintaining sVWF in the system leads to agglomeration in the flow without capture, where the agglomeration rate is similar to the control.
iVWF controls capture: We further change the surface density of the iVWF from 1% to 300% normal density to study the dependence of SIPA on iVWF. As shown in Figure 3E, changing iVWF does not affect platelet agglomeration given the presence of sVWF in the system. Furthermore, increasing iVWF to 3 times normal or reducing it to 30% does not affect the time for the capture (or the lag distance) of the platelet agglomerate much, as indicated in Figure 3F. However, reducing the iVWF to 10% and below fails to capture the preformed agglomerate resulting in an infinite lag distance. With no iVWF, the superficial velocity may increase beyond 1 as the agglomerate drifts away from the wall due to the hydrodynamic lift effect.38 Overall, our studies show that agglomeration is solely controlled by the sVWF, whereas at least 10% normal iVWF is needed for the capture of an agglomerate. Given the binary effect of iVWF for capture, the following simulations adopt a fixed iVWF density (10 ng/) without losing generality.
Elevated sVWF concentration enhances SIPA and shortens time to occlusion
To demonstrate the dependence of SIPA on sVWF concentration, we performed simulations and experiments with sVWF concentrations from 0.1 times to 18 times normal concentration. In the simulations, we selected a median VWF length of 1.6 µm.13
Figure 4A shows that increasing sVWF concentration increases the platelet agglomeration rate, as shown in Figure 4B. The agglomeration rate increases with sVWF concentration 0.1 times to 18 times. A higher concentration of VWF causes a sudden reduction of the platelet superficial velocity, as shown in Figure 4C. Likewise, the time to capture the agglomerate deceases with the increase of sVWF, as indicated in Figure 4D. Reducing the sVWF to below 40% abolished the capture of agglomerates in spite of the normal iVWF and slight agglomeration. For normal and super-normal sVWF concentrations, the capture time is consistently within 10 milliseconds, shorter than the platelet transit time through a typical atherosclerotic artery stenosis (∼50% stenosis with a ∼1 mm throat).9 Quantitatively, elevating the sVWF concentration by 6 times shortens the capture time to <3 milliseconds and by 18 times shortens the capture time about 2 milliseconds.
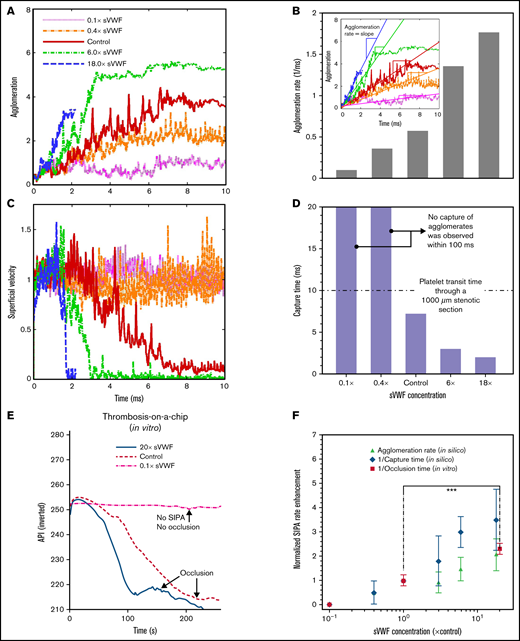
Increasing soluble VWF concentration enhances SIPA rate and shortens time to occlusion. Agglomeration (A) and superficial velocity (C) over time for VWF concentrations ranging from 0.1 times to 18 times normal. Higher VWF concentrations cause faster agglomeration and decrease the traveling velocity. The corresponding agglomeration rate (B) and capture time (D) calculated based on (A) and (C), respectively. (E) Increasing the concentration of soluble VWF by 20-fold leads to 50% reduction of the OT. The API was inverted as 400-API. (F) The predicted enhancement of SIPA rates (in terms of agglomeration rate and 1/capture time) are elevated for high sVWF concentration that leads to an enhanced rate for arterial occlusion plotted as 1/OT from experiments. (***P < .0001). For each experimental OT, data from 12 stenosis channels using a single sample of human blood were used to calculate the mean and SD.
Increasing soluble VWF concentration enhances SIPA rate and shortens time to occlusion. Agglomeration (A) and superficial velocity (C) over time for VWF concentrations ranging from 0.1 times to 18 times normal. Higher VWF concentrations cause faster agglomeration and decrease the traveling velocity. The corresponding agglomeration rate (B) and capture time (D) calculated based on (A) and (C), respectively. (E) Increasing the concentration of soluble VWF by 20-fold leads to 50% reduction of the OT. The API was inverted as 400-API. (F) The predicted enhancement of SIPA rates (in terms of agglomeration rate and 1/capture time) are elevated for high sVWF concentration that leads to an enhanced rate for arterial occlusion plotted as 1/OT from experiments. (***P < .0001). For each experimental OT, data from 12 stenosis channels using a single sample of human blood were used to calculate the mean and SD.
We further performed thrombosis microfluidic tests to study how change of sVWF concentration affects the macroscopic occlusion. We used the inverse of OT to quantify the rate of occlusion. As shown in Figure 4E (supplemental Video 1), the control cases take ∼240 s to reach full occlusion of the channel under an initial WSR of 10 000 s−1. Reducing the VWF concentration to 10% abolished SIPA with no occlusion as the API remains unchanged. Increasing the sVWF concentration to 20 times shortens the occlusion to ∼100 s, which is <50% of the normal control. In Figure 4F, we depict the normalized SIPA rates in terms of agglomeration rate, capture rate (inverse capture time), or occlusion rate (inverse OT) measured in silico or in vitro. Both in silico and in vitro results exhibit a two- to fourfold rate enhancement with ∼20 times elevated VWF concentration. Given the large spatiotemporal scale difference between microaggregate formation and occlusion in the microfluidics, the positive correlation among agglomeration rate, capture rate, and occlusion rate support the hypothesis that SIPA drives occlusive thrombosis through the 2-stage process involving agglomeration and capture.
Varying VWF length alters platelet aggregate morphology
The captured platelet aggregates that form under different VWF conditions show different shapes. In Figure 5A, we extend our previous work26 by summarizing the morphology of platelet aggregates over a wide range of VWF concentration and length in silico. Three aggregate morphological states can be classified according to the level of agglomeration upon capture (). For , the aggregates organize into a compact morphology where the platelets are densely packed into a cluster shape. This cluster state of the aggregates occurs under moderately elevated (6×) sVWF concentration with intermediate VWFs that are typically available in NP. As the decreases to below 4.5 and above 3, the aggregates show an elongated morphology with platelets assembled into a string along the streamwise direction. These elongated aggregates would occur with NP-VWF under either normal VWF concentration or severely elevated VWF concentration. For lower than 3, the aggregates exhibit a loose state, where platelets are entangled by sVWF nets without pairwise contact. These loose aggregates mainly occur with ultra-long VWF (ULVWF) or long VWF under intermediately or severely elevated VWF concentrations. For visual demonstration purposes, snapshots of aggregates for representative cases 1 to 3 are depicted in Figure 5B to illustrate the 3 morphological states.
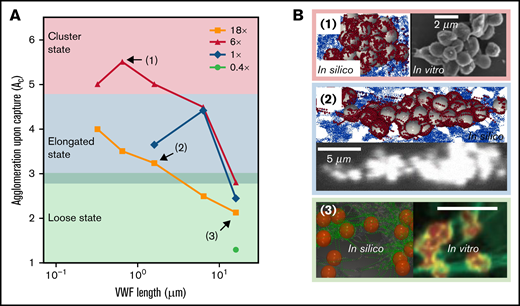
Captured agglomerates (ie, platelet aggregates) show 3 distinct morphologies primarily controlled by VWF length. (A) The platelet aggregate morphology depends on the VWF length and concentration. Three states, namely cluster state, elongated state, and loose state, are shown in the figure as a primary function of VWF length. (B) The top view of aggregate morphology observed in silico (noted in the colored boxes) for selective VWF conditions as denoted in panel A. Similar aggregate morphology observed in vitro is depicted side by side for comparison. For all 3 examples, the flow direction is from left to right. The platelet color in silico is rendered to match the in vitro counterparts. The in vitro images for panels B1 and B2 were adopted from Ruggeri et al.13 under elevated shear rates (10 000∼20 000 s−1) with human normal plasma VWF (whole blood). The in vitro counterpart of panel B3 was adopted from Chauhan et al39 with endothelial VWF (ultra-long) under venous shear rates. Both results were obtained without platelet activation.
Captured agglomerates (ie, platelet aggregates) show 3 distinct morphologies primarily controlled by VWF length. (A) The platelet aggregate morphology depends on the VWF length and concentration. Three states, namely cluster state, elongated state, and loose state, are shown in the figure as a primary function of VWF length. (B) The top view of aggregate morphology observed in silico (noted in the colored boxes) for selective VWF conditions as denoted in panel A. Similar aggregate morphology observed in vitro is depicted side by side for comparison. For all 3 examples, the flow direction is from left to right. The platelet color in silico is rendered to match the in vitro counterparts. The in vitro images for panels B1 and B2 were adopted from Ruggeri et al.13 under elevated shear rates (10 000∼20 000 s−1) with human normal plasma VWF (whole blood). The in vitro counterpart of panel B3 was adopted from Chauhan et al39 with endothelial VWF (ultra-long) under venous shear rates. Both results were obtained without platelet activation.
Similar aggregate morphologies have been reported by previous works.13,39 For example, Ruggeri et al13 performed activation-independent aggregation studies using healthy blood (normal plasma VWF) and observed clustered and elongated aggregate morphologies under elevated shear rates (10 000 ∼ 20 000 s−1), as depicted in Figure 2B (1, right) and (2, bottom). Chauhan et al39 observed platelet aggregation in vivo where the endothelium-released VWF (rich in ULVWF) was found to capture platelets and form a loose platelet-VWF net-like structure, as shown in Figure 2B (3, right). Although only venous shear rates (∼200 s−1) were imposed by Chauhan and colleagues, they confirmed the loose VWF-platelet structure was also formed independent of platelet activation and most likely driven by GPIb-A1 binding,39 similar to the current study. Taken together, the different aggregate morphologies predicted by our model and reported by separate groups show the critical role of VWF length in controlling mural aggregate morphology.
Phasic behavior of SIPA governs a variety of hemostasis and thrombosis events
SIPA can occur from VWF concentration and length intersecting in complex, dynamic ways, as illustrated in phase diagrams to show the different behaviors of agglomeration and capture. Figure 6A plots the contour of agglomeration rate as a function of VWF length and concentration. Short VWF (<0.32 µm) and ULVWF (>10 µm) show relatively lower agglomeration rates compared with NP-VWF length (0.64-6.4 µm). Diluting the VWF concentration to 10% eliminates the agglomeration. Overall, agglomeration rate is primarily dependent on VWF concentration and secondarily dependent on VWF length. Specifically, elevating the concentration of NP-VWF (0.64-6.4 µm) by 6 times increase the agglomeration rate by threefold. For intermediate VWF lengths (0.64-1.6 µm), increasing VWF concentration to 18× increases agglomeration rate by fivefold, the fastest rate in the diagram. The primacy of the agglomeration dependence on VWF concentrations stresses the importance of local high concentration of VWF for effective hemostasis. Figure 6B plots the contour of capture rate with respect to VWF length and concentration. Short VWFs with diluted concentrations tend to cause no capture of the agglomerate, termed as the no capture phase. Increasing the VWF concentration and/or with long VWFs, a transitional phase featuring marginal capture of platelet aggregates can be seen. Further increasing the VWF concentration and length, the system transitions to the firm capture phase.
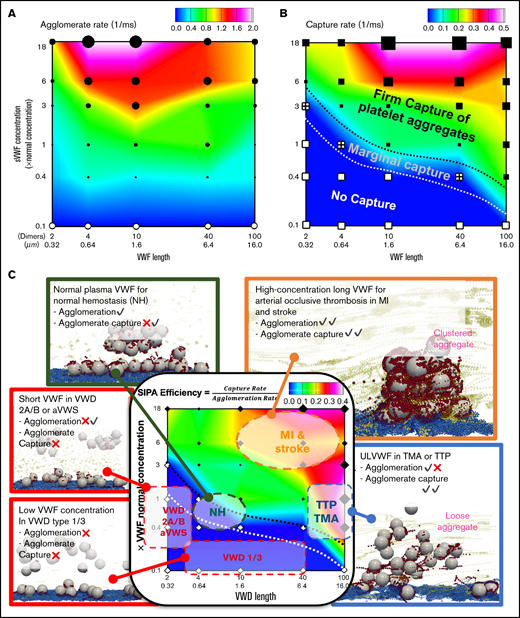
Predicted phase diagrams for SIPA correlates with a variety of hemostasis and thrombosis complications. (A) The platelet agglomeration rate as a function of VWF length and VWF concentration. The filled symbols indicate an agglomeration rate that is above 0.1 with the size of the symbol scaling as the agglomeration rate. The empty symbols correspond to an agglomeration rate below 0.1 , comparable to the level of agglomeration in the absence of sVWF. Plot is in log-log scale. (B) The agglomerate capture rate as a function of VWF length and VWF concentration. The regime with black symbols indicates the capture of an agglomerate. The cross symbols denote the regime showing marginal capture of agglomerate as a transitional SIPA behavior. The white symbols indicate the regime where agglomerates are not captured. (C) The in silico SIPA model should apply to both thrombosis and hemostasis. VWD type 1 or 3 features subnormal concentration or no presence of sVWF, which causes a severe bleeding disorder possibly due to lacking both agglomeration and capture. VWD type 2A/B and acquired VWF syndrome (aVWS), from excessively short VWF lengths, often leads to moderate bleeding possibly due to no capture of agglomerates. The model further predicts NP-VWF can lead to platelet adhesion with marginal capture of agglomerates, which may be required for normal hemostasis. Elevation in sVWF concentration and length leads to a substantial increase of the capture rate (1/capture time) and agglomeration rate, which may be relevant to arterial occlusive thrombosis leading to myocardial infarction (MI) and strokes. The excessive consumption of platelets and consequent bleeding disorders in thrombotic thrombocytopenic purpura (TTP) and thrombotic microangiopathy (TMA) induced by excessive ULVWF may form loose VWF-platelet nets to sequester platelets.
Predicted phase diagrams for SIPA correlates with a variety of hemostasis and thrombosis complications. (A) The platelet agglomeration rate as a function of VWF length and VWF concentration. The filled symbols indicate an agglomeration rate that is above 0.1 with the size of the symbol scaling as the agglomeration rate. The empty symbols correspond to an agglomeration rate below 0.1 , comparable to the level of agglomeration in the absence of sVWF. Plot is in log-log scale. (B) The agglomerate capture rate as a function of VWF length and VWF concentration. The regime with black symbols indicates the capture of an agglomerate. The cross symbols denote the regime showing marginal capture of agglomerate as a transitional SIPA behavior. The white symbols indicate the regime where agglomerates are not captured. (C) The in silico SIPA model should apply to both thrombosis and hemostasis. VWD type 1 or 3 features subnormal concentration or no presence of sVWF, which causes a severe bleeding disorder possibly due to lacking both agglomeration and capture. VWD type 2A/B and acquired VWF syndrome (aVWS), from excessively short VWF lengths, often leads to moderate bleeding possibly due to no capture of agglomerates. The model further predicts NP-VWF can lead to platelet adhesion with marginal capture of agglomerates, which may be required for normal hemostasis. Elevation in sVWF concentration and length leads to a substantial increase of the capture rate (1/capture time) and agglomeration rate, which may be relevant to arterial occlusive thrombosis leading to myocardial infarction (MI) and strokes. The excessive consumption of platelets and consequent bleeding disorders in thrombotic thrombocytopenic purpura (TTP) and thrombotic microangiopathy (TMA) induced by excessive ULVWF may form loose VWF-platelet nets to sequester platelets.
Combining results of agglomeration and capture based on a total of 30 simulations, we summarize a phase diagram of SIPA efficiency which is defined as the ratio of capture rate to agglomeration rate in Figure 6C. Conceptually, SIPA efficiency describes the agglomeration rate required to give rise to certain capture rate. Therefore, the lower agglomeration rate for a fixed capture rate (time), the looser aggregates will be produced (ie, the higher SIPA efficiency). From this diagram, we observe that the SIPA efficiency from our model is qualitatively consistent with a variety of thrombotic or hemostatic behaviors seen clinically as denoted in Figure 6C (supplemental Video 2).
The SIPA diagrams may distinguish different hemostatic and thrombotic events with mechanistic rationales in terms of agglomeration and capture. Normal hemostasis with moderate SIPA efficiency requires normal agglomeration and marginal capture rates. VWD type 1/3 with low VWF concentration reduces both agglomeration and capture, which may explain the severe bleeding prevalent in these patients.40 VWD type 2A/B and aVWS (with short VWF) maintain mild agglomeration without capture, which may explain the mild bleeding disorders in VWD type-2 patients.41 Although both MI and TTP exhibit high SIPA efficiency, the mechanistic mechanisms for both are quite different. Although MI arises primarily from the high capture rate, TTP comes from the lower agglomeration rate. Such difference is noticeable as rapid platelet accumulation in occlusive arterial thrombosis could capture billions of platelets in minutes,9 whereas TTP with ULVWF often leads to loose VWF platelet traps with excessive platelet sequestration.39
Discussion
Our multiscale in silico model describes the dynamics of shear-elongated VWF strands in flow that agglomerate nonactivated platelets through GPIb-A1 bond kinetics and that are subsequently captured. The model, based on the first principles of physics, explains how rapid platelet accumulation can occur within milliseconds in stenotic arteries. Only a small range of kinetic rate constants can create this process without fine tuning of many parameters to create a best fit. Elevated shear rates stretch sVWF into long strands due to the elongational effect of shear (Figure 7A). Elongated sVWF then entangles multiple platelets into agglomerates in the flow facilitated by the rotational effect of shear (Figure 7B). The iVWF at the wall then rapidly captures the agglomerates as platelet aggregates after a lag distance of >100 m (Figure 7C). The entire SIPA process takes only milliseconds thanks to both the ultra-fast intrinsic (2-dimensional) on rate of GPIb-A1 bond26,19 and the high-shear flow transport. Such rapid capture of agglomerates excludes the chance of platelet activation. In Figure 7D, we summarize the main procedures and features of SIPA described in our study.
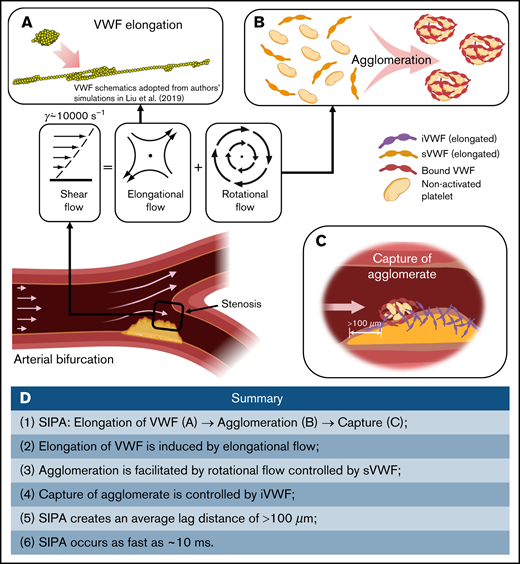
Schematics of the millisecond-scale SIPA process driving the arterial thrombus growth under pathologically high shear rates. (A) Under pathological high shear (∼10 000 s−1), VWF elongates under high shear due to the elongational effect of shear flow. (B) Elongated soluble VWFs entangle many nonactivated platelets and form agglomerates in the flow, facilitated by the rotational flow. (C) The immobilized VWF at the wall captures agglomerates in milliseconds after an agglomerate traveling lag distance of >100 m. (D) Summary of the steps and features of SIPA described in current study.
Schematics of the millisecond-scale SIPA process driving the arterial thrombus growth under pathologically high shear rates. (A) Under pathological high shear (∼10 000 s−1), VWF elongates under high shear due to the elongational effect of shear flow. (B) Elongated soluble VWFs entangle many nonactivated platelets and form agglomerates in the flow, facilitated by the rotational flow. (C) The immobilized VWF at the wall captures agglomerates in milliseconds after an agglomerate traveling lag distance of >100 m. (D) Summary of the steps and features of SIPA described in current study.
Note that the outcome of SIPA from agglomeration and capture could be quite different from the random deposition/adhesion of individual platelets, which should create uniform layers like tree rings.2,42 In contrast, during SIPA, VWF act as “tentacles” to extend and capture platelets, which may lead to fractal-like growth as agglomerates attach on top of aggregates, forming microstructures.34 Our in silico model further predicts that SIPA would create a lag distance that is longer than 100 m at high shear rates, where few platelet agglomerates would be captured at the wall, as seen in our experiments. This lag distance may be longer than a short stenosis throat section (10-100 µm)2 to yield insignificant thrombus growth, as has been observed by Nesbitt et al.2 Atherosclerotic stenoses typically have streamwise dimensions greater than 1 mm,10,43,44 so occlusive thrombosis would be expected to accumulate within the throat. Aortic valves that are stenotic but not thickened (<100 µm) may not have much thrombosis, whereas thickened leaflets (>100 µm) may capture platelet aggregates.45,46
There are several important limitations to our in silico model. Although it is possible to include VWF with broad length distribution, in these simulations only a single length of VWF is considered in the simulations as reasonable reductionist approach. A physiologic distribution of VWF length47 may provide more insight into VWD/aVWS. The current work does not consider VWF self-association,48 which may underpredict the rate of SIPA. Further, this in silico model did not include the effects of fibrin, , and other factors released during platelet activation that are expected to take place beyond the initial 10 milliseconds.49
Nonetheless, the biophysical model described here captures the early biophysics of SIPA under pathologically high shear rates (∼10 000 s−1) to provide a mechanistic explanation for rapid platelet accumulation9 and certain VWF-related thrombotic pathologies.39-41 In conclusion, sVWF tentacles reach out to collect platelets in the flow while iVWF tentacles capture the agglomerates.
Authorship
Contribution: Z.L.L. designed research, performed research, analyzed the data, and wrote the paper; C.B. performed research, analyzed the data, and wrote the paper; C.K.A. analyzed the data and wrote the paper; and D.N.K. designed research, analyzed the data, and wrote the paper.
Conflict-of-interest disclosure: The authors declare no competing financial interests.
Correspondence: David N. Ku, GWW School of Mechanical Engineering, Georgia Institute of Technology, 315 Ferst Drive IBB 2307, Atlanta, GA 30332; e-mail: david.ku@me.gatech.edu.

