

Key Points
The ELN 2017 classification has been validated in a risk-adapted intensive protocol, supporting its utility to predict outcome.
Within the ELN 2017 adverse group, there is a subset of patients (inv(3) and TP53 abnormalities) with a particularly poor prognosis.

Abstract
The 2017 European LeukemiaNet (ELN 2017) guidelines for the diagnosis and management of acute myeloid leukemia (AML) have become fundamental guidelines to assess the prognosis and postremission therapy of patients. However, they have been retrospectively validated in few studies with patients included in different treatment protocols. We analyzed 861 patients included in the Cooperativo Para el Estudio y Tratamiento de las Leucemias Agudas y Mielodisplasias-12 risk-adapted protocol, which indicates cytarabine-based consolidation for patients allocated to the ELN 2017 favorable-risk group, whereas it recommends allogeneic stem cell transplantation (alloSCT) as a postremission strategy for the ELN 2017 intermediate- and adverse-risk groups. We retrospectively classified patients according to the ELN 2017, with 327 (48%), 109 (16%), and 245 (36%) patients allocated to the favorable-, intermediate-, and adverse-risk group, respectively. The 2- and 5-year overall survival (OS) rates were 77% and 70% for favorable-risk patients, 52% and 46% for intermediate-risk patients, and 33% and 23% for adverse-risk patients, respectively. Furthermore, we identified a subgroup of patients within the adverse group (inv(3)/t(3;3), complex karyotype, and/or TP53 mutation/17p abnormality) with a particularly poor outcome, with a 2-year OS of 15%. Our study validates the ELN 2017 risk stratification in a large cohort of patients treated with an ELN-2017 risk-adapted protocol based on alloSCT after remission for nonfavorable ELN subgroups and identifies a genetic subset with a very poor outcome that warrants investigation of novel strategies.
Introduction
Acute myeloid leukemia (AML) is a heterogeneous clonal disease of transformed hematopoietic precursors presenting with recurrent genetic abnormalities. In recent years, the unraveling of the AML genetic landscape has allowed a better correlation of the biological features of the disease with the prediction of response to treatment and clinical outcome.1 Based on that, expert working groups have published recommendations for the diagnosis, response criteria, and prognostic stratification of AML.2-4 In 2010, a panel of experts proposed the first European LeukemiaNet (ELN) recommendations for the diagnosis and management of AML. The ELN 2010 risk classification stratified patients into 4 risk categories (favorable, intermediate I, intermediate II, and adverse) according to cytogenetics and NPM1, FLT3, and CEBPA mutational status. Several groups have undertaken the effort to validate the prognostic impact of this classification, although differential prognosis of intermediate I and intermediate II categories could not be confirmed.5,6
In 2017, a revised version of the ELN classification was published (ELN 2017).4 This updated risk stratification grouped patients into 3 risk categories (favorable, intermediate, and adverse risk) and refined the prognostic value of specific genetic mutations. Thus, CEBPA mutation defined a favorable AML subset only in a biallelic status, the presence of RUNX1, ASXL1, and TP53 mutations conferred an adverse risk, and risk of FLT3 internal tandem duplication (FLT3-ITD) was further modulated by its allelic ratio and the interaction with NPM1 mutation.
Although the ELN 2017 risk classification was mainly designed using data from the published evidence of individual genetic entities contained in the classification, to date, few studies have validated its whole prognostic value in a large series of patients. A recent publication by Herold et al7 validated the ELN 2017 among 771 available patients from 2 treatment protocols, with a broad age range, comparing the prognostic impact according to the both ELN classifications. This work highlighted the predictive prognostic potential of this latest classification, although it proposed a refined ELN 2017 stratification with 2 additional groups (namely, very favorable and very adverse subgroups). Of note, allogeneic hematopoietic stem cell transplantation (alloSCT) in first complete remission (CR1) had only been performed in a minority of patients (16% of patients achieving CR). Other studies have also validated the prognostic impact of the ELN 2017 classification, although with a smaller number of patients of younger age.8,9
The Spanish AML cooperative group Cooperativo Para el Estudio y Tratamiento de las Leucemias Agudas y Mielodisplasias (CETLAM) proposed an AML risk-adapted treatment protocol (CETLAM-12), defining risk categories that virtually overlapped with the ELN 2017 classification, and recommending alloSCT in CR1 for intermediate- and high-risk patients. Herein we present the validation of the ELN 2017 risk stratification in patients with AML included in the CETLAM-12, with a genetic risk-based preestablished transplant policy, unraveling a genetically defined very-high-risk subset within the adverse risk ELN 2017 category.
Patients and methods
Patients and treatment
Newly diagnosed patients with de novo AML eligible for intensive chemotherapy and treated according to the CETLAM-12 protocol from January 2012 to December 2019 were included in the study (n = 861). The CETLAM-12 protocol is detailed in the supplemental Materials. Essentially, all patients received a common induction regimen based on a 3 + 7 scheme with idarubicin and cytarabine. Afterward, patients received a risk-based postremission therapy according to 3 categories based on initial genetics (including cytogenetics, NPM1, FLT3-ITD, and CEBPA mutational status), and postconsolidation minimal/measurable residual disease (MRD). The favorable group was defined as in the ELN 2017 classification, including the subset of patients with NPM1-mutated and wild-type or low-ratio FLT3-ITD, given the favorable outcome observed in our previous protocol.10 In these patients, consolidation therapy consisted of 3 courses of high-dose cytarabine (HDAC). In these patients, bone marrow MRD assessment with quantitative reverse transcriptase-polymerase chain reaction (qRT-PCR) was performed after each chemotherapy course and thereafter at 3-month intervals for at least 3 years after CR. If a confirmed molecular failure was evidenced (ie, persistence or MRD reappearance after consolidation), alloSCT was the recommended strategy without a predefined guideline for specific pretransplant salvage chemotherapy. For patients allocated to the intermediate- and high-risk categories, alloSCT was the recommended strategy after at least 1 HDAC course. In addition, all patients with persistent MRD after consolidation therapy were allocated to the high-risk category, and alloSCT was also recommended. Since 2017, patients with FLT3 mutations (either ITD or FLT3-tyrosine kinase domain,TKD) could receive midostaurin through an early access program.
The CETLAM-12 protocol was approved by the Spanish Medicines Agency as a postapproval study (EPA-OD, JSG-SMD-2014-01). Patients provided their written informed consent in accordance with the Declaration of Helsinki, and all procedures were approved by the ethics committee.
Cytogenetic and mutational analysis
Cytogenetic analysis including fluorescence in situ hybridization was performed in the laboratory of each treating center. Mutational analysis of NPM1 and FLT3 (ITD and TKD) was performed on DNA, using PCR-based methods.10-12 Testing for recurrent AML mutations, including RUNX1, ASXL1, CEBPA, NPM1, FLT3, and TP53, was done with next-generation sequencing (NGS) techniques, with a limit of detection of 5% variant allele frequency. Recurrent gene rearrangements, including RUNX1-RUNXT1 and CBFb-MYH11, were analyzed by qRT-PCR, fluorescence in situ hybridization, or NGS. Participating centers and NGS panels used are detailed in the supplemental Material.
Risk group and ELN category allocation
According to cytogenetic and mutational findings, each patient with available data were retrospectively allocated to the corresponding ELN 2017 risk category (favorable, intermediate, and adverse) to analyze the outcome according to this classification. Of note, patients with wild-type NPM1 and FLT3-ITD ≥ 0.5 lacking NGS testing were assigned to the adverse-risk category, irrespective of the presence or absence of adverse risk-defining gene mutations such as RUNX1, ASXL1, or TP53. Ambiguous cases and the detailed risk allocation procedure are detailed in the supplemental Material.
Statistical methods
Characteristics among ELN 2017 groups were compared using the χ2 test and Fisher's exact test for categorical variables and using the Student t test and Mann-Whitney U test for continuous variables with normal and non-normal distribution, respectively. Median follow-up time was calculated with the Kaplan-Meier estimate of potential follow-up.13 Overall survival (OS) was calculated from diagnosis to death. Event-free survival (EFS) was calculated from diagnosis to treatment failure (not achieving complete remission/partial remission after induction), relapse, or death. OS and EFS were estimated with the Kaplan-Meier method, and groups were compared with the log-rank test.14,15 For outcomes where a possible competing event exists, cumulative incidence was calculated using relapse as the primary event and death without relapse as a competing event. Cumulative incidence function comparison was performed using Gray's test. In the univariate and multivariate analyses, logistic regression was used to estimate odds ratio, whereas Cox proportional hazards regression was used to estimate hazard ratios. Post hoc P value analyses were adjusted with the Bonferroni method. All statistical analyses were performed with R statistics version 4.0.2 (R core Team, R Foundation for Statistical Computing, Vienna, Austria).
Results
Patient characteristics
This study included a total of 861 patients enrolled in the multicentric CETLAM-12 treatment protocol, classified according to the ELN 2017 classification as favorable (n = 327), intermediate (n = 109) and adverse risk (n = 245), corresponding to 48%, 16%, and 36% of classifiable patients, respectively. One hundred eighty additional patients (20.9% of all patients) could not be classified according to the ELN 2017 because of the lack of risk-defining cytogenetic abnormalities and unavailable NGS testing. This nonclassifiable group is mostly composed by ELN 2017 intermediate- and adverse-risk patients with AML, without either favorable-risk mutations or ELN group-defining cytogenetic findings, in whom NGS testing was not performed and RUNX1, ASXL1, and TP53 mutational status could not be assessed. As a consequence, these patients could not be properly allocated into either the ELN 2017 intermediate- or adverse-risk group. The main characteristics of each group and the whole cohort are summarized in Table 1, including the comparison with the Medical Research Council (MRC) and ELN 2010 risk classifications.3,16 Furthermore, the distribution of the genetic groups within the ELN 2017 risk classification is detailed in Figure 1.
Patient characteristics of the entire cohort and according to the ELN 2017 risk stratification
| All patients (861) | ELN 2017 favorable (327) | ELN 2017 intermediate (109) | ELN 2017 adverse (245) | ELN 2017 not classifiable (180) | P* | |
|---|---|---|---|---|---|---|
| Age, years median (range) | 56 (17-76) | 54 (17-76) | 53 (20-75) | 58 (18-71) | 59 (17-71) | .33 |
| Sex, male n (%) | 449 (51) | 164 (50) | 48 (44) | 123 (50) | 107 (59) | .43 |
| WBC, median (range) (/109/L) | 9.88 (0.1-530) | 17.9 (0.6-361) | 45.6 (0.8-384.2) | 5.2 (0.4-313.6) | 3.4 (0.1-530) | <.001 |
| Hemoglobin, median (range) (g/L) | 89 (26-159) | 92 (34-150) | 91 (40-153) | 87 (38-159) | 87 (26-147) | .08 |
| Platelet count, median (range) (/109/L) | 62 (2-742) | 60 (5-453) | 62 (10-488) | 62 (6-465) | 74 (2-742) | .96 |
| PB blasts, median (range) (%) | 30 (0-100) | 37 (0-100) | 61 (0-100) | 20 (0-99) | 11 (0-98) | <.001 |
| BM blasts, median (range) (%) | 62 (1-100) | 66 (2-100) | 79 (17-100) | 57 (7-99) | 50 (9-99) | <.001 |
| NPM1 status | ||||||
| NPM1 mutated | 295 (34.3) | 217 (66.4) | 72 (66.1) | 6 | 0 | — |
| NPM1 unknown | 27 (3) | 5 (1.6) | 0 | 10 (9.2) | 12 (6.7) | — |
| FLT3-ITD status | ||||||
| FLT3-ITDlow | 60 (7.3) | 45 (13.8) | 2 (1.8) | 7 (2.9) | 6 (3.3) | — |
| FLT3-ITDhigh | 115 (13.4) | 6 (1.8) | 71 (65.1) | 38 (15.5) | 0 | — |
| FLT3-ITD unknown | 22 (2.6) | 3 (1) | 0 | 8 (3.7) | 11 (6.1) | — |
| MRC cytogenetic risk category16 | ||||||
| MRC favorable | 93 (10.8) | 93 (28.4) | 0 | 0 | 0 | — |
| MRC intermediate | 551 (64) | 215 (65.7) | 98 (91) | 80 (32.5) | 158 (87.8) | — |
| MRC adverse | 174 (20.2) | 2 (0.6) | 1 (1) | 161 (65.4) | 10 (5.5) | — |
| MRC not classifiable | 43 (5) | 17 (5.2) | 9 (8) | 5 (2.1) | 12 (6.7) | — |
| ELN-2010 risk stratification3 | ||||||
| Favorable | 255 (29.6) | 251 (76.8) | 1 (1) | 0 | 3 (1.7) | — |
| Intermediate I | 260 (30.2) | 38 (11.6) | 78 (71.5) | 44 (18) | 100 (55.5) | — |
| Intermediate II | 132 (15.3) | 28 (8.6) | 26 (23.8) | 19 (7.8) | 59 (32.8) | — |
| Adverse | 178 (20.7) | 1 (0.3) | 0 | 177 (72.2) | 0 | — |
| Not classifiable | 36 (4.21) | 9 (2.7) | 4 (3.7) | 5 (2) | 18 (10) | — |
BM, bone marrow; PB, peripheral blood.
P value of the comparison among ELN 2017 classifiable patients.
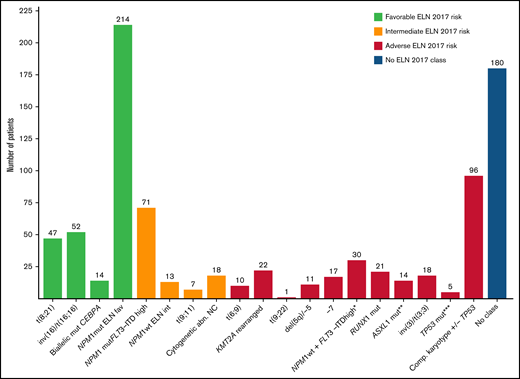
Distribution of patients with AML included in the study within the ELN 2017 risk categories. *Patients allocated to this category have been identified by NPM1 and FLT3-ITD mutational status. **Patients with ASXL1 mutation without RUNX1 mutation. ***Patients with TP53 mutation or abn(17p) without complex karyotype.
Distribution of patients with AML included in the study within the ELN 2017 risk categories. *Patients allocated to this category have been identified by NPM1 and FLT3-ITD mutational status. **Patients with ASXL1 mutation without RUNX1 mutation. ***Patients with TP53 mutation or abn(17p) without complex karyotype.
The median age of patients in the ELN 2017 adverse risk category was higher than that of patients from the remaining risk groups, without achieving statistical significance. These patients also had a lower white blood cell count (WBC), as well as lower peripheral blood and bone marrow blast count, compared with the other risk categories (P < .01), and a trend to a lower hemoglobin level. Intermediate-risk patients presented with a higher WBC and blast count than the other risk categories (P < .01), largely attributable to the higher prevalence of FLT3-ITD in this cohort (66.9% in the intermediate-risk group vs 15.6% and 18% among favorable- and adverse- risk patients, respectively). Of note, 46 patients received frontline midostaurin during chemotherapy because of the presence of a FLT3 mutation.
Treatment outcome according to ELN 2017 category
All patient included in this study received at least induction therapy according to the CETLAM-12 protocol. A detailed flowchart with patient disposition following induction and postremission therapy is shown in Figure 2.

Treatment disposition of patients according to responses and outcomes of patients of each ELN 2017 risk category.
Treatment disposition of patients according to responses and outcomes of patients of each ELN 2017 risk category.
Among patients allocated to the ELN 2017 favorable risk group (n = 327), 295 achieved CR1 (90%) after 1 (n = 277) or 2 (n = 18) induction courses. Although not intended in CR1, 82 patients (25%) received an alloSCT: after experiencing an overt hematologic relapse in 29 patients (second complete response [CR2] n = 25; partial response/refractory disease, n = 4), after presenting molecular relapse (n = 40; 33 patients with NPM1 mutation), and because of a protocol deviation (n = 13). Overt hematologic relapses were mostly detected after completion of HDAC consolidation courses (44; 70% of all relapses). After alloSCT, 13 patients relapsed, and 14 additional patients died because of a non–relapse-related cause (NRM). The median follow-up time of the ELN 2017 favorable group was 38 months, with 234 patients in a CR status (72% of all ELN 2017 favorable patients) at the cutoff time and 57 of them after an alloSCT (24% of all patients with CR). Among patients who did not receive an alloSCT, 10 patients died because of treatment complications. Overall, 170 patients remained in sustained CR after HDAC-based consolidation chemotherapy (Figure 2).
Regarding patients allocated to the ELN 2017 intermediate-risk group (n = 109), 87 achieved CR1 (80%), 18 of them requiring more than 1 chemotherapy course. Thirteen early relapses before alloSCT were observed, with 7 patients achieving CR2 after salvage therapy and therefore proceeding to alloSCT. Overall, 80 patients (73.4%) received an alloSCT (CR1, n = 69, 63%; CR2, n = 7; refractory disease, n = 4), and 3 patients received an autologous stem cell transplant. After alloSCT, 19 patients relapsed, and 10 patients died because of NRM. The median follow-up time of the ELN 2017 intermediate group was 24 months, with 57 patients in a CR status (52% of all ELN intermediate-risk patients) at the cutoff time and 53 after an alloSCT (93% of all patients with CR).
Concerning patients of the ELN 2017 adverse-risk group (n = 245), 173 achieved CR1 (71%), 38 requiring more than 1 chemotherapy course. After achieving CR1, 41 patients relapsed, and only 5 of them achieved CR2 after salvage therapy (12%). Altogether, 150 (61.6%) proceeded to alloSCT (CR1, n = 125, 51%; CR2, n = 3; refractory disease, n = 22), and 2 patients received an autologous stem cell transplant. After alloSCT, 53 patients relapsed and 34 died because of NRM. The median follow-up time of the ELN 2017 adverse group was 38 months, with 68 patients in a CR status (28% of all ELN adverse-risk patients) at the cutoff time and 66 after an alloSCT (97% of all patients with CR).
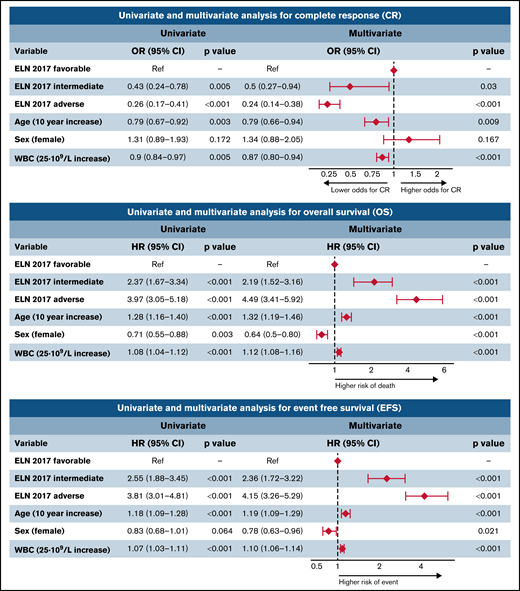
Patients of the ELN 2017 favorable-risk group exhibited a higher CR rate (90%) compared with the intermediate and adverse groups (80% and 71%, respectively; P < .05). Furthermore, the ELN 2017 adverse group showed a higher proportion of induction refractoriness than the other groups (19% in the adverse group vs 1% and 8% in the favorable and intermediate groups, respectively; P < .001). The multivariate analysis confirmed the independent prognostic value of this classification for the achievement of CR after induction chemotherapy (Figure 3), together with age and leukocyte count at diagnosis. There was no significant difference in terms of induction mortality among the 3 groups.
Univariate and multivariate analysis for CR, OS, and EFS. OR, odds ratio; HR, hazard ratio; CI, confidence interval.
Univariate and multivariate analysis for CR, OS, and EFS. OR, odds ratio; HR, hazard ratio; CI, confidence interval.
Relapse risk, NRM, EFS, and OS according to ELN 2017 risk classification
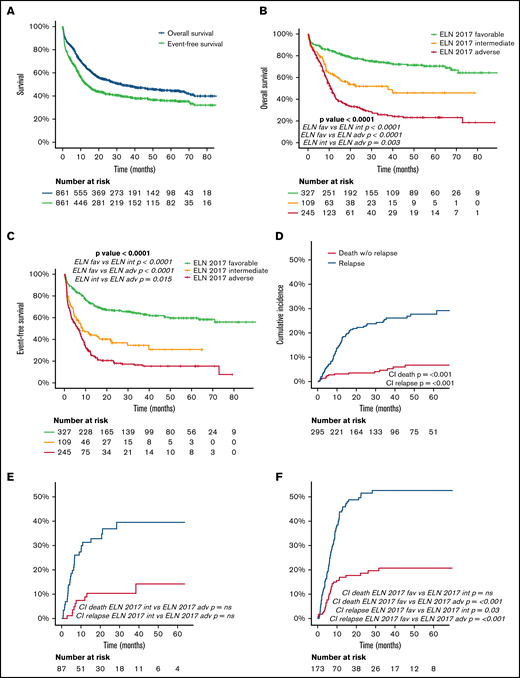
The median follow-up of the entire cohort (N = 861) was 38 months. Detailed information regarding OS, EFS, and cumulative incidence of relapse (CIR) and NRM is summarized in Table 2 and Figure 4. CIR and NRM at 5 years increased from 28% and 7% to 40% and 14% and to 53% and 21% in favorable, intermediate, and adverse ELN categories, respectively (P < .001). This marked prognostic impact of the ELN 2017 category is translated into OS and EFS, with a gradual decline at 5 years from 70% and 60% to 46% and 31% and to 23% and 15%, for favorable-, intermediate-, and adverse-risk patients, respectively (P < .001). The prognostic impact of ELN 2017 stratification was maintained in patients above and below 60 years (supplemental Material).
Outcomes at 2 and 5 years of the overall study population, and detailed for each ELN 2017 risk category
| Overall survival % (SE) | Event-free survival % (SE) | Cumulative incidence of relapse % (SE) | Cumulative incidence of non-relapse mortality % (SE) | |||||
|---|---|---|---|---|---|---|---|---|
| All patients | 2y 54.2 (1.8) | 2y 41.7 (1.8) | 2y 35.1 (1.9) | 2y 10.8 (1.2) | ||||
| 5y 44.4 (2) | 5y 35.9 (1.9) | 5y 39.1 (2.1) | 5y 13.6 (1.5) | |||||
| ELN 2017 favorable | 2y 77.3 (2.4) | 2y 66.5 (2.7) | 2y 22.7 (2.6) | 2y 3.5 (1.1) | ||||
| 5y 70.3 (3) | 5y 59.6 (3.1) | 5y 27.7 (3) | 5y 6.8 (1.8) | |||||
| ELN 2017 intermediate | 2y 51.8 (5.2) | *** | 2y 36.7 (5) | *** | 2y 36.9 (5.7) | *** | 2y 10.4 (3.5) | *** |
| 5y 45.7 (6.1) | 5y 30.6 (5.9) | 5y 39.5 (6.1) | 5y 14.2 (5.1) | |||||
| ELN 2017 adverse | 2y 32.5 (3.2) | 2y 18 (2.7) | 2y 51.5 (4.1) | 2y 18.5 (3.1) | ||||
| 5y 23.1 (3.2) | 5y 15.4 (2.7) | 5y 52.6 (4.1) | 5y 20.7 (3.4) | |||||
P-value < .001; SE, Standard error.
Outcome (OS, EFS, CIR) of the entire cohort and in each ELN risk category: (A) OS and EFS of the entire cohort. (B) OS according to ELN 2017 risk category. (C) EFS according to ELN 2017 risk category. (D-F) CIR and death without relapse of patients allocated in the ELN 2017 favorable (D), intermediate (E), and adverse (F) risk category. Pairwise comparison of OS, EFS, and CI has been adjusted with the Bonferroni method.
Outcome (OS, EFS, CIR) of the entire cohort and in each ELN risk category: (A) OS and EFS of the entire cohort. (B) OS according to ELN 2017 risk category. (C) EFS according to ELN 2017 risk category. (D-F) CIR and death without relapse of patients allocated in the ELN 2017 favorable (D), intermediate (E), and adverse (F) risk category. Pairwise comparison of OS, EFS, and CI has been adjusted with the Bonferroni method.
The multivariate analysis confirmed the independent prognostic value of the ELN risk classification (Figure 3). Thus, the hazard ratio for death and event defined by EFS increased by ELN risk category, being 2.2- and 2.4-fold in intermediate-risk patients and 4.5- and 4.2-fold in adverse-risk patients. Interestingly, age, sex, and WBC at diagnosis also showed an independent prognostic impact on OS and EFS, with a protective effect of female sex.
Outcome after alloSCT according to ELN 2017 category
In the CETLAM-12 protocol, alloSCT policy varied according to the genetic risk category. AlloSCT was recommended in CR1 for all eligible nonfavorable risk patients, after receiving at least 1 consolidation course. In contrast, alloSCT was deferred in favorable-risk patients after frontline treatment failure, either molecular or morphologic. Main characteristics of alloSCT are summarized in the supplemental Material. Of note, transplant characteristics were similar among the different ELN 2017 groups, with the exception of disease status at the time of alloSCT. A higher proportion of patients from the adverse-risk category received alloSCT without being in CR at the time of transplant (14% vs 6%; P = .04). Concerning conditioning intensity and donor type, 48% of patients received a myeloablative regimen, and an unrelated donor was used in 45% of transplant procedures. As a consequence of this risk-adapted transplant policy, median time from CR to alloSCT was similar for intermediate- and high-risk categories (2.9 and 3.1 months, respectively), and longer for favorable-risk patients (11.7 months).
OS after alloSCT was similar in favorable- and intermediate-risk patients and worse in adverse-risk patients (OS at 2 years of 71% and 67% in favorable- and intermediate-risk vs 47% in adverse-risk patients; P < .001). Relapse risk increased with ELN 2017 risk category, whereas NRM after transplant was comparable among groups (Figure 5; Table 3).
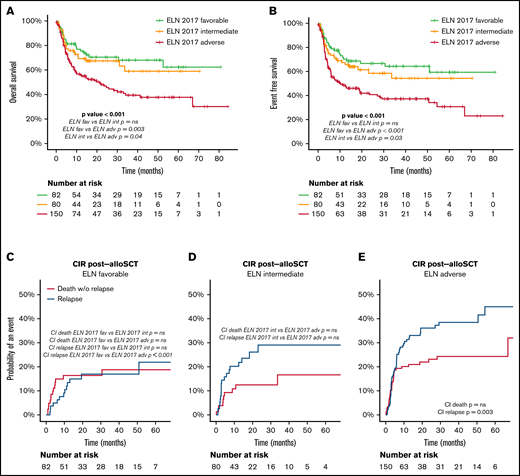
Outcome after alloSCT according to ELN 2017 risk category. (A) OS after alloSCT according to the ELN 2017 risk categories. (B) EFS after alloSCT according to the ELN 2017 risk categories. (C-E) CI of relapse and death without relapse of patients allocated in the ELN 2017 favorable (C), intermediate (D), and adverse (E) risk category. Pairwise comparison of OS, EFS, and CIR has been adjusted with the Bonferroni method. Starting time for the analysis is the date of alloSCT.
Outcome after alloSCT according to ELN 2017 risk category. (A) OS after alloSCT according to the ELN 2017 risk categories. (B) EFS after alloSCT according to the ELN 2017 risk categories. (C-E) CI of relapse and death without relapse of patients allocated in the ELN 2017 favorable (C), intermediate (D), and adverse (E) risk category. Pairwise comparison of OS, EFS, and CIR has been adjusted with the Bonferroni method. Starting time for the analysis is the date of alloSCT.
Outcomes after alloSCT according to the ELN 2017 risk stratification
| OS after alloSCT, % (SE) | EFS after alloSCT, % (SE) | CIR after alloSCT, % (SE) | Cumulative incidence of death without relapse after alloSCT, % (SE) | |
|---|---|---|---|---|
| All patients | 2 y, 58.2 (2.6) | 2y, 52.5 (2.7) | 2y, 26.7 (2.3) | 2y, 20.8 (2.1) |
| ELN 2017 favorable | 2 y, 70.5 (5.4)* | 2 y, 66.6 (5.6)* | 2 y, 17 (4.6)† | 2 y, 16.4 (4.2)NS |
| ELN 2017 intermediate | 2 y, 67.4 (5.7) | 2 y, 58.5 (6.4) | 2 y, 29 (6.1) | 2 y, 12.5 (4) |
| ELN 2017 adverse | 2 y, 46.9 (4.5) | 2 y, 40.8 (4.4) | 2 y, 36.1 (4.2) | 2 y, 23.1 (3.6) |
NS, not significant; SE, standard error.
P < .001.
P < .01.
Identification of a very-adverse-risk subgroup within the adverse ELN 2017 category
Considering the wide biological heterogeneity within the ELN 2017 adverse-risk category, we analyzed the outcome of the genetic entities included (supplemental Material). Indeed, some AML subtypes of the ELN 2017 adverse-risk category showed an exceptionally poor prognosis (very adverse risk, ELN Adv+), differentially worse than that of the remaining patients of the adverse-risk category (ELN Adv−). These very-adverse-risk subtypes were as follows: AML with inv(3)(q21.3q26.2) or t(3;3)(q21.3q26.2), leading to deregulation of GATA2 and MECOM (EVI1) genes (n = 18), and AML with mutated TP53 and/or 17p abnormalities and AML with complex karyotype (n = 119, 49%; supplemental Figure 9.1). The complex karyotype subgroup included a high number of patients with del(17p)/−17, del(5q)/−5, and/or monosomal cytogenetic abnormalities (supplemental Table 8; supplemental Figure 8.1). ELN Adv+ patients had a higher proportion of male patients and presented with a lower leukocyte count and bone marrow blast infiltration at diagnosis.
Patients included in the ELN Adv+ subgroup showed a lower proportion of responders to frontline therapy (60% vs 81% for ELN Adv+ and ELN Adv−, respectively; P < .001), a lower proportion of patients amenable to alloSCT in CR1 (46% vs 75% for ELN Adv+ and ELN Adv−, respectively; P < .001), and a higher CIR (75% vs 35% at 2 years for ELN Adv+ and ELN Adv−, respectively; P < .001). As a consequence, OS and EFS were significantly worse in the ELN Adv+ group, compared with Adv−, with 2- and 5-year estimates of 15% and 10% vs 49% and 36% for OS (P < .001) and 3% (2- and 5-year) vs 33% and 28% for EFS (P < .001), respectively. This different outcome between subgroups was confirmed regardless of the age range analyzed (<60 vs ≥60 years) and was more evident in the younger patient population (2- and 5-year OS: 61% and 50% vs 24% and 15% in ELN Adv− vs ELN Adv+, respectively; P < .0001; supplemental Figure 9.5).
Moreover, this different outcome was maintained in patients who could receive an alloSCT in CR1, with a 2-year OS after alloSCT of 28% vs 58% and CIR at 2 years of 61% vs 21% for patients of the ELN Adv+ and ELN Adv−, respectively, without significant difference in terms of NRM (Figure 6C-D). Additional comprehensive information comparing ELN Adv+ and ELN Adv− is provided in the supplemental Material. Interestingly, when ELN Adv− and ELN Adv+ categories were analyzed together with the remaining ELN 2017 risk groups, the outcome of the ELN Adv− group overlapped with that of ELN 2017 intermediate-risk group, whereas the outcome of ELN Adv+ was markedly poorer than the remaining category. Thus, 4 prognostic groups could be clearly distinguished, although the ELN 2017 intermediate-risk group and the ELN Adv− group did not show statistically significant differences regarding OS or EFS (Figure 6).
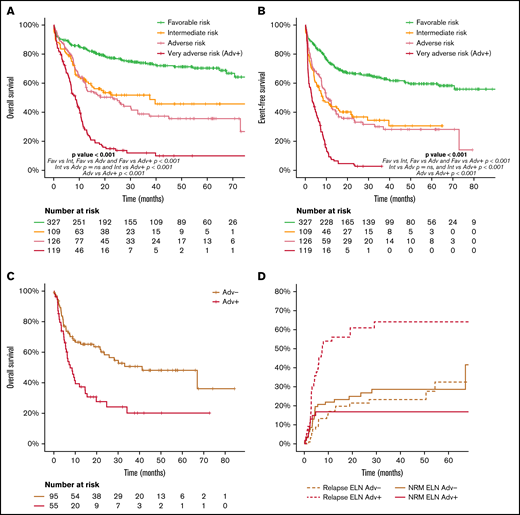
Outcome according to ELN risk category dividing the adverse risk category in two different subgroups, ELN Adv− and the very adverse risk/ELN Adv+. (A) OS and (B) EFS of the ELN 2017 risk groups stratifying the ELN 2017 adverse risk patients in the 2 proposed groups (ELN Adv− and very adverse risk/ELN Adv+). Pairwise comparison of OS and EFS has been adjusted with the Bonferroni method. Outcome after alloSCT in both ELN Adv subgroups in terms of OS (C) and CIR and NRM (D).
Outcome according to ELN risk category dividing the adverse risk category in two different subgroups, ELN Adv− and the very adverse risk/ELN Adv+. (A) OS and (B) EFS of the ELN 2017 risk groups stratifying the ELN 2017 adverse risk patients in the 2 proposed groups (ELN Adv− and very adverse risk/ELN Adv+). Pairwise comparison of OS and EFS has been adjusted with the Bonferroni method. Outcome after alloSCT in both ELN Adv subgroups in terms of OS (C) and CIR and NRM (D).
Discussion
In this study, we validated the prognostic ability of the current AML ELN risk classification in a cohort of patients treated under the same risk-adapted protocol (CETLAM-12). This protocol prospectively assigned a postremission strategy based on the genetic risk evaluation at diagnosis, largely resembling that proposed by ELN 2017. Despite this risk-adapted post-CR strategy, ELN categories segregated groups of patients with a markedly diverse outcome, with a 5-year OS of 70%, 46%, and 23% in favorable, intermediate and high-risk patients, respectively, mainly as a result of the different initial response rate and relapse risk. Remarkably, we were able to identify a high-risk subset within ELN adverse category, the ELN very adverse risk (ELN Adv+), with a significantly poorer outcome, with a 5-year OS of less than 10%. On the contrary, the outcome of the remaining ELN unfavorable patients not included in this very-high-risk subset showed a comparable outcome to that of ELN intermediate-risk patients. These results support a refinement of the ELN classification with the recognition of this very-poor-risk subset and warrant the design of specific novel therapeutic approaches aimed to improve the outcome of these patients.
Patients allocated to the ELN 2017 favorable category were confirmed to have a relatively good outcome, with a 5-year OS and CIR of 71% and 28%, respectively. Although alloSCT was not preplanned in this subgroup, following previous recommendations,17,18 approximately one quarter of patients received an alloSCT, mostly because of molecular failure. This preemptive intervention based on MRD kinetics, might result in an overall clinical benefit. This had been suggested by a previous study performed by our group in ELN-favorable patients with an NPM1 mutation, showing an improved outcome for patients treated at the time of molecular failure status compared with hematologic relapse.17 A similar observation has been described in patients with core-binding factor–rearranged AML, in whom a preemptive intervention could lead to a survival improvement.18 Because most patients in this group harbor a molecular marker amenable to quantitative MRD monitoring (ie, quantitative detection of mutated NPM1 or RUNX1/RUNXT1 and CBFb/MYH11 fusion genes), a preemptive MRD-driven policy could be offered to most patients in this category.19 This preemptive strategy translated into a favorable EFS of 67% and relatively low relapse incidence of 23% at 2 years, presumably because this preemptive intervention, which included an allo-SCT for molecular failure in 40 patients, prevented the emergence of an overt hematologic relapse in a significant proportion of these patients. Interestingly, we also confirmed our previous observation regarding the comparable outcome of patients with NPM1 mutation without FLT3-ITD or those with a FLT3-ITD mutation with a low allelic ratio, supporting their inclusion in this favorable category and reinforcing our MRD surveillance policy to prevent overt relapses10 (supplemental Material). A recent study performed in the Cancer and Acute Leukemia Group B cooperative group (CALGB) has proposed a refined ELN classification according to specific comutation patterns. Thus, the presence of WT1 mutations in NPM1-mutated AML or SETBP1 and BCOR in non-core binding factor rearranged (CBF) ELN-favorable patients was associated with a worse outcome, and the authors proposed the reallocation of these patients to the adverse- and intermediate-risk group, respectively.20 Whether an MRD-driven preemptive treatment might overcome the negative prognostic impact of these markers is unknown.
As expected, ELN-defined adverse-risk features identified AML entities incurable for most patients, with a lower response rate to initial chemotherapy, a 5-year OS of only 23%, and a relapse risk as high as 53%. These patients represent a current clinical challenge with the need to explore new drugs.21 The category is, however, highly heterogeneous, with diverse genetic lesions with distinct leukemogenic mechanisms, such as KMT2A rearrangements, a DEK-NUP98 fusion gene, or point mutations of TP53, ASXL1, or RUNX1 genes. Accordingly, we identified a very-poor-risk subset, defined by the presence of inv(3)/t(3;3) with GATA2-MECOM1 rearrangement or a complex karyotype, highly enriched in cases with loss of chromosomal material at 5q, 7q, and/or 17p, presumptively involving TP53 mutation in many cases. This subgroup (ELN Adv+) showed a 5-year OS of less than 10%. A high proportion of these patients, more than 50%, do not achieve a planned alloSCT because of lack of response, and those who proceed to alloSCT have a high relapse risk after transplant. When we reanalyzed this adverse-risk category, split between this very-adverse-risk subgroup (ELN Adv+) and the remaining cases of the adverse-risk cohort, the outcome of both adverse-risk groups was markedly different, and in fact, the ELN Adv− group overlapped with the patients with intermediate-risk AML (Figure 6). This observation suggests that the treatment planning according to our protocol, with an alloSCT early after CR, could benefit patients from the ELN Adv− subgroup but only a small fraction of patients from the ELN Adv+ category. In fact, both AML subgroups contained in this ELN Adv+ represent distinct biological entities, and their particularly poor outcome has been previously recognized. A large part of the leukemogenic process driven by the GATA2-MECOM (EVI1) rearrangement, leading to GATA2 haploinsufficiency and MECOM (EVI1) deregulated expression, has been well characterized.22-25 This entity has been associated with a very poor outcome, and the limited role of alloSCT in this context has been specifically analyzed.22,26,27 On the other hand, the poor prognosis of complex karyotype in AML seems, in part, explained by the frequent coexistence of TP53 multihit mutations inducing a loss of the functional wild-type TP53 protein, leading to chemoresistance, as recently recognized in myelodysplastic syndromes.28 Unfortunately, as a limitation of our study, we were not able to determine the proportion of patients from the complex karyotype/TP53 subset that corresponded to a biallelic TP53 mutation. Similarly, the adverse outcome even after alloSCT of frequent cytogenetics such as −5/del(5q), −7/del(7q), 17p, and/or TP53, in the context of a complex karyotype, has been directly addressed and confirmed in recent studies.29-31 Given the poor outcome obtained with the standard approach based on intensive AML-type chemotherapy and alloSCT, the recognition of this subset with very poor prognosis could be essential for the design of novel therapeutic approaches. Potential innovative strategies to improve outcomes of this AML subgroup should focus on pretransplant treatment to increase the response rate and prevent early relapse, as well as maintenance after alloSCT to enhance the graft-versus-leukemia effect and avoid posttransplant relapse.32 Novel current available agents, approved for AML, could contribute to improve outcome of high-risk patients obtained with intensive chemotherapy. Specifically, 1:5 daunorubicin/cytarabine liposomal formulation CPX-351 has demonstrated its role in elderly patients diagnosed with AML with myelodysplasia-related changes, with a clear impact on those patients bridged to alloSCT after treatment with this agent.33 Similarly, the combination of venetoclax with azacytidine has been established as the standard of care in patients not candidate to intensive chemotherapy; its role in younger patients, combined with intensive chemotherapy and other agents, is now been explored.34,35 More recently, investigational agents such as eprenatopopt (APR-246) magrolimab (monoclonal antibody directed against macrophage immune checkpoint CD47), or flotetuzumab (dual-affinity re-targeting [DART], antibody molecule to CD3 and CD123) have shown promising activity in patients with very high-risk genetic features, including TP53 mutation, and should be explored in therapeutic algorithms for higher-risk patients.36-38
The current intermediate-risk group represents the smallest category, involving less than 20% of all patients, being highly enriched in FLT3-ITD. This low proportion of intermediate-risk patients can be attributed, in part, to the nonclassifiable group composed of patients not harboring a cytogenetic or PCR-based genetic ELN defining category and without available NGS testing. Presumably, and based on other large series providing accurate information on the frequency of RUNX1, ASXL, and TP53 sole mutations, the largest part of this nonclassifiable subgroup must correspond to intermediate-risk patients. With the assumption of 70% of nonclassifiable patients as intermediate-risk patients, approximately 29% of our study population would correspond to the ELN intermediate-risk category, a proportion similar to that found in other large cooperative groups.7,20 Because the use of FLT3 inhibitors was minimal in this patient cohort, the impact of the generalized use of midostaurin (or alternative FLT3 inhibitors) should be reanalyzed in future studies. These targeted FLT3 inhibitors have been shown to improve outcomes in patients with FLT3-mutated AML and could lead to the need of risk group reallocation in the future.39 In addition, this category includes patients with cytogenetic abnormalities not classified as favorable or adverse, as well as patients without NPM1 mutation and adverse-risk genetic lesions, which are biologically heterogeneous.29,40 In this context, further knowledge on the prognostic impact of additional markers and gene mutation interactions, such as the deleterious effect associated with BCOR, SETBP1, ZRSR2, or DNMT3A comutations might contribute to redefine the current classification in future updates, as suggested by Eisfeld et al20 from the CALGB network.41
The ELN 2017 classification was proposed by a panel of experts refining the previous ELN 2010 prognostic stratification, collapsing the 2 intermediate subgroups into a unique category and including the contemporary evidence on individual markers with independent prognostic value in different studies.3,4 Its validation has been retrospectively performed in a few studies that confirmed, with some limitations, the ELN 2017 clinical value.7-9,20 These studies differ in the patient population included (up to 60 years in 3 of these 4 studies) and the treatment protocol used, and, most importantly, they did not include a ELN category–based transplant policy. Nonetheless, all these studies were able to confirm its prognostic impact and proposed some refined definitions. Herold et al7 also identified a very poor outcome among patients with TP53 mutation and complex karyotype and highlighted the negative impact of DNMT3A mutations within every ELN 2017 risk group. The aforementioned study by Eisfeld et al20 reallocated specific subgroups of patients according to specific comutations (eg, BCOR and SETBP1 in non-CBF favorable AML and IDH-mutated adverse risk patients should be redefined as intermediate-risk AML; WT1 and ZRSR comutation in NPM1-mutated AML confer an adverse prognosis). With our analysis, we contribute to validate the ELN prognostic stratification in a prespecified treatment protocol, for patients up to 70 years eligible to intensive chemotherapy with a clearly predefined alloSCT policy.
In conclusion, the current ELN 2017 risk classification is able to segregate groups of patients with a different prognosis and is useful to guide postremission alloSCT indications. Moreover, the current analysis confirms that these outcome differences among ELN categories persist even after predefined, risk adapted postremission strategies, establishing alloSCT in first complete remission for all suitable patients with a nonfavorable risk. The poor outcome observed in adverse-risk patients, and especially among ELN Adv+, despite alloSCT, warrants the investigation of experimental strategies aimed to improve pretransplant response depth and prevent relapse after transplantation. Additionally, an accurate clinical use of MRD monitoring can complement the information provided by genetic characterization at diagnosis and identify patients from the favorable-risk category who can benefit from an alloSCT in CR1. Finally, our study confirmed the existence of a very-poor-risk subset among adverse-risk patients who deserve specific investigation of novel therapeutic approaches that might overcome the limitations of the current standard plan.
Acknowledgments
This study was supported (in part) by Fondo de Investigaciones Sanitarias/Instituto de Salud Carlos III (ISCIII) grants PI16/01027, PI19/1476, and PI20/01621; Health Research and Innovation Strategic Plan (PERIS) grant SLT002/16/00433 and research group support SGR 1395 and SGR 1655 from Generalitat de Catalunya; resident award “Emili Letang” 2019 (Hospital Clínic de Barcelona); and “Beca de Investigación FEHH 2019” (Fundación Española de Hematologia y Hemoterapia).
Authorship
Contribution: A.B., A.G., F.G., G.O., M.D.-B., M.A., M.T., S.V., M.P.Q.d.L., R.C., D.G., F.V.-L., L.E., A.G.-G., O.S., A.S., B.M.M., J.B., S.C.-D, and A.O.-C. collected the clinical data. M.L.-G., M.P., L.Z., J.F.N., D.C., M.R., and D.C. performed the cytogenetic and molecular tests. A.B., G.O., M.D.-B., F.G., A.R., P.M., S.B., J.S., and J.E. analyzed the data and wrote the manuscript. All authors reviewed and accepted the manuscript.
Conflict-of-interest disclosure: J.S. reports advisory and speaker fees for Abbvie, Astellas, Jazz Pharmaceuticals, Novartis, and CSL Behring and grant support from Astellas, Novartis, Amgen, Jansen, Pfizer, and Jazz Pharmaceuticals. J.E. reports consultancy for Abbvie, Novartis, Astellas, Pfizer, and Jazz Pharmaceuticals and grand support from Novartis and Jazz Pharmaceuticals. All other authors declare no competing financial interests.
Correspondence: Alex Bataller, Hematology Department, Hospital Clínic of Barcelona, Barcelona, Spain; e-mail: abataller@clinic.cat; or Jordi Esteve, Hematology Department, Hospital Clínic of Barcelona, Barcelona, 08036 Spain; e-mail: jesteve@clinic.cat.

