

Key Points
MRD conversion occurs in 39% of MRD− MM patients and reliably predicts future relapse.
MRD conversion within 10 years of diagnosis confers an inferior overall survival and progress-free survival.

Abstract
Multiple myeloma (MM) patients frequently attain a bone marrow (BM) minimal residual disease (MRD) negativity status in response to treatment. We identified 568 patients who achieved BM MRD negativity following autologous stem cell transplantation (ASCT) and maintenance combination therapy with an immunomodulatory agent and a proteasome inhibitor. BM MRD was evaluated by next-generation flow cytometry (sensitivity of 10−5 cells) at 3- to 6-month intervals. With a median follow-up of 9.9 years from diagnosis (range, 0.4-30.9), 61% of patients maintained MRD negativity, whereas 39% experienced MRD conversion at a median of 6.3 years (range, 1.4-25). The highest risk of MRD conversion occurred within the first 5 years after treatment and was observed more often in patients with abnormal metaphase cytogenetic abnormalities (95% vs 84%; P = .001). MRD conversion was associated with a high risk of relapse and preceded it by a median of 1.0 years (range, 0-4.9). However, 27% of MRD conversion-positive patients had not yet experienced a clinical relapse, with a median follow-up of 9.3 years (range, 2.2-21.2). Landmark analyses using time from ASCT revealed patients with MRD conversion during the first 3 years had an inferior overall and progression-free survival compared with patients with sustained MRD negativity. MRD conversion correctly predicted relapse in 70%, demonstrating the utility of serial BM MRD assessment to complement standard laboratory and imaging to make informed salvage therapy decisions.
Introduction
With the current armamentarium of drugs to treat multiple myeloma (MM), overall survival (OS) has significantly improved, yet the disease remains difficult to cure. Minimal residual disease (MRD) status is a robust predictor of progression-free survival (PFS) and OS in newly diagnosed MM.1-6 Regardless of the therapy instituted or technique of measuring MRD, patients who attain MRD negativity with a sensitivity of ≤10−5 have a better PFS.7-9 Achieving MRD negativity combined with International Myeloma Working Group (IMWG) greater than or equal to complete response (CR) is predictive of superior clinical outcome.10-12 The IMWG endorses both flow cytometry and gene sequencing–based assays, and a recent study demonstrated a high correlation between these 2 approaches.13 Current relapse criteria do not consider detection loss of MRD negativity as a progression factor. Our study tried to assess the clinical implications of the loss of a previously attained marrow- and imaging-based MRD negative state.
Materials and methods
Patient selection
In total, 568 consecutive MM patients were included in this study, who had achieved a sustained very good partial response or better (greater than or equal to VGPR) with bone marrow (BM) MRD negativity confirmed on 2 consecutive readings at least 3 months apart. These patients also had simultaneously positron emission tomography–computed tomography (PET-CT) and/or magnetic resonance imaging with diffusion-weighted whole-body imaging with background body signal suppression (MRI DWIBS) negativity.14,15 Serial response assessment by PET-CT and/or MRI DWIBS functional imaging alongside BM MRD testing was performed to ensure inclusion of only patients with a deep remission without localized detectable disease.16 Despite the IMWG recommendation for PET-CT for imaging response, patients at our institution routinely undergo simultaneous PET-CT, whole-body MRI, and MRI DWIBS due to the complementary nature of the testing. These tests are repeated at frequent intervals depending on disease and treatment characteristics. All patients were treated with induction chemotherapy that included a combination of immunomodulatory agents and proteasome inhibitor added to a backbone of multiagent chemotherapy. This first-line treatment was then followed by high-dose chemotherapy, autologous stem cell transplantation (ASCT), and maintenance therapy with a combination of immunomodulatory agents and proteasome inhibitor, planned for at least 2 years.17 Study schema of these total therapy clinical trials are included in supplemental Figure 1. All patients provided written informed consent after University of Arkansas for Medical Sciences Institutional Review Board approval, and the study was conducted in accordance with the Declaration of Helsinki.
MRD assessment
We routinely integrated serial BM MRD assessment by flow cytometry into our clinical practice since 2010 regardless of disease status or IMWG response.14 BM multicolor flow cytometry assessment was performed at the start of therapy before transplantation, every 3 to 6 months during the first 2 years after transplantation, and then every 6 to 12 months depending on whether patients were still on maintenance therapy. The median number of MRD assessments was 15 assessments per patient (range, 3-17).
BM aspirate MRD assessment was performed using 8-color immunophenotypic next-generation flow cytometric (NGF) analysis with a minimum sensitivity of 10−5 cells.18 BM aspirate samples were immunophenotyped on a FACSCanto II flow cytometer using antibodies to delineate normal and abnormal plasma cells (CD138 [V-500], CD38 [FITC], CD19 [PE-Cy7], CD45 [V-450], CD27 [PercpCy5.5], CD81 [APC-H-7], CD56 [APC], and CD20 [PE]). At least 2 ×10⁶ events were analyzed, and MRD negativity was defined using the standard criteria of <20 events of phenotypically aberrant clonal plasma cells. The sensitivity or the limit of detection for this assay was validated to 20 cells in 2 ×10⁶ events (0.001%), and the reproducibility or lower limit of quantitation is 50 cells in 2 ×10⁶ events. Loss of MRD negativity was defined as detection of 1 or more neoplastic plasma cells in 105 nucleated cells. BM MRD by Adaptive Biotechnologies next-generation sequencing (NGS, Clonoseq)19 was performed in patients who had already attained sustained BM MRD negativity by NGF. In brief, genomic DNA was amplified using locus-specific primer sets for immunoglobulin heavy-chain complete and incomplete as well as for immunoglobulin κ locus (IGκ). The amplified products underwent sequencing, and a clonal immunoglobulin gene rearrangement was identified when at least 2 identical sequencing reads were obtained. The frequency of each clonotype in a sample was determined by calculating the sequencing reads per clonotype divided by the total number of reads in the sample. MRD negativity was defined as the absence of clonal plasma cells in the BM aspirate with a sensitivity of 1 clonal plasma cell in 105 nucleated BM cells. NGS testing was assessed in 47/568 patients included in the current study.
Risk stratification and relapse criteria
Patient were risk stratified by gene expression profiling (GEP) on BM aspirate at the time of diagnosis or presentation to our institution; low risk and high risk (HR) were defined by a GEP70 risk score of <0.66 and ≥0.66, respectively.20-22 Risk was also assessed according to the revised International Staging System (ISS) criteria. IMWG criteria were followed to assess response23 and relapse.14 The median level of MRD positivity (>0.2 ratio of MM cells to normal plasma cells) was used as a cutoff for correlations to risk of relapse (supplemental Figure 2). Specifically, biochemical relapse was defined as relapse with any 1 of the following: a rising M-protein or serum free light chain (FLC), <30% BM plasmacytosis, no new focal lesion on PET-CT scan and/or MRI, no hypercalcemia, renal failure, anemia, bone lesions criteria, no high risk GEP at relapse, or no abnormal metaphase cytogenetics related to MM. Clinical relapse was defined as relapse with any 1 of the following: >30% BM involvement, presence of new focal lesion on imaging (PET-CT, MRI DWIBS), presence of 1 of the CRAB criteria, presence of high-risk GEP signature at relapse, or abnormal metaphase cytogenetics related to MM. Relapse in the form of MRD conversion was defined according to a positive multicolor flow cytometry assessment with detection of at least 1 neoplastic plasma cell in 105 nucleated cells following an initial MRD negativity.
Statistical analysis
Cases with sustained MRD negativity were compared with those who converted to MRD positivity to determine whether end points such as relapse and clinical biomarkers were associated or independent of MRD conversion using the Fisher’s exact test (2 group comparisons) or χ-square test (more than 2 group comparisons). Survival analyses were conducted with the Kaplan-Meier method, and significant differences were assessed by the log-rank test. Given the time-dependent nature of MRD conversion, landmark analyses at 3 and 5 years from first ASCT were performed for overall all survival estimates. Patients who died (n = 41; 6.5 years, median time to death from diagnosis; range, 1.2-21.8) without MRD conversion were censored for all Kaplan-Meier curve analyses. All P values are reported from 2-sided testing with significance considered when <.05. Analyses were performed using GraphPad Prism software (v6).
Results
Risk of MRD conversion is highest within the first 5 years and continues up to 15 years from time of diagnosis
A total of 568 patients achieved MRD negativity (at least at 2 time points, >3 months apart) following initial therapy at a median of 2.4 years after start of therapy (range, 0.2-7.9). Although 47 patients were assessed for MRD status from initiation of treatment to the end of the study, 521 patients had the first BM MRD assessment only after ASCT. Of these patients, 167 patients were evaluated within 2 years of the ASCT, 162 patients between 3 to 5 years, 142 patients between 6 to 10 years, and 50 patients >10 years following ASCT. Overall, the total number of MRD evaluations for the entire cohort was 7987, with an average of 15 assessments per patient (range, 3-17). With a median follow-up of 9.9 years (range, 0.4-30.9) from diagnosis, 61% (344/568) of patients retained their sustained MRD negativity throughout the course of their disease, and the remaining 39% (224/568) experienced MRD conversion from negative to positive. The median time to MRD conversion from the start of treatment was 6.3 years (range, 1.4-25.0) and from first ASCT was 6.0 years (range, 1.0-24.0; Figure 1A). Frequency of MRD conversion and median times from diagnosis and first ASCT according to treatment protocol are provided in supplemental Table 1. Among all the patients who developed MRD conversion, most did so within 10 years of initial MM diagnosis (76%, 170/224). For patients with MRD conversion with ≥10 years follow-up, 55% (54/98) of patients lost MRD negativity ≥10 years from diagnosis, whereas 25% (10/40) of those with ≥15 years follow-up experienced MRD conversion ≥15 years from diagnosis. When considering all patients tested within 5 years of start of therapy (84/568), we found patients were more likely to lose MRD negativity during the first 5 years (89%, 75/84) compared with 5 to 10 (38%, 111/293), >10 (20%, 38/191), and >15 years (16%, 10/55; Figure 1B).
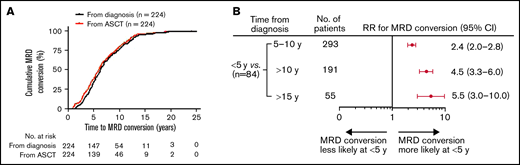
Conversion to MRD positivity more likely occurs within 5 years of diagnosis or from first ASCT. (A) Time to MRD conversion from initial MM diagnosis or from first ASCT. (B) Forest plot of relative risk of patients with MRD conversion within 5 years from diagnosis compared with other time points. RR, relative risk.
Conversion to MRD positivity more likely occurs within 5 years of diagnosis or from first ASCT. (A) Time to MRD conversion from initial MM diagnosis or from first ASCT. (B) Forest plot of relative risk of patients with MRD conversion within 5 years from diagnosis compared with other time points. RR, relative risk.
Abnormal cytogenetics and GEP 70 HR at baseline correlate with MRD conversion
Patient baseline characteristics for the entire cohort and for patients with sustained MRD negativity relative to those that exhibited MRD conversion are summarized in Table 1. The median age of MM diagnosis was 58 years in this cohort, and age ≥60 or ≥65 years did not significantly impact MRD negativity or conversion rates (45%, 153/344 vs 49%, 110/224; P = .30 or 28%, 95/344 vs 34%, 77/224; P = .09). Of the clinical features we assessed, the presence of abnormal metaphase cytogenetic abnormalities at diagnosis more frequently associated with MRD conversion (95%, 211/223 vs 84%, 285/341; P = .001; Table 1; Figure 2). Overall, the majority had low-risk MM as defined by a GEP70 score of ≤0.6620-22 (93%, 496/533, unknown in 35 patients). A similar proportion of low-risk patients was observed within each of the MRD− and MRD conversion–positive patient groups (93%, 295/317 vs 93%, 201/216). At diagnosis, most of the patients were classified as ISS stage 1 (46.8%, 266/568) or ISS stage 2 (32.9%, 187/568); however, there was no difference in distribution of disease stages defined by either ISS or RISS criteria between patients with sustained MRD negativity and MRD conversion. The distribution of GEP subtypes was comparable in both cohorts, with the HY subtype being the most frequent: 32% (101/317) of the MRD negative group and 37% (80/216) of the MRD conversion group (P = .41; Table 1). This trend was also evident in the subset of patients who experienced MRD conversion within 5 years from diagnosis where 36% (25/70) were of the HY subtype. In contrast, patients with MRD conversion after 10 years from diagnosis consisted predominantly of the LB disease and CD2 (t[11;14] and CD20+) subtypes (21% LB [6/29] and 28% CD2 [8/29], respectively, vs 21% HY [6/29]; data not shown).
Patient baseline characteristics
| Characteristic | Total | MRD− | MRD conversion | P-value* |
|---|---|---|---|---|
| (n = 568) | (n = 344) | (n = 224) | ||
| Median age, years (range) | 58 (29-80) | 58 (31-80) | 59 (31-79) | n.d. |
| Age ≥60 y | 263 (46.3) | 153 (44.5) | 110 (49.1) | .30 |
| Age ≥65 y | 172 (30.2) | 95 (27.6) | 77 (34.4) | .09 |
| Female sex | 232 (40.8) | 149 (43.3) | 83 (37.1) | .16 |
| Race | (n = 560) | (n = 340) | (n = 220) | |
| Caucasian | 470 (83.9) | 285 (83.8) | 185 (82.6) | n.d. |
| African American | 77 (13.8) | 46 (13.5) | 31 (13.8) | |
| Asian | 9 (1.6) | 7 (2.0) | 2 (0.9) | |
| Native American | 4 (0.7) | 2 (0.6) | 2 (0.9) | |
| Hispanic | 78 (13.9) | 50 (14.5) | 28 (12.5) | n.d. |
| Isotype | (n = 527) | (n = 318) | (n = 209) | |
| IgA | 85 (16.1) | 48 (15.1) | 37 (17.7) | .93 |
| IgD | 6 (1.1) | 4 (1.3) | 2 (1.0) | |
| IgG | 321 (60.9) | 197 (43.1) | 124 (59.3) | |
| Nonsecretory | 17 (3.2) | 10 (3.1) | 7 (3.3) | |
| LC | 95 (18.0) | 59 (18.6) | 36 (17.2) | |
| Albumin <3.5 g/dL | 150 (26.4) | 88 (25.6) | 62 (27.7) | .63 |
| B2M | (n = 565) | (n = 341) | ||
| ≥3.5 mg/L | 121 (21.4) | 68 (19.9) | 53 (23.7) | .30 |
| >5.5 mg/L | 45 (8.0) | 23 (6.7) | 22 (9.8) | .21 |
| ISS | ||||
| Stage 1 | 266 (46.8) | 163 (47.4) | 103 (46.0) | .74 |
| Stage 2 | 187 (32.9) | 115 (33.4) | 72 (32.1) | |
| Stage 3 | 115 (20.3) | 66 (19.2) | 49 (21.9) | |
| RISS | (n = 215) | (n = 114) | (n = 101) | |
| Stage 1 | 51 (23.7) | 30 (26.3) | 21 (20.8) | .53 |
| Stage 2 | 146 (67.9) | 76 (66.7) | 70 (69.3) | |
| Stage 3 | 18 (8.4) | 8 (7.0) | 10 (9.9) | |
| Creatinine ≥2 mg/dL | 30 (10.4) | 17 (4.9) | 13 (5.8) | .70 |
| CRP ≥8 mg/L | 59 (8.5) | 44 (12.8) | 15 (6.7) | .02 |
| Hb <10 g/dL | 180 (31.7) | 108 (31.4) | 72 (32.1) | .85 |
| LDH ≥190 U/L | 132 (23.2) | 75 (21.8) | 57 (25.4) | .36 |
| Cytogenetic abnormalities | (n = 564) | (n = 341) | (n = 223) | |
| Any abnormality at a given locus | 240 (42.6) | 139 (40.7) | 101 (45.3) | .001 |
| Hypodiploidy | 90 (16.0) | 51 (15.0) | 39 (17.5) | |
| Hyperdiploidy | 166 (29.4) | 95 (27.9) | 71 (31.8) | |
| None | 68 (12.1) | 56 (16.4) | 12 (5.4) | |
| Free light chains | (n = 523) | (n = 317) | (n = 206) | |
| κ | 338 (64.6) | 210 (66.2) | 128 (62.1) | n.d. |
| Λ | 178 (33.4) | 106 (33.4) | 72 (35.0) | |
| Normal FLC ratio | (n = 509) | (n = 304) | (n = 205) | n.d. |
| 162 (31.8) | 100 (32.9) | 62 (30.2) | ||
| GEP70 high risk (≥0.66) | (n = 533) | (n = 317) | (n = 216) | n.d. |
| 37 (6.9) | 22 (6.9) | 15 (6.9) | ||
| GEP subgroup | (n = 533) | (n = 317) | (n = 216) | |
| CD-1 | 40 (7.5) | 25 (7.9) | 15 (7.0) | .41 |
| CD-2 | 106 (19.9) | 64 (20.2) | 42 (19.4) | |
| HY | 181 (34.0) | 101 (31.9) | 80 (37.0) | |
| LB | 74 (13.9) | 42 (13.2) | 32 (14.8) | |
| MF | 30 (5.6) | 22 (6.9) | 8 (3.7) | |
| MS | 56 (10.5) | 31 (9.8) | 25 (11.6) | |
| PR | 46 (8.6) | 32 (10.1) | 14 (6.5) | |
| Autologous transplant | ||||
| x1 | 568 (100) | 344 (100) | 224 (100) | n.d |
| x2 | 456 (80.3) | 283 (82.3) | 173 (80.1) |
Data are numbers (%) unless otherwise noted.
B2M, β-2-microglobulin; CRP, C-reactive protein; Hb, hemoglobulin; Ig, immunoglobin; LB, low bone; LC, light chain; LDH, lactate dehydrogenase; n.d., not determined; RISS, Revised International Staging System.
P-value determined by Fisher’s exact test.
![Abnormal cytogenetics in MM correlates with increased conversion from negative to positive MRD. MRD conversions were significantly more frequent for patients with any abnormality detected within the tumor including del17p, t(1:22), t(11:14)), hypodiploidy, or hyperdiploidy compared with those with normal tumor cytogenetics (hazard ratio [HR], 1.4; 95% confidence interval [CI], 1.1-1.8; P = .002). Upper and lower bands represent 95% CI.](https://ash.silverchair-cdn.com/ash/content_public/journal/bloodadvances/6/3/10.1182_bloodadvances.2021005822/5/m_advancesadv2021005822f2.png?Expires=1769128215&Signature=3OzInDGoCMfTW2wydytymIalAXycpfvuDSLzv8D65saH4TjCqkjX6N9JodVQqpg-7akzZicurduNeA4gPDJBNgt~QLZmWVnNEQLCN-l4YL-c3m0iV55454mn58r6a3rbJwHzWGZm-CIPScJfngW-UdYg1vMvRlmI5VyVuRyMl3EQL2KsFAgQfc0AnX8KbBHixKIT8~HIiY8KVY2Qh77IwNa5mg~43HmKdN5WOPh9fTdpfdp0fTvg2MNqPCSA6-ePuK5RaWv5GCKHtzgKImZ5o1BqjCp2mSZ50XpnO1AHp1k3PKhXA8~ZPSbj7Y9B-QD-B1-zOqMQsnmbactoi426ng__&Key-Pair-Id=APKAIE5G5CRDK6RD3PGA)
Abnormal cytogenetics in MM correlates with increased conversion from negative to positive MRD. MRD conversions were significantly more frequent for patients with any abnormality detected within the tumor including del17p, t(1:22), t(11:14)), hypodiploidy, or hyperdiploidy compared with those with normal tumor cytogenetics (hazard ratio [HR], 1.4; 95% confidence interval [CI], 1.1-1.8; P = .002). Upper and lower bands represent 95% CI.
Abnormal cytogenetics in MM correlates with increased conversion from negative to positive MRD. MRD conversions were significantly more frequent for patients with any abnormality detected within the tumor including del17p, t(1:22), t(11:14)), hypodiploidy, or hyperdiploidy compared with those with normal tumor cytogenetics (hazard ratio [HR], 1.4; 95% confidence interval [CI], 1.1-1.8; P = .002). Upper and lower bands represent 95% CI.
MRD negativity within 6 months of diagnosis indicates a higher likelihood of MRD conversion and future clinical relapse
The timing and patterns of relapse in relation to MRD conversion were investigated to confirm that initial loss of MRD positivity reliably predicted future clinical relapses and determine whether time to MRD negativity impacted the likelihood of MRD conversion. As anticipated, based on the clinical implications of MRD positivity, MRD conversion was strongly associated with increased risk of relapse, whereas sustained MRD negativity predicted for freedom from relapse (73%, 163/224 vs 4%, 14/344; RR, 3.5; P < .0001, Table 2; Figure 3A). The 4% clinical relapses observed in the MRD− cases all presented with macrofocal disease on MRI and/or PET-CT scan without microscopic myeloma involvement of the random BM.24,25 In the 163 patients with MRD conversion and subsequent relapse, most had a clinical relapse (118/163; 72%), whereas biochemical relapses only were seen in the remaining 28% (45/163) of the cases (Table 2). Both clinical and biochemical relapses occurred at a significantly higher frequency in patients with MRD conversion compared with those with sustained MRD negativity (53%, 118/224 vs 4%, 14/344; P < .0001 and 20%, 45/224 vs 0%, 0/344; P < .0001, respectively, Table 2). Loss of MRD negativity preceded clinical relapse at a median time of 1.0 years (range, 0-4.9) and biochemical relapse at about half this time with a median time of 0.5 years (range, 0-2.7). Of note, MRD conversion without clinical relapse was observed in 27% (61/224), with the majority of these cases belonging to GEP70 subtypes CD2 and HY (65%, 40/61; CD2, n = 20; HY, n = 20, data not shown). Interestingly, early attainment of MRD negativity (within 6 months from start of therapy) was associated with a higher risk of MRD conversion (57%, 24/42 vs 38%, 200/526; P = .02) and IMWG relapse (50%, 21/42 vs 29%, 156/526; P = .009; Figure 3B). Patients with early MRD negativity experienced a shorter time to MRD conversion (P < .0001; Figure 3C).
MRD relapse patterns
| MRD status | |||
|---|---|---|---|
| Clinical End Point | MRD− | MRD conversion | P-value* |
| (n = 344) | (n = 224) | ||
| No clinical relapse | 330 (95.9) | 61 (27.2) | <.0001 |
| Relapse† | 14 (4.1) | 163 (72.8) | <.0001 |
| Clinical relapse‡ | 14 (4.1) | 118 (52.7) | <.0001 |
| Biochemical relapse§ | 0 (0.0) | 45 (20.1) | <.0001 |
Data are numbers (%) unless otherwise noted.
P-value determined by Fisher’s exact test.
Relapse defined using IMWG criteria, reappearance of serum or urine M-protein by immunofixation or electrophoresis, development of >5% plasma cells in the BM, or appearance of any other sign of progression (ie, new plasmacytoma, lytic bone lesion, or hypercalcaemia)14
Clinical relapse defined as relapse with any 1 of the following: >30% BM involvement, presence of focal lesion on imaging (PET-CT, MRI DWIBS), presence of CRAB criteria, presence of high-risk GEP signature at relapse, or abnormal metaphase cytogenetics due to MM.
Biochemical relapse defined as relapse with any 1 of the following: a rising M-protein or FLC, <30% BM involvement, focal lesion on imaging (PET-CT, MRI DWIBS), no CRAB criteria, no high-risk GEP signature at relapse, or no abnormal metaphase cytogenetics due to MM.
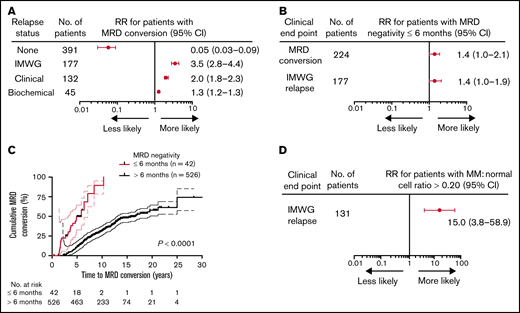
MRD negativity within 6 months of diagnosis increases likelihood of MRD conversion and relapse in MM patients. Forest plots (A-B) of the relative risk for (A) patients with MRD conversion to experience the given clinical end point. Patients with MRD conversion were confirmed to be more likely to have disease progression relative to patients with sustained MRD negativity, particularly for clinical relapse. (B) Patients with attainment of MRD negativity up to 6 months from treatment have a greater risk of MRD conversion or clinical relapse relative to patients with first MRD negativity detected >6 months. (C) Patients that achieved MRD negativity up to 6 months from treatment have a more rapid time to MRD conversion from initial MM diagnosis (HR, 65.5; 95% CI, 26.7-163.0; P < .0001). (D) Forest plot of the RR for patients with clinical relapse are more likely to experience an IMWG-defined relapse using a cutoff of >0.20 ratio of myeloma to normal plasma cells. Number of patients represents the total number of patients with the given clinical end point. Upper and lower bars represent 95% CI.
MRD negativity within 6 months of diagnosis increases likelihood of MRD conversion and relapse in MM patients. Forest plots (A-B) of the relative risk for (A) patients with MRD conversion to experience the given clinical end point. Patients with MRD conversion were confirmed to be more likely to have disease progression relative to patients with sustained MRD negativity, particularly for clinical relapse. (B) Patients with attainment of MRD negativity up to 6 months from treatment have a greater risk of MRD conversion or clinical relapse relative to patients with first MRD negativity detected >6 months. (C) Patients that achieved MRD negativity up to 6 months from treatment have a more rapid time to MRD conversion from initial MM diagnosis (HR, 65.5; 95% CI, 26.7-163.0; P < .0001). (D) Forest plot of the RR for patients with clinical relapse are more likely to experience an IMWG-defined relapse using a cutoff of >0.20 ratio of myeloma to normal plasma cells. Number of patients represents the total number of patients with the given clinical end point. Upper and lower bars represent 95% CI.
Levels of MRD conversion were also predictive of the clinical phenotype of relapse. Using a ratio of abnormal plasma cells to normal plasma cells by flow cytometry of >0.20 as a cutoff, patients meeting this threshold in their BM had a 15-fold increased risk of clinical relapse (RR,15.0; 95% CI, 3.8 to 58.9; P < .0001; Figure 3D). In addition, 47 patients with MRD negativity by NGF and imaging were also negative for MRD by NGS, with a 47% (22/47) concordance in negativity between NGS and NGF. The remaining cases were negative by NGF but positive by NGS (53%, 25/47; NGF−/NGS+). There were no clinical relapses in the patients with MRD negativity by NGF−/NGS+.
Late MRD conversion confers a similar favorable OS as achieved with sustained MRD negativity
Because MM patients with relapsed disease typically exhibit poor outcome, it was not surprising that MRD conversion corresponded to an inferior OS and PFS when the entire cohort of patients was assessed (OS: HR, 1.7; 95% CI, 1.1-2.7, P = .01 and PFS: HR, 18.9; 95% CI, 13.2-27.0, P < .0001; Figures 4A-B). The median OS from diagnosis was 26.2 years (range, 2.2-26.2), and PFS was 10.2 years (range, 1.7-26.2) for those patients with MRD conversion, whereas in patients with sustained MRD negativity, median OS or PFS has not been reached (OS at 10 years: 90%; PFS at 10 years: 88%). To avoid a time bias due to the time dependence of MRD conversion, we performed the remaining survival analyses with designated time points from first ASCT that included only patients alive with known MRD status at that time point. With a landmark analysis of 3 years from first ASCT, MRD conversion had a detrimental effect on OS and PFS compared with sustained MRD negativity (OS: HR, 5.7; 95% CI, 6.3-63.0, P < .0001; and PFS: HR, 4.5; 95% CI 4.3-33.7, P < .0001; Figure 4C-D). Such a negative prognostic impact of MRD conversion was not observed after 5 years, where OS and PFS were comparable to patients with sustained MRD negativity (OS: HR, 1.4; 95% CI, 0.6-3.6; P = .47; and PFS: HR, 1.0; 95% CI, 0.5-2.0; P = .96; supplemental Figure 3A-B). To assess whether timing of MRD conversion influences patient outcome, we grouped patients positive for MRD conversion according to cutoffs from first ASCT. Follow-up was then based on date of MRD conversion. Patients with MRD conversion ≤3 years from first ASCT had significantly lower OS compared with patients with MRD conversion occurring after 3 years from first ASCT (HR, 2.8; 95% CI 1.8-8.2; P = .0003; Figure 5A). Although to a lesser extent, this time-dependent MRD conversion effect on OS persisted when patients were stratified at <5 years and ≥5 years from first ASCT (HR, 2.1; 95% CI 1.2-4.0; P = .01; Figure 5B).
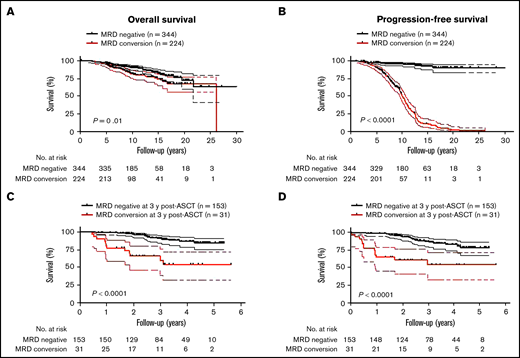
MRD conversion confers inferior survival compared with sustained MRD negativity. (A) OS of patients with MRD conversion is worse compared with patients with sustained MRD negativity (HR, 1.7; 95% CI, 1.1-1.7, P = .01). (B) PFS of patients with MRD conversion vs patients with sustained MRD negativity is significantly inferior (HR, 18.9; 95% CI, 13.2-27.0, P < .0001). In a landmark analysis at 3 years post-ASCT, (C) OS was significantly worse for patients that converted from MRD− to -positive compared with patients with sustained MRD negativity (HR, 20.0; 95% CI, 6.3-63.0, P < .0001). (D) PFS of patients with MRD conversion is significantly worse than patients with sustained MRD negativity (HR, 4.5; 95% CI, 4.3-33.7, P < .0001). Upper and lower bands represent 95% CI.
MRD conversion confers inferior survival compared with sustained MRD negativity. (A) OS of patients with MRD conversion is worse compared with patients with sustained MRD negativity (HR, 1.7; 95% CI, 1.1-1.7, P = .01). (B) PFS of patients with MRD conversion vs patients with sustained MRD negativity is significantly inferior (HR, 18.9; 95% CI, 13.2-27.0, P < .0001). In a landmark analysis at 3 years post-ASCT, (C) OS was significantly worse for patients that converted from MRD− to -positive compared with patients with sustained MRD negativity (HR, 20.0; 95% CI, 6.3-63.0, P < .0001). (D) PFS of patients with MRD conversion is significantly worse than patients with sustained MRD negativity (HR, 4.5; 95% CI, 4.3-33.7, P < .0001). Upper and lower bands represent 95% CI.
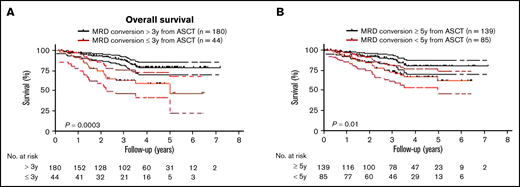
Timing of MRD conversion correlates with MM patient survival. (A) Patients undergoing MRD conversion ≤3 years from ASCT compared with >3 years have an inferior OS (HR, 2.8; 95% CI, 1.8-8.2, P = .0003). (B) Patients undergoing MRD conversion <5 years from ASCT compared with ≥5 years have an inferior OS (HR, 2.1; 95% CI, 1.2-4.0, P = .01). Upper and lower bands represent 95% CI.
Timing of MRD conversion correlates with MM patient survival. (A) Patients undergoing MRD conversion ≤3 years from ASCT compared with >3 years have an inferior OS (HR, 2.8; 95% CI, 1.8-8.2, P = .0003). (B) Patients undergoing MRD conversion <5 years from ASCT compared with ≥5 years have an inferior OS (HR, 2.1; 95% CI, 1.2-4.0, P = .01). Upper and lower bands represent 95% CI.
Discussion
Our study provides a comprehensive longitudinal response assessment with serial integration of PET-CT and MRI DWIBS studies along with BM MRD testing regardless of disease status. MRD conversion was found in a significant proportion of MM patients (39%) and preceded clinical relapse by a median of 1.0 years. The kinetic pattern of MRD evolution is more informative than a single measurement. As anticipated, sustained MRD negativity was achieved in a significant proportion (93%) of low-risk MM. Most of the patients in this study showed MRD conversion within 10 years of initial diagnosis (76%, 170/224). The median time to MRD conversion was 6 years from ASCT, suggesting that this likely occurred after completion of the standard 3 years of triplet maintenance therapy employed at our institution. Risk of MRD conversion was much higher within 5 years of diagnosis, and although it diminished over time, the risk persisted up to 15 years after diagnosis. However, among those who were still MRD− at 10 years, the subsequent risk of MRD conversion was low (31%). Clinical disease relapses occurred in 70% of the patients who developed MRD conversion, and 29% of patients with MRD conversion had a positive PET/MRI, again emphasizing the importance of novel imaging techniques and BM MRD assessments, particularly in the relapsed setting.17,26 It should be noted that 27.1% of MRD conversions were not associated with a clinical relapse, and this subset was enriched in CD2 and HY GEP subtype, accounting for 74% of these cases. It is plausible to have a conversion from CR into a monoclonal gammopathy of undetermined significance-like state with a stable residual MRD clone that could cohabitate with the BM microenvironment with no clinical consequences.21,27 Previous reports showed that the GEP subtype CD2 had the lowest rate of CR and MRD negativity despite a comparable clinical outcome to CD1, the subtype with the highest CR rates. In addition, the CD2 subtype could suffer from late relapses, often heralded by MRD conversion, and still have a favorable overall clinical course.28,29 Interestingly, in our analysis, MRD conversion beyond 5 years from diagnosis did not appear to compromise OS, and this is in line with our observation of favorable clinical outcome in patients suffering late relapses from initial diagnosis.30 The time to MRD conversion is of paramount significance and portends inferior clinical outcome, particularly within the first 3 to 5 years from ASCT. More importantly, we show that MRD conversion from negative to positive confers a more favorable outcome compared with patient with persistent MRD positivity throughout the disease course.31,32 In a subset of patients with serial MRD assessment from diagnosis, we noted an apparent paradox of early attainment of MRD negativity associated with an inferior clinical outcome. This is in agreement with previous publications showing that a precipitous response to induction therapy is an indicator of a more proliferative MM.33-35
The available literature on the impact of loss of MRD negativity or MRD conversion is limited by relatively short follow-up and small heterogenous sample size.36,37 The PETHEMA/GEM2012MENOS65 trial showed an MRD conversion from negative to positive in 17% of patients at 40 months follow-up. In the same study, MRD− relapse was reported in 7% of the population, with more than half of these patients being early responders who achieved MRD negativity after induction therapy and much akin to their disease presentation at the time of initial diagnosis.12 Current literature reports a variable rate of MRD negativity in HR MM, particularly in the subset of patient with (del)17p.38-42 Prospective clinical trials of high-risk MM incorporating monoclonal antibodies with novel agents have reported CR rates of 2.1% to 59%.43,44 More recent studies support the concept of tandem ASCT in intermediate- and high-risk MM.45,46 However, despite 80% of patients receiving a tandem ASCT and all patients receiving at least 1 ASCT, HR MM accounts for only 6.9% of patients with sustained MRD, compared with 17% of MM patients at diagnosis, emphasizing the treatment challenges in this subset of patients. Furthermore, once sustained MRD negativity was attained, the MRD conversion rates were not different among the HR and low risk, consistent with other reports that sustained MRD negativity appears to abrogate the poor clinical outcome in HR MM.1,7 MRD by NGS is a very robust predictor of clinical outcome.39 A concordance rates of 47% between MRD by NGS and NGF observed in our study parallels to those previously published7 but lower than a recently reported study that compared a larger number of cases.13 Our observation of NGF−/NGS+ confirms a potentially higher rate of NGF false positives for discordant cases.13 However, MRD discordance (MRD NGF−/NGS+) in our study was not associated with an increased risk of clinical relapse in this cohort perhaps due to preferential NGS testing in patients with sustained MRD by flow cytometry and imaging.
These data should be interpreted cautiously because we cannot confirm that these patients ever attained BM MRD negativity by NGS posttransplantation. It is plausible, however, that these patients had a stable residual MRD clone with no clinical consequences (immune equilibrium) akin to the subset with MRD conversion but without clinical relapse.27,47,48 In addition, in such cases, deeper testing detected immature clonotypic cells that lacked most somatic mutations and copy number variation found in myeloma plasma cells and thus were unable to drive disease relapse.49
In conclusion, the current study demonstrates that long-term MRD negativity with a sensitivity of 10−5 could be achieved in 61% of study cohort after a transplant-based approach and at least 2 years of combined maintenance therapy. The limitations of the study include MRD assessment at various time points from upfront ASCT as MRD by NGF testing was only standardized for clinical practice at our center between 2010 and 2014 and the heterogeneous therapy received by patients. A recent large meta-analysis by Munshi and colleagues showed that a MRD negative status surpasses disease stage, risk factor and treatment employed.9 Accordingly, MRD− status attained in this study cohort is clinically relevant regardless of the different treatment regimens. In addition, correlations were drawn from GEP70 and not fluorescence in situ hybridization data, the latter being readily applied to clinical practice but less informative. Although our study reflects a single institution experience with the longest follow-up reported to date with a more intense treatment approach and follow-up, it underscores the applicability of long-term sequential MRD assessment in predicting relapse because current data suggest that the means of attaining MRD do not matter as much as the goal itself.
Acknowledgments
The authors thank their patients and families for the opportunity to be involved in their care and their willingness to contribute to the advancement of the field.
This work was supported in part by the National Institutes of Health (P20GM121293; S.K.) and the American Society of Clinical Oncology Conquer Cancer Merit Awards 2020 (M.M.).
Authorship
Contribution: M.Z., F.v.R., M.M., D.A., J.S., E.T., C.S., and S.T. were involved in conception and design; M.M., N.Y., D.A., Y.P., A.R., R.P., and J.L. were involved with provision of study materials or patients; M.M., N.Y., D.A., Y.P., A.R., R.P., and J.L. were involved with collection and assembly of data; M.Z., M.M., and S.K. were involved with data analysis and interpretation; M.M., S.K., and M.Z. were involved with manuscript writing; F.v.R. and D.A. were involved with editing of the manuscript; and all authors were involved with the final approval of the manuscript.
Conflict-of-interest disclosure: The authors declare no competing financial interests.
Correspondence: Maurizio Zangari, 4301 W Markham St., Little Rock AR 72223; e-mail: mzangari@uams.edu.

