

Key Points
Pevonedistat targets the NFκB pathway to inhibit growth of MPN and sAML cells.
Pevonedistat reduces disease burden in MPN mouse models.

Abstract
Targeted inhibitors of JAK2 (eg ruxolitinib) often provide symptomatic relief for myeloproliferative neoplasm (MPN) patients, but the malignant clone persists and remains susceptible to disease transformation. These observations suggest that targeting alternative dysregulated signaling pathways may provide therapeutic benefit. Previous studies identified NFκB pathway hyperactivation in myelofibrosis (MF) and secondary acute myeloid leukemia (sAML) that was insensitive to JAK2 inhibition. Here, we provide evidence that NFκB pathway inhibition via pevonedistat targets malignant cells in MPN patient samples as well as in MPN and patient-derived xenograft mouse models that are nonredundant with ruxolitinib. Colony forming assays revealed preferential inhibition of MF colony growth compared with normal colony formation. In mass cytometry studies, pevonedistat blunted canonical TNFα responses in MF and sAML patient CD34+ cells. Pevonedistat also inhibited hyperproduction of inflammatory cytokines more effectively than ruxolitinib. Upon pevonedistat treatment alone or in combination with ruxolitinib, MPN mouse models exhibited reduced disease burden and improved survival. These studies demonstrating efficacy of pevonedistat in MPN cells in vitro as well as in vivo provide a rationale for therapeutic inhibition of NFκB signaling for MF treatment. Based on these findings, a Phase 1 clinical trial combining pevonedistat with ruxolitinib has been initiated.
Introduction
The identification of JAK2 V617F and other driver mutations (eg, CALR, MPL) that activate JAK-STAT signaling in myeloproliferative neoplasms (MPNs)1 has led to the development of targeted inhibitors of JAK2 (eg ruxolitinib), which are now widely used for the treatment of patients with MPNs, in particular myelofibrosis (MF). These agents provide substantial symptomatic benefit, but they do not eradicate the underlying malignant clone, nor do they prevent transformation to secondary acute myeloid leukemia (sAML).2,3 These observations suggest that other signaling pathways may be dysregulated in a manner that promote survival of the malignant clone despite JAK2 inhibition.4
Previous studies from our group used mass cytometry to identify a high prevalence of NFκB pathway hyperactivation in MF and sAML. CD34+ hematopoietic stem/progenitor cells (HSPCs) from MF and sAML patients were found to exhibit elevated levels of p65/RELA phosphorylation (p-p65/RELA), both basally as well as in response to TNFα stimulation.5 Treatment with ruxolitinib did not ablate the activated NFκB signaling, nor did it fully ameliorate the hyperproduction of circulating inflammatory cytokines observed in MF.5,6 These observations suggest that targeting the NFκB pathway may provide therapeutic benefit for MF patients beyond JAK2 inhibition. In this study, we thus sought to investigate the therapeutic potential of NFκB pathway inhibition utilizing pevonedistat, a NEDD8-activating enzyme inhibitor which inhibits NFκB signaling by preventing the degradation of IκBα.7 Here, we demonstrate that pevonedistat can potently suppress proliferation in vivo and ex vivo and inhibit disease progression across multiple MPN mouse models in a manner that is nonredundant with ruxolitinib.
Methods
Patient samples
Primary peripheral blood (PB) or bone marrow (BM) samples were obtained with written consent according to a protocol approved by the Washington University Human Studies Committee (WU no. 01-1014). Mononuclear cells were obtained by Ficoll gradient extraction and cryopreserved according to standard procedures. Patient information is listed in supplemental Table 1.
Cell viability assay
HEL cells were plated in triplicate in a 96-well assay plate at 0.05 M cells per mL in the presence of ruxolitinib and/or pevonedistat. Viability was assessed after 72 hours with AlamarBlue reagent. Fluorescence was measured on a Biotek Microplate Reader.
RT-qPCR for NFκB target genes
Quantitative reverse transcription polymerase chain reaction (RT-qPCR) was performed on HEL cells and fluorescence-activated cell sorted lineage-negative CD34+ cells from cryopreserved peripheral blood mononuclear cells (PBMCs) and bone marrow mononuclear cells (BMMCs). Cells were incubated with 1 μM pevonedistat and/or 20 ng/mL TNFα for 4 hours. The samples were then fixed for 10 minutes at room temperature with 1.6% formaldehyde. Ribonucleic acid (RNA) extraction was performed using the Qiagen RNeasy kit, followed by reverse transcription using the Thermofisher SuperScript IV First-Strand Synthesis kit. The complementary DNA was then used as the template for the RT-qPCR using primers specific to NFκB target genes of interest8,9 and are as follows: NFKBIA_Forward: 5'-GTCCTTGGGTGCTGATGT-3', NFKBIA_Reverse: 5'-GAGAATAGCCCTGGTAGGTAA-3', NFKB1_Forward: 5'-TGGTATCAGACGCCATCTA-3', NFKB1_Reverse: 5'-GCTGTCCTGTCCATTCTTAC-3', NFKB2_Forward: 5'-AATTGAACTCCTCCATTGTG-3', NFKB2_Reverse: 5'-CCTCTCTGCTTAGGCTGTT-3', ACTB_Forward: 5'-GCATGGAGTCCTGTGGCAACCACG-3', and ACTB_Reverse: 5'-GGTGTAACGCAACTAAGTCATAG-3'.
Colony forming unit assays
Lineage-negative CD34+ cells were sorted from MF patient PBMCs and healthy donor BMMCs and plated in Methocult H4230 (StemCell) with pevonedistat, ruxolitinib, and/or TNFα at concentrations described. Colonies were enumerated after 2 weeks in culture.
Phospho-flow cytometry
HEL cells were incubated with the corresponding concentration of pevonedistat for 1 hour, and a subset of the samples was stimulated with TNFα for the last 15 minutes. The samples were fixed with 1.6% formaldehyde for 10 minutes at room temperature, then permeabilized and stained with the intracellular antibodies. The samples were analyzed using a BD Fortessa flow cytometer.
Annexin V apoptosis assay
4 × 10⁵ HEL cells were seeded per well and treated with ruxolitinib, pevonedistat, or combination for 48 hours. Posttreatment, cells were washed with phosphate buffer saline (PBS) and resuspended in binding buffer per the PE Annexin V Apoptosis Detection Kit I (BD Biosciences). Cells were then incubated with PE-Annexin V, stained with 7-AAD viability staining solution, and run on the BD FACSCanto II Cell Analyzer. Cells were then analyzed by flow cytometry, in which Annexin V+/7-AAD+ cells were identified as necroptotic, Annexin V+/7-AAD- as apoptotic, and Annexin V-/7-AAD- as healthy.
Cell cycle assay
4 × 10⁵ HEL cells were seeded per well and treated with ruxolitinib, pevonedistat, or combination for 96 hours. Cells were then washed with PBS and fixed in 70% ethanol for 24 hours. Postfixing, cells were then washed with PBS and treated with ribonuclease, followed by staining with propidium iodide. Cells were then run on the BD FACSCanto II Cell Analyzer and analyzed with FlowJo.
RNA sequencing
1 × 10⁶ HEL cells were seeded and treated with ruxolitinib, pevonedistat, or combination for 24 hours. Posttreatment, cells were washed with PBS and RNA was extracted using RNeasy Mini Kit (Qiagen) with DNase treatment in duplicate. Samples were then indexed, pooled, and sequenced by Illumina NovaSeq 6000. Basecalls and demultiplexing were performed with Illumina’s bcl2fastq software and a custom python demultiplexing program with a maximum of one mismatch in the indexing read. RNA-sequencing (RNA-seq) reads were then aligned to the Ensembl release 76 primary assembly with STAR version 2.5.1a.10 Trimmed Mean of the M-values (TMM) normalization size factors in EdgeR11 were calculated to adjust for samples for differences in library size. Ribosomal genes and genes not expressed in the smallest group size minus one sample greater than one count-per-million were excluded from further analysis. The TMM size factors and the matrix of counts were then imported into the R/Bioconductor package Limma.12 Differential expression analysis was then performed and the results were filtered for candidates with a Benjamini-Hochberg false-discovery rate adjusted P values less than or equal to .05. Gene set enrichment analysis (GSEA) of MSigDb pathways was performed using the R/Bioconductor package GAGE (Generally Applicable Gene-set Enrichment)13 on candidates obtained from Limma analysis and using GSEA14 software with the Hallmark gene set.
Mass cytometry
Cell staining protocols were derived from Bendall et al15 utilizing previously validated antibody panels.5 Briefly, cryopreserved cells were thawed, stained with 2.5 μM cisplatin, incubated for a 30-minute recovery period at 37°C, and then treated with pevonedistat for 1 hour, followed by stimulation with TNFα for 15 minutes. Cells were then fixed with formaldehyde, washed, and stained with antibodies. The intracellular cytokine protocol has been previously described.16 Briefly, cryopreserved cells were thawed, incubated for a 30-minute recovery period at 37°C, and then incubated with inhibitors for 4 hours at 37°C. Cells were treated with eBioscience Protein Transport Inhibitor Cocktail (500X) (Invitrogen Life Technologies) for the last 2 hours of incubation. Following, cells were resuspended, counted, and stained. The panel of antibodies used was previously described.6 Following surface marker staining, cells were stained with 2.5 μM cisplatin, washed, fixed, permeabilized, and stained with intracellular cytokine antibodies. Cells were barcoded using metal barcode solutions diluted in 1x Maxpar Barcode Perm Buffer (Fluidigm). Barcoded cells were fixed in 2% paraformaldehyde and labeled with Ir-intercalator (Fluidigm) to allow DNA-positive cell labeling. Mass-channel data were recorded on a CyTOF2 mass cytometer (Fluidigm). Data were decoded using single cell debarcoder software (https://github.com/nolanlab/single-cell-debarcoder) and analyzed in Cytobank (cytobank.org).
Mouse studies
All procedures were conducted in accordance with the Institutional Animal Care and Use Committee of Washington University.
Ba/F3-MPL W515L-GFP mouse model
Ba/F3-MPL W515L-GFP cells (105 per mouse) were injected into the tail vein of 7-week-years old female BALB/cJ mice (The Jackson Laboratories). Treatment with vehicle (20% 2-Hydroxypropyl-β-cyclodextrin) or pevonedistat (60 mg/kg) began immediately after cell injection, twice daily by subcutaneous injection, Monday through Friday. PB was collected every Friday, and GFP+ cells were analyzed by flow cytometry. Survival was monitored daily, and moribund mice were humanely euthanized. At the time of death, liver and spleen were collected and weighed, and BM was collected to analyze GFP+ cells by flow cytometry.
Jak2 V617F mouse model
Whole BM was harvested from tibias and femurs of CD45.2 donor mice (6-12 weeks old) by flushing and cells were resuspended and filtered in sort buffer (PBS containing 0.5% bovine serum albumin [BSA] and 2mM ethylenediaminetetraacetic acid [EDTA]). 1 × 10⁵ bead-enriched Kit+ cells were collected from CD45.2 Jak2 V617F donor mice and transplanted via tail vein into CD45.1 lethally irradiated recipient mice. Recipient mice were irradiated with a total of 1100 cGy, given as 2 separate doses of 550 cGy with 3-5 hours between doses. Within 3 hours of the last irradiation, mice were transplanted. For 2 weeks following transplant, the mice were caged with water containing 0.5 mg/mL Trimethoprim/sulfamethoxazole (Washington University Division of Comparative Medicine Pharmacy). Two weeks after transplant, PB was collected and hematologic parameters were measured by flow cytometry and Hemavet. Mice were treated with vehicle (20% 2-Hydroxypropyl-β-cyclodextrin subcutaneously and/or 5% dimethyl acetamide 0.5% methocellulose by oral gavage) and/or daily subcutaneous pevonedistat (60 mg/kg), and/or ruxolitinib (90 mg/kg) by oral gavage twice daily. Treatment began 2 weeks after transplant, Monday through Friday. Mice were treated for 4 weeks, PB was collected every Friday, and cells were analyzed by flow cytometry and Hemavet.
MPL W515L mouse model
Retroviral transduction was performed as previously described.17 In brief, retrovirus was produced by transfecting 293T cells with viral plasmids with jetPrime transfection. Viral supernatant was collected after 24 hours. Whole BM was harvested from tibias and femurs of CD45.2 donor mice (6-12 weeks old) by flushing. Cells were resuspended and filtered in sort buffer (PBS containing 0.5% bovine serum albumin and 2mM EDTA). Isolated bead-enriched Kit+ cells were grown in 6-well plates for 2 days while undergoing spinoculation with the viral supernatant once per day by centrifugation at 350 × g for 30 minutes. GFP expression was verified by flow cytometry prior to transplantation. 5 × 10⁵ bead-enriched Kit+ cells retrovirally transduced with MPL W515L were transplanted via tail vein into CD45.1 lethally irradiated recipient mice (7 weeks old). Recipient mice were irradiated with a total of 1100 cGy, given as 2 separate doses of 550 cGy with 3-5 hours between doses. Within 3 hours of the last irradiation, mice were transplanted. For 2 weeks following transplant, the mice were caged with water containing 0.5 mg/mL Trimethoprim/sulfamethoxazole. Two weeks after transplant, PB was collected and hematologic parameters were measured by Hemavet and flow cytometry. Vehicle treatment was done with 20% 2-Hydroxypropyl-β-cyclodextrin subcutaneously and/or 5% dimethyl acetamide 0.5% methocellulose by oral gavage; pevonedistat (60 mg/kg) was administered subcutaneously and/or ruxolitinib (90 mg/kg) by oral gavage twice a day. Treatment began 2 weeks after transplant, Monday through Friday. Mice were treated for 3 weeks, PB was collected every Friday, and cells were analyzed by Hemavet. Survival was monitored daily, and moribund mice were humanely euthanized. Spleens were weighed at endpoint and normalized to mouse body weight at endpoint.
MF patient-derived xenograft (PDX) models
PBMCs from patients MF530675 and MF700869 were isolated by Ficoll gradient extraction according to standard procedures. CD34+ cells were isolated using magnetic enrichment (Miltenyi Biotec #130-100-453) and cultured overnight in SFEMII media (StemCell Technologies #09605) supplemented with Pen-Strep (50 Units/mL), human stem cell factor (SCF; 50 ng/mL), human thrombopoietin (TPO; 50 ng/mL), and human FLT3L (50 ng/mL). 1 × 10⁵ human CD34+cells were transplanted into sublethally irradiated (200 cGy) 6-9–week-old NOD-scid-Il2rg-null-3/GM/SF (NSGS; The Jackson Laboratory #013062) mice via intratibial injections (right leg) under anesthesia with an intraperitoneal injection of ketamine/xylazine mixture (2 mg per mouse; KetaVed). Four weeks after transplant, PB was collected, and engraftment was evaluated by flow cytometry. Treatment is as follows: vehicle with 20% 2-Hydroxypropyl-β-cyclodextrin subcutaneously and 5% dimethyl acetamide/0.5% methocellulose by oral gavage; pevonedistat (60 mg/kg) administered subcutaneously and/or ruxolitinib (90 mg/Kg) by oral gavage twice a day. Treatment began 4 weeks after transplant, Monday through Friday. Mice were treated for 4 weeks, PB was collected every Friday, and cells were analyzed by flow cytometry. Spleens were weighed at endpoint and normalized to mouse body weight at endpoint.
Histology
Mouse tibias were extracted at endpoint and fixed in 10% neutral buffered formalin overnight at 4°C. Post-fixation, tibias were then decalcified in 14% EDTA for 12 days and then rehydrated at 1-hour serial exposure each to 20%, 30%, 50%, and 70% ethanol. Tibias were then washed in PBS, processed for paraffin embedding, and sectioned at 5 μM. Hematoxylin and eosin (H&E) staining was performed by the Washington University Musculoskeletal Histology and Morphometry Core. Reticulin staining of BM samples was performed on Ventana BenchMark Special Stains automated slide system (Ventana Medical Systems).
Statistical analysis
Statistical significance was calculated with Prism software version 8 (GraphPad Software) utilizing a 2-tailed Student t test or Mann-Whitney U test as indicated. *P < .05, **P < .01, ***P < .001, ****P < .0001.
Results
Pevonedistat inhibits NFκB signaling in MPN cells and suppresses cancer proliferation
We first tested the efficacy of pevonedistat in vitro by treating JAK2 V617F-mutant HEL cells. Pevonedistat demonstrated greater potency and inhibited HEL cell proliferation at a lower drug concentration compared with ruxolitinib (Figure 1A). We then combined pevonedistat and ruxolitinib at multiple concentrations and, using SynergyFinder,18 observed that combination therapy led to strong synergy to inhibit cell viability (Figures 1B-C). To further understand the reduced proliferative potential, we performed cell cycle profiling on treated cells. Pevonedistat led to arrest of HEL cells in S phase, whereas ruxolitinib treatment accumulated cells in G1 phase (Figure 1D). We also performed annexin V apoptosis assays and observed a marked increase in apoptosis with pevonedistat but only mild induction with ruxolitinib (Figure 1E). NFκB target protein and gene expression induced by TNFα was inhibited by pevonedistat in HEL cells (Figures 1F-G), validating the on-target effects of pevonedistat.
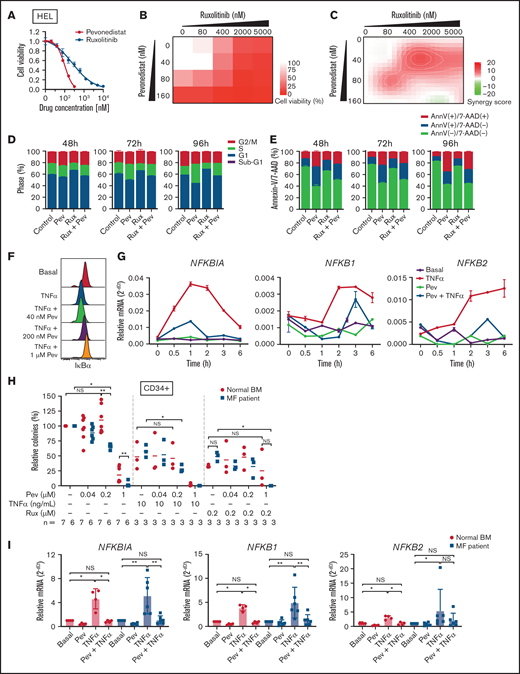
Pevonedistat suppresses TNFα-mediated NFκB signaling in MPNs. (A) Cell viability curve of JAK2 V617F mutant HEL cells treated with increasing concentrations of pevonedistat and ruxolitinib. Cells were treated for 72 hours and viability was normalized to the control treatment. Data points denote mean and standard error of mean at each drug concentration; n = 6 replicates. Cell viability measured with AlamarBlue fluorescence detection. (B) Cell viability assay of HEL cells treated with pevonedistat, ruxolitinib, or in combination. Cells were treated for 72 hours at the indicated drug concentration. Cell viability measured with AlamarBlue fluorescence detection; n = 3 replicates. (C) Synergy score calculations of pevonedistat and ruxolitinib treatment from panel B. Synergy score >10: synergistic; from −10 to 10: additive; <−10: antagonistic. (D) Cell cycle assay of HEL cells treated with DMSO control, pevonedistat (80 nM), pevonedistat (2 µM), or combination, assessed across multiple time points; n = 3 replicates. (E) Annexin V apoptosis assay of HEL cells treated with DMSO control, pevonedistat (80 nM), pevonedistat (2 µM), or combination, assessed across multiple time points; n = 3 replicates. (F) Flow cytometry of IkBα in HEL cells treated with 20 ng/mLTNFα, pevonedistat, or in combination. HEL cells were treated with pevonedistat for 2 hours and TNFα for the last 30 minutes. (G) RT-qPCR of NFκB pathway-related genes in HEL cells treated with TNFα, pevonedistat, or in combination for the indicated durations. Relative NFκB pathway-related mRNA expression was determined by 2^-dCt and normalized to ACTB. Samples were run in duplicate for each experimental condition and timepoint. (H) Colony formation assays of sorted CD34+ cells from normal BM donor and MF patient samples treated with pevonedistat, TNFα, ruxolitinib, or combinations at the indicated concentrations. 1,000 CD34+ cells were plated in MethoCult containing SCF and IL-3 in triplicate per condition. Colonies were counted after 14 days in culture. The number of patient samples (n) per condition is denoted. *P < .05; **P < .01 by Mann-Whitney U test. (I) RT-qPCR of NFκB pathway-related genes in sorted CD34+ cells from normal BM donor (n = 4) and myelofibrosis patient (n = 6) samples treated with 1 µM pevonedistat, 20 ng/mL TNFα, or in combination. CD34+ cells were treated for 4 hours. Relative NFκB pathway-related mRNA expression was determined by 2^-dCt and normalized to ACTB. *P < .05; **P < .01 by Mann-Whitney U test. NS, not significant.
Pevonedistat suppresses TNFα-mediated NFκB signaling in MPNs. (A) Cell viability curve of JAK2 V617F mutant HEL cells treated with increasing concentrations of pevonedistat and ruxolitinib. Cells were treated for 72 hours and viability was normalized to the control treatment. Data points denote mean and standard error of mean at each drug concentration; n = 6 replicates. Cell viability measured with AlamarBlue fluorescence detection. (B) Cell viability assay of HEL cells treated with pevonedistat, ruxolitinib, or in combination. Cells were treated for 72 hours at the indicated drug concentration. Cell viability measured with AlamarBlue fluorescence detection; n = 3 replicates. (C) Synergy score calculations of pevonedistat and ruxolitinib treatment from panel B. Synergy score >10: synergistic; from −10 to 10: additive; <−10: antagonistic. (D) Cell cycle assay of HEL cells treated with DMSO control, pevonedistat (80 nM), pevonedistat (2 µM), or combination, assessed across multiple time points; n = 3 replicates. (E) Annexin V apoptosis assay of HEL cells treated with DMSO control, pevonedistat (80 nM), pevonedistat (2 µM), or combination, assessed across multiple time points; n = 3 replicates. (F) Flow cytometry of IkBα in HEL cells treated with 20 ng/mLTNFα, pevonedistat, or in combination. HEL cells were treated with pevonedistat for 2 hours and TNFα for the last 30 minutes. (G) RT-qPCR of NFκB pathway-related genes in HEL cells treated with TNFα, pevonedistat, or in combination for the indicated durations. Relative NFκB pathway-related mRNA expression was determined by 2^-dCt and normalized to ACTB. Samples were run in duplicate for each experimental condition and timepoint. (H) Colony formation assays of sorted CD34+ cells from normal BM donor and MF patient samples treated with pevonedistat, TNFα, ruxolitinib, or combinations at the indicated concentrations. 1,000 CD34+ cells were plated in MethoCult containing SCF and IL-3 in triplicate per condition. Colonies were counted after 14 days in culture. The number of patient samples (n) per condition is denoted. *P < .05; **P < .01 by Mann-Whitney U test. (I) RT-qPCR of NFκB pathway-related genes in sorted CD34+ cells from normal BM donor (n = 4) and myelofibrosis patient (n = 6) samples treated with 1 µM pevonedistat, 20 ng/mL TNFα, or in combination. CD34+ cells were treated for 4 hours. Relative NFκB pathway-related mRNA expression was determined by 2^-dCt and normalized to ACTB. *P < .05; **P < .01 by Mann-Whitney U test. NS, not significant.
Next, we investigated the efficacy of pevonedistat on primary patient MF samples. In colony assays with CD34+ HSPCs, pevonedistat preferentially inhibited MF vs normal colony growth in a dose-dependent manner (Figure 1H). The addition of TNFα led to decreased colony formation from both normal and MF HSPCs, whereas a greater reduction in colonies from MF CD34+ cells was observed upon cotreatment with TNFα and 0.2 μM pevonedistat. Similarly, treatment with 0.2 μM ruxolitinib led to a partial reduction in colonies, which was augmented by cotreatment with pevonedistat. Pevonedistat also abrogated NFκB target gene expression induced by TNFα in MF patient CD34+ cells (Figure 1I). Taken together, these findings demonstrate that pevonedistat inhibits NFκB signaling and exerts MPN disease-targeting potency in vitro and across primary patient samples.
Pevonedistat and ruxolitinib alter distinct signaling pathways
Differential cell cycle and apoptotic responses in HEL cells suggested distinct inhibition profiles induced by pevonedistat and ruxolitinib. To further characterize these functional effects, we treated HEL cells for 24 hours with pevonedistat or ruxolitinib and performed RNA-seq. Pevonedistat treatment led to a substantially greater number of differentially expressed genes vs control treatment relative to ruxolitinib, and an overlap of 167 genes between pevonedistat and ruxolitinib treatments was observed (Figure 2A). We then performed GSEA and identified top Hallmark pathways altered with pevonedistat, including upregulation of TNFα signaling via NFκB, p53 pathway, and apoptosis. In contrast, ruxolitinib treatment led to a divergent profile in suppression of TNFα signaling via NFκB, in addition to expected JAK/STAT signaling pathways (Figures 2B-E). Further investigation into specific NFκB pathway regulators revealed relative upregulation of both activators and inhibitors in pevonedistat-treated samples, suggesting complex and dynamic feedback upon pathway inhibition (Figure 2F). In contrast, expression of these effectors was relatively suppressed by ruxolitinib. Pevonedistat also induced upregulation of proapoptotic effectors CDKN1A, CDKN1B, BAD, and BCL1 and downregulated antiapoptotic genes BCL2 and BCL2L1, consistent with the observed functional annexin V assay (Figure 1E). We also performed RNA-seq analysis following combination pevonedistat and ruxolitinib treatment, which demonstrated alterations in pathways observed from individual treatment and also increased inhibition of MYC targets, glycolysis, and E2F targets not observed with single agent therapy (Figure 2G). These observations highlight the nonredundant inhibition profiles of pevonedistat and ruxolitinib and show that potential for combination treatment to target additional cancer survival pathways.
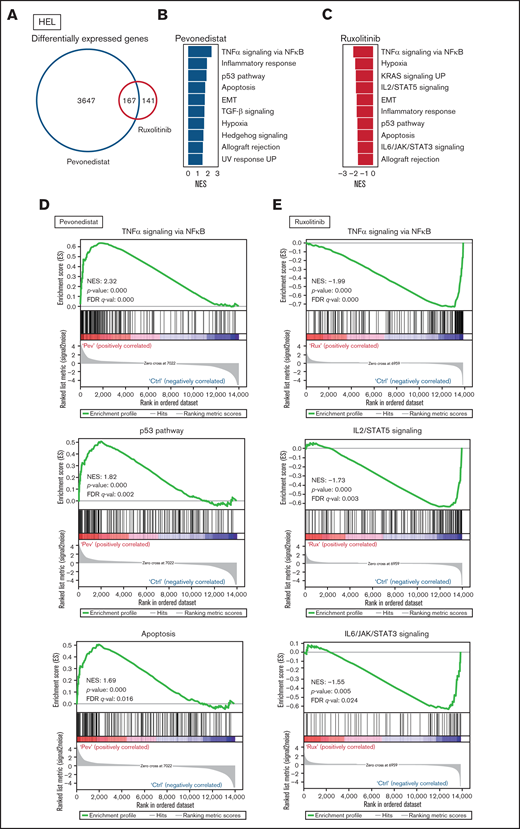
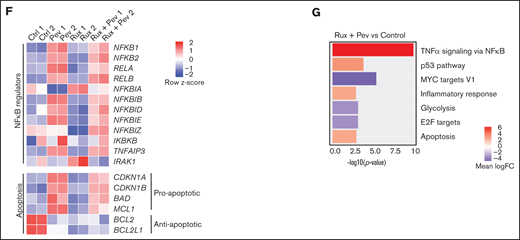
RNA-seq shows pevonedistat and ruxolitinib alter distinct signaling pathways. (A) Differentially expressed genes after ruxolitinib and pevonedistat treatment in HEL cells. Cells were treated with 1 µM pevonedistat, 0.5 µM ruxolitinib, or DMSO control for 24 hours. (B) GSEA of the top 10 altered Hallmark pathways after pevonedistat treatment from HEL RNA-seq. (C) GSEA of the top 10 altered Hallmark pathways after ruxolitinib treatment from HEL RNA-seq. (D) Enrichment scores of top altered pathways after pevonedistat treatment. Enrichment scores of top altered pathways after ruxolitinib treatment. (E) Heatmap showing key NFκB and apoptosis pathway regulators of HEL cells treated with DMSO control, pevonedistat, ruxolitinib, or combination (1 µM pevonedistat and 0.5 µM ruxolitinib for 24 hours) from RNA-seq analysis. Samples provided in duplicate and calculate values denote row z-score. (G) Top altered Hallmark pathways with GSEA after ruxolitinib and pevonedistat combination treatment from HEL RNA-seq.
RNA-seq shows pevonedistat and ruxolitinib alter distinct signaling pathways. (A) Differentially expressed genes after ruxolitinib and pevonedistat treatment in HEL cells. Cells were treated with 1 µM pevonedistat, 0.5 µM ruxolitinib, or DMSO control for 24 hours. (B) GSEA of the top 10 altered Hallmark pathways after pevonedistat treatment from HEL RNA-seq. (C) GSEA of the top 10 altered Hallmark pathways after ruxolitinib treatment from HEL RNA-seq. (D) Enrichment scores of top altered pathways after pevonedistat treatment. Enrichment scores of top altered pathways after ruxolitinib treatment. (E) Heatmap showing key NFκB and apoptosis pathway regulators of HEL cells treated with DMSO control, pevonedistat, ruxolitinib, or combination (1 µM pevonedistat and 0.5 µM ruxolitinib for 24 hours) from RNA-seq analysis. Samples provided in duplicate and calculate values denote row z-score. (G) Top altered Hallmark pathways with GSEA after ruxolitinib and pevonedistat combination treatment from HEL RNA-seq.
Mass cytometry reveals blunting of TNFα responses by pevonedistat in MF and sAML
To understand altered signaling changes induced by pevonedistat, we performed multiplex profiling using mass cytometry (CyTOF). MF patient samples were examined basally and following ex vivo incubation with pevonedistat and/or TNFα. As expected, both p-p65/RELA elevation and IκBα degradation responses to TNFα were observed in MF and sAML patient CD34+ cells, and these responses were blunted by pevonedistat (Figures 3A-E; supplemental Figures 1A-B), indicating direct suppression of the NFκB pathway. Other signaling pathways analyzed via mass cytometry were minimally affected by pevonedistat (Figure 3D). For example, cAMP response element-binding protein (CREB) phosphorylation was unaffected by pevonedistat (supplemental Figure 1C). These findings are consistent with NFκB being the primary signaling pathway impacted by pevonedistat. Nonetheless, these experiments do not exclude the possibility that pevonedistat may additionally impact pathways not examined here. Pevonedistat also potently inhibited the aberrant hyperproduction of multiple inflammatory cytokines, including TNFα, MIP-1β, IL-6, and IL-8 from MF patient cells, particularly monocytes, which we previously identified as the predominant cytokine producing population,6 more effectively than ruxolitinib (supplemental Figures 2 and 3). These findings further delineate the nonredundant effects of pevonedistat and ruxolitinib and highlight the impact of pevonedistat on suppressing the NFκB pathway and hyperactive inflammation.
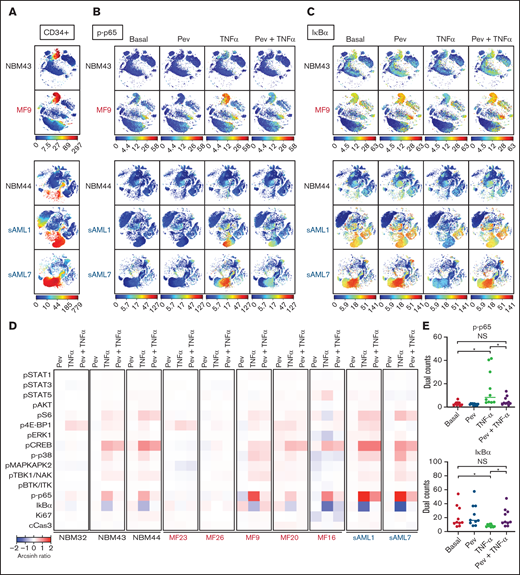
Mass cytometry reveals blunting of TNFα responses by pevonedistat in MF and sAML. (A-C) viSNE plots of healthy, normal BM donors (NBM 43, 44) and MF and sAML patient samples after signaling mass cytometry. (A) CD34+ HSPC population identified through extracellular surface staining with anti-CD34 antibody. Intracellular staining of phospho-p65/RELA (S529) (B) and IκBα (C) in patient samples treated with 1 µM pevonedistat for 1 hour, 20 ng/mL TNFα for 15 minutes, or in combination. (D) Heatmaps of signaling markers from CD34+ cells from 3 normal BM donors, 5 primary MF patients, and 2 sAML patients analyzed by mass cytometry. Cells from patient samples were treated with 1 µM pevonedistat for 1 hour, 20 ng/mL TNFα for 15 minutes, or in combination. Signals from each patient sample per treatment condition were normalized to its basal signal. (E) Dual counts of intracellular phospho-p65/RELA and IκBα from CD34+ cells from the 10 patient samples in panel D. *P < .05 by Mann-Whitney U test. NS, not significant.
Mass cytometry reveals blunting of TNFα responses by pevonedistat in MF and sAML. (A-C) viSNE plots of healthy, normal BM donors (NBM 43, 44) and MF and sAML patient samples after signaling mass cytometry. (A) CD34+ HSPC population identified through extracellular surface staining with anti-CD34 antibody. Intracellular staining of phospho-p65/RELA (S529) (B) and IκBα (C) in patient samples treated with 1 µM pevonedistat for 1 hour, 20 ng/mL TNFα for 15 minutes, or in combination. (D) Heatmaps of signaling markers from CD34+ cells from 3 normal BM donors, 5 primary MF patients, and 2 sAML patients analyzed by mass cytometry. Cells from patient samples were treated with 1 µM pevonedistat for 1 hour, 20 ng/mL TNFα for 15 minutes, or in combination. Signals from each patient sample per treatment condition were normalized to its basal signal. (E) Dual counts of intracellular phospho-p65/RELA and IκBα from CD34+ cells from the 10 patient samples in panel D. *P < .05 by Mann-Whitney U test. NS, not significant.
Pevonedistat alone or in combination with ruxolitinib potently alleviates disease burden across multiple MPN and sAML mouse models
To test the efficacy of pevonedistat in vivo, we used the Jak2 V617F knock-in mouse model,19 which recapitulates features of polycythemia vera. Following stable engraftment, mice transplanted with Kit+ cells from Jak2 V617F knock-in mice were treated with pevonedistat and/or ruxolitinib or vehicle for 4 weeks. As expected, increases in white blood cells (WBCs), hematocrit, and platelets were observed over time. (Figures 4A-C). A trend toward WBC count reduction was observed with pevonedistat alone, with a significant reduction observed with pevonedistat and ruxolitinib combination treatment (Figure 4A). Furthermore, combination treatment inhibited BM engraftment of CD45.2 cells (Figure 4D) and demonstrated a trend toward decreased splenomegaly (Figure 4E). H&E staining of mouse BM at endpoint revealed a reduction in megakaryocyte hyperplasia that was particularly evident with combination treatment (Figure 4F).
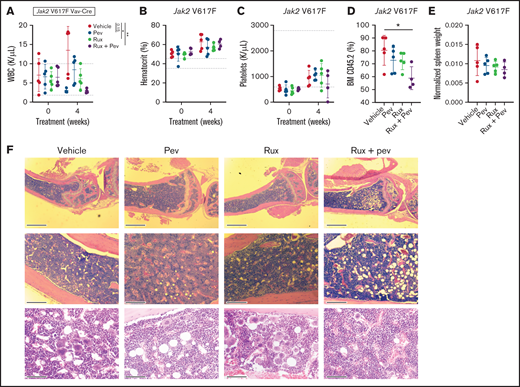
Pevonedistat and ruxolitinib combination treatment is efficacious in the Jak2 V617F mouse model of polycythemia vera. (A-D) Cellular measurements of Jak2 transplanted mice (n = 5 for each group) after 4-week treatment with pevonedistat (60 mg/kg), ruxolitinib (90 mg/kg), or combination. White blood cells (A); hematocrit (B); platelets (C); and BM CD45.2+ cells (D). *P < .05; **P < .01; ***P < .001 by 1-way analysis of variance (ANOVA) with Dunnett’s multiple comparisons test. (E) Normalized spleen weights of mice at endpoint. (F) Representative H&E staining of tibia sections from treated mice at endpoint. Scale bar: 1 mm (top), 0.25 mm (middle), and 80 µm (bottom).
Pevonedistat and ruxolitinib combination treatment is efficacious in the Jak2 V617F mouse model of polycythemia vera. (A-D) Cellular measurements of Jak2 transplanted mice (n = 5 for each group) after 4-week treatment with pevonedistat (60 mg/kg), ruxolitinib (90 mg/kg), or combination. White blood cells (A); hematocrit (B); platelets (C); and BM CD45.2+ cells (D). *P < .05; **P < .01; ***P < .001 by 1-way analysis of variance (ANOVA) with Dunnett’s multiple comparisons test. (E) Normalized spleen weights of mice at endpoint. (F) Representative H&E staining of tibia sections from treated mice at endpoint. Scale bar: 1 mm (top), 0.25 mm (middle), and 80 µm (bottom).
Next, BALB/c mice transplanted with Ba/F3-MPLW515L-GFP cells were treated with either vehicle or pevonedistat. Mice receiving vehicle exhibited a rapid increase in PB GFP+ cells (supplemental Figures 4A-B). By day 15, vehicle-treated mice were moribund, whereas all pevonedistat-treated mice remained viable (supplemental Figure 4C). BM GFP+ cells were markedly higher in vehicle (23.99%) vs pevonedistat (0.23%) groups (supplemental Figure 4D). Animals receiving vehicle exhibited hepatosplenomegaly, with spleen and liver mean weights of 788 mg and 1871 mg, respectively, compared with 127 mg and 1021 mg for pevonedistat-treated animals (supplemental Figures 4E-H).
We also adopted the MPL W515L retroviral transplant model, which produces a phenotype resembling myelofibrosis indicated by heightened leukocytosis, BM fibrosis, and early lethality.20 Kit+ cells from CD45.2 mice were transduced with MPL W515L retrovirus and transplanted into lethally-irradiated CD45.1 recipient mice, and mice were treated with pevonedistat and/or ruxolitinib. As expected, striking elevation of WBC and platelets, in addition to markedly increased spleen weights, were observed in vehicle-treated mice (Figures 5A-D). In contrast, progressive development of these MPN disease features was largely absent in mice treated with pevonedistat alone or in combination with ruxolitinib. Notably, treatment with pevonedistat did not induced anemia. Consequently, treated mice exhibited prolonged survival compared with vehicle mice (Figure 5E). H&E and reticulin staining of mouse BM at endpoint revealed marked fibrosis and megakaryocyte hyperplasia in vehicle mice, which was reduced by pevonedistat and combination but not with ruxolitinib treatment alone (Figure 5F). Thus, pevonedistat treatment alone or in combination demonstrates efficacy in reducing disease burden across PV and MF mouse models.
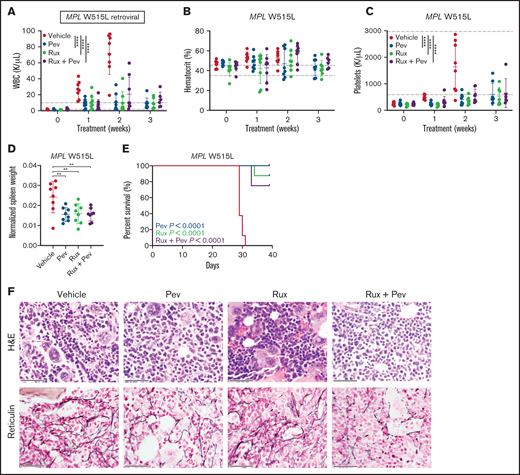
Pevonedistat reduces disease burden and prolongs survival in the MPL W515L mouse model of myelofibrosis. (A-C) Cellular measurements of MPL W515L transplanted mice (n = 8 for each group) after treatment with pevonedistat (60 mg/kg), ruxolitinib (90 mg/kg), or combination. White blood cells (A); hematocrit (B); and platelets (C). **P < .01; ***P < .001; ****P < .0001 by 2-way ANOVA with Dunnett’s multiple comparisons test. (D) Normalized spleen weights of mice at endpoint. **P < .01; ***P < .001 by 1-way ANOVA with Dunnett’s multiple comparisons test. (E) Kaplan-Meier survival curve of MPL W515L mice with log-rank P statistics. (F) Representative H&E and reticulin immunohistochemistry staining of BM from mouse tibias at endpoint. Scale bar: 40 µm.
Pevonedistat reduces disease burden and prolongs survival in the MPL W515L mouse model of myelofibrosis. (A-C) Cellular measurements of MPL W515L transplanted mice (n = 8 for each group) after treatment with pevonedistat (60 mg/kg), ruxolitinib (90 mg/kg), or combination. White blood cells (A); hematocrit (B); and platelets (C). **P < .01; ***P < .001; ****P < .0001 by 2-way ANOVA with Dunnett’s multiple comparisons test. (D) Normalized spleen weights of mice at endpoint. **P < .01; ***P < .001 by 1-way ANOVA with Dunnett’s multiple comparisons test. (E) Kaplan-Meier survival curve of MPL W515L mice with log-rank P statistics. (F) Representative H&E and reticulin immunohistochemistry staining of BM from mouse tibias at endpoint. Scale bar: 40 µm.
Lastly, we adopted patient-derived xenograft (PDX) humanized mouse models, which we have previously demonstrated to maintain patient genetic hierarchy and disease features.21-23 Purified CD34+ cells from 2 unique MF patients were transplanted into NSGS mice, and treatment with pevonedistat alone or in combination with ruxolitinib was initiated following confirmation of successful engraftment. For PDX1 (patient MF530675), PB hCD45+ cell engraftment was inhibited by pevonedistat or ruxolitinib monotherapy, with combination treatment being superior to ruxolitnib alone (Figure 6A). Notably, BM hCD45+ cell engraftment was reduced by pevonedistat or combination treatment but not by ruxolitinib alone (Figure 6B). Combination treatment also resulted in the strongest suppression of PB hCD45+ myeloid cells (Figure 6C), CD45- BM erythroid cells (Figure 6D), and spleen weight (Figure 6E). Consistent with PDX1, in PDX2 (patient MF700869) we observed potent suppression of PB hCD45+cell engraftment by pevonedistat or ruxolitinib monotherapy, and the strongest suppression was with combination treatment (Figure 6F). Similarly, BM hCD45+ cell engraftment was effectively abrogated by pevonedistat and/or ruxolitinib treatment (Figure 6G). Finally, spleen weights were significantly reduced by treatment with pevonedistat alone or in combination with ruxolitinib (Figure 6H). These findings collectively demonstrate efficacy of pevonedistat across humanized MPN mouse models.
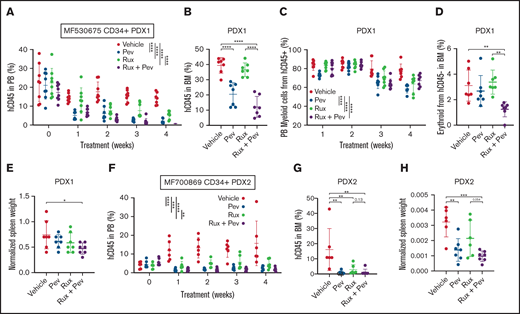
Pevonedistat diminishes CD34+ engraftment and disease propagation in humanized patient-derived xenograft mouse models. (A) Percentage of hCD45+ cells in the PB of NSGS mice engrafted with CD34+ cells from MF530675 and after treatment with pevonedistat (60 mg/kg), ruxolitinib (90 mg/kg), or combination; n = 8 in all groups. ****P < .0001 by 2-way ANOVA with Dunnett’s multiple comparisons test. (B) Percentage of hCD45+ cells in the BM of NSGS mice across multiple weeks of treatment. ****P < .0001 by 1-way ANOVA with Dunnett’s multiple comparisons test. (C) Percentage of myeloid cells from hCD45+ cells. **P < .01; ***P < .001; ****P < .0001 by 2-way ANOVA with Dunnett’s multiple comparisons test. (D) Percentage of erythroid cells from hCD45-cells in the BM. **P < .01 by 1-way ANOVA with Dunnett’s multiple comparisons test. (E) Normalized spleen weight at endpoint. *P < .05 by 1-way ANOVA with Dunnett’s multiple comparisons test. (F) Percentage of hCD45+cells in the PB of NSGS mice engrafted with CD34+ cells from a second patient MF700869 and after treatment with pevonedistat (60 mg/kg), ruxolitinib (90 mg/kg), or combination; n = 6 (vehicle and ruxolitinib) and 7 (pevonedistat and combination). **P < .01; ***P < .001; ****P < .0001 by 2-way ANOVA with Dunnett’s multiple comparisons test. (G) Percentage of hCD45+ cells in the BM of NSGS mice across multiple weeks of treatment. **P < .01 by 1-way ANOVA with Dunnett’s multiple comparisons test. (H) Normalized spleen weight at endpoint. **P < .01; ***P < .001 by 1-way ANOVA with Dunnett’s multiple comparisons test.
Pevonedistat diminishes CD34+ engraftment and disease propagation in humanized patient-derived xenograft mouse models. (A) Percentage of hCD45+ cells in the PB of NSGS mice engrafted with CD34+ cells from MF530675 and after treatment with pevonedistat (60 mg/kg), ruxolitinib (90 mg/kg), or combination; n = 8 in all groups. ****P < .0001 by 2-way ANOVA with Dunnett’s multiple comparisons test. (B) Percentage of hCD45+ cells in the BM of NSGS mice across multiple weeks of treatment. ****P < .0001 by 1-way ANOVA with Dunnett’s multiple comparisons test. (C) Percentage of myeloid cells from hCD45+ cells. **P < .01; ***P < .001; ****P < .0001 by 2-way ANOVA with Dunnett’s multiple comparisons test. (D) Percentage of erythroid cells from hCD45-cells in the BM. **P < .01 by 1-way ANOVA with Dunnett’s multiple comparisons test. (E) Normalized spleen weight at endpoint. *P < .05 by 1-way ANOVA with Dunnett’s multiple comparisons test. (F) Percentage of hCD45+cells in the PB of NSGS mice engrafted with CD34+ cells from a second patient MF700869 and after treatment with pevonedistat (60 mg/kg), ruxolitinib (90 mg/kg), or combination; n = 6 (vehicle and ruxolitinib) and 7 (pevonedistat and combination). **P < .01; ***P < .001; ****P < .0001 by 2-way ANOVA with Dunnett’s multiple comparisons test. (G) Percentage of hCD45+ cells in the BM of NSGS mice across multiple weeks of treatment. **P < .01 by 1-way ANOVA with Dunnett’s multiple comparisons test. (H) Normalized spleen weight at endpoint. **P < .01; ***P < .001 by 1-way ANOVA with Dunnett’s multiple comparisons test.
Discussion
Our group previously demonstrated that MF and sAML patients frequently harbor hyperactive NFκB signaling that is not rectified by ruxolitinib treatment.5,6 In this study, pevonedistat was found to suppress growth of JAK2-mutant HEL cells and to inhibit colony formation from MF patient HSPCs differentially vs normal BM HSPCs. Gene expression and mass cytometry analysis demonstrated specificity of pevonedistat for NFκB inhibition among intracellular signals activated by TNFα. Pevonedistat was also found to potently inhibit production of inflammatory cytokines from monocytes. In addition, pevonedistat treatment significantly decreased disease burden and improved survival across MPN mouse and humanized PDX models. Taken together, our observations are consistent with the notion that pevonedistat acts via both cell autonomous (ie, directly against MPN HSPCs) and cell nonautonomous (ie, inhibition of cytokine production in monocytes) mechanisms to ameliorate MPN disease phenotypes.
These findings indicate that pevonedistat can counteract several pathophysiologic parameters observed in MF and sAML patient cells ex vivo and in relevant MPN mouse models in a manner that is nonredundant with observed effects of ruxolitinib. Indeed, our functional and transcriptome profiling after pevonedistat treatment demonstrated upregulation of p53 pathways and strong induction of apoptosis. Notably, these survival pathways were not significantly altered by 24 hours of ruxolitinib treatment; however, TNFα signaling via NFκB pathway was downregulated by GSEA of RNA-seq data. In contrast, in our previous studies, 1-hour ruxolitinib treatment led to little to no reduction in p-p65 or IκBα in MF and sAML samples but sufficiently suppressed JAK-STAT signaling, whereas here, 1-hour pevonedistat treatment potently inhibited TNFα-induced activation of the NFκB pathway. These observations likely reflect dynamic feedback regulation and suggest that the impact of ruxolitinib on NFκB signaling may be more indirect compared with pevonedistat, occurring via regulation at the transcriptional level, supported by the role of STATs as canonical transcription factors. Another study utilizing transplanted MPL W515L cells with an NFκB reporter in vivo showed partial inhibition of NFκB activity following 3 days of treatment with ruxolitinib. Combination treatment with the BET inhibitor JQ-1 further suppressed NFκB pathway activation, consistent with incomplete inhibition of NFκB activity by ruxolitinib.24
Cotargeting of signaling mediated by JAK2 and NFκB could thus provide enhanced therapeutic benefit. Our RNA-seq analysis of pevonedistat and ruxolitinib combination revealed suppression of additional signaling pathways not observed with single treatment alone. Furthermore, combination treatment was more efficacious compared with single therapy in reducing disease burden, pathogenic fibrosis, and CD34+ engraftment across multiple MPN and MF PDX models. Based on this hypothesis and supported by these promising results, our group has initiated a Phase 1 clinical trial, combining pevonedistat with ruxolitinib for MF treatment (NCT03386214). Although ruxolitinib remains a valuable option for many MF patients, there remains an unmet need for treatments that counteracts disease progression and reduces malignant clonal burden, in addition to improving patient symptoms. The studies presented here provide a rationale for targeting NFκB signaling via pevonedistat as a therapeutic modality for MF treatment.
Acknowledgments
The authors thank K. Luber and M. Allen for assistance with patient samples, C. Holley and the staff of the Alvin J Siteman Cancer Center Flow Cytometry Core for assistance with cell sorting, and O. Malkova, C. Miner, R. Lin, and R. Betz for assistance with mass cytometry experiments. The authors are grateful to Ann Mullally for providing Jak2 V617F knock-in mice. They thank R. Lin and S. Snyder for assistance with pevonedistat solutions for treating mice. They also thank A. Berger (Takeda Pharmaceuticals) for advice on pevonedistat mouse dosing. Pevonedistat was provided by Takeda Pharmaceuticals.
This work was supported by NIH grants K08HL106576 (S.T.O.), R01HL134952 (S.T.O.), T32HL007088 (T.B.C.), and R01HL147978 (G.A.C.). This work was also supported by a Doris Duke-Damon Runyon Clinical Investigator Award (S.T.O.) and a Challenge Grant from the MPN Research Foundation (S.T.O.). G.A.C. is a scholar of the Leukemia and Lymphoma Society. Technical support was provided by the Alvin J. Siteman Cancer Center Tissue Procurement Core Facility, Flow Cytometry Core, and Immunomonitoring Laboratory, which are supported by NCI Cancer Center Support Grant P30CA91842. The Immunomonitoring Laboratory is also supported by the Andrew M and Jane M Bursky Center for Human Immunology and Immunotherapy Programs.
Authorship
Contribution: T.K., A.B.A.L, T.B.C., D.A.C.F., and S.T.O. designed research; T.K., A.B.A.L., T.B.C., E.S.D.T., A.J.W., M.C.F., and D.A.C.F. performed experiments; T.K., A.B.A.L., T.B.C., E.S.D.T., A.J.W., M.C.F., and D.A.C.F. analyzed data; M.R. performed pathological assessment of MPL W515L retroviral transplant model; H.C. and G.A.C. provided technical expertise; T.K., A.B.A.L., T.B.C., D.A.C.F., and S.T.O wrote the manuscript; and all authors edited and approved the manuscript.
Conflict-of-interest disclosure: S.T.O. has served as a consultant for Incyte, Gilead Sciences, Novartis, Celgene/Bristol Myers Squibb, Blueprint Medicines, Kartos Therapeutics, Disc Medicine, and CTI BioPharma. The remaining authors declare no competing financial interests.
Correspondence: Stephen T. Oh, Division of Hematology, Department of Medicine, Campus Box 8125, Washington University School of Medicine, St. Louis, MO 63110; e-mail: stoh@wustl.edu.

