

Key Points
Biomarker panels at GVHD onset, independently from clinical parameters, were associated with survival and nonrelapse mortality.
Using 3 different biostatistical tools, biomarkers only slightly improved prediction over clinical parameters.

Abstract
Acute graft-versus-host disease (GVHD) is still the major contributor to comorbidities and mortality after allogeneic hematopoietic stem cell transplantation. The use of plasmatic biomarkers to predict early outcomes has been advocated in the past decade. The purpose of this prospective noninterventional study was to test the ability of panels including 7 biomarkers (Elafin, HGF, IL2RA, IL8, REG3, ST2, and TNFRI), to predict day 28 (D28) complete response to steroid, D180 overall survival, and D180 nonrelapse mortality (NRM). Using previous algorithms developed by the Ann Arbor/MAGIC consortium, 204 patients with acute GVHD were prospectively included and biomarkers were measured at GVHD onset for all of them. Initial GVHD grade and bilirubin level were significantly associated with all those outcomes. After adjustment on clinical variables, biomarkers were associated with survival and NRM. In addition to clinical variables, biomarkers slightly improved the prediction of overall survival and NRM (concordance and net reclassification indexes). The potential benefit of adding biomarkers panel to clinical parameters was also investigated by decision curve analyses. The benefit of adding biomarkers to clinical parameters was however marginal for the D28 nonresponse and mortality endpoints.
Introduction
Hematopoietic stem cell transplantation (HSCT) remains the only curative treatment for many hematological diseases. HSCT’s efficacy relies on its immune effect against the hematological malignancy referred as the graft-versus-leukemia effect. Unfortunately, this graft-versus-leukemia is also closely related to acute graft-versus-host disease (GVHD), which induces tissue damage, immune defect, and eventually mortality. Acute GVHD occurs in approximately 50% of patients. Age, type of donor, sex, and HLA matching between donor and recipient, type of regimen, and GVHD prophylaxis influence the risk of acute GVHD. Clinical and histological grades of acute GVHD are predictive for outcome.1-5 Acute GVHD first-line therapy usually consists of high-dose corticosteroids. Unfortunately, up to 50% of patients will not achieve a sustainable complete remission (CR) with steroids and will be at higher risk of mortality. The main risk factor of GVHD-related mortality is the nonresponsiveness to steroids,6 but response is obviously unknown at GVHD onset. Finding biomarkers able to better predict acute GVHD severity and response to corticosteroids would thus be highly useful to personalize patient management.
Candidate biomarkers associated with GVHD severity at disease onset have been previously reported (reviewed in Chen and Zeiser7 and Adom et al8 ). Most of these biomarkers are cytokines or their soluble receptors, chemokines, growth factors, angiogenic factors, or molecules involved in inflammation. Some biomarkers are specifically associated with a GVHD target organ (skin, liver, or gut). Biomarker performances have been evaluated either separately, as composite panels, or as algorithms. Our group previously reported that fecal calprotectin was significantly associated with steroid-refractory gut GVHD and mortality9 with a C-index discrimination of 0.86 for a clinico-biologic score that included calprotectin, α-1 antitrypsin, and GVHD grade.
However, American investigators at Ann Arbor have sequentially reported for more than a decade plasma biomarkers related to skin GVHD (Elafin or trappin10 ), gastrointestinal GVHD (regenerating islet-derived 3 α [REG3α]11,12 ), liver GVHD (hepatocyte growth factor [HGF]12 ), or different combinations of biomarkers.13-21 Specifically, these authors reported that 7 molecules could be potent GVHD biomarkers: Elafin, HGF, interleukin-2 receptor α (IL-2RA), IL-8 (CXCL8), REG3α, tumor necrosis factor α receptor-1 (TNFRI), and suppression of tumorigenicity 2 (ST2, the IL33 receptor). These 7 markers have been extensively studied in panels of 2, 3, 4, or 6 biomarkers or alone for ST2.14-19 Some of these panels have been internally or externally validated, usually using the same laboratory for biomarkers assays. External validations have been performed on different cohorts, but biomarkers assays have always been performed by authors who described seminal discoveries. Thus, our study is an external validation by independent investigators. Furthermore, it is worth noting that the time of measurement of these biomarkers varied significantly between these studies. Indeed, in what authors refers as panel 2 that includes ST2 and REG3α, which has been elegantly validated in a large international consortium, sampling was done 7 days after GVHD treatment initiation,14 whereas this same panel was also studied on samples taken 7 days after HSCT in another study.15 Panels including the 3, 4, and 6 biomarkers and ST2 have been tested on samples at GVHD diagnosis. All these panels are reported to predict GVHD prognosis and mortality. Finally, most recently, a randomized multicenter trial even used Ann Arbor biomarker status panel 2 to risk-stratify patients.22
We conducted a prospective single-center study to assess the prognostic value of plasmatic biomarkers using a single-center French population and local assays to analyze biomarkers. The 7 biomarkers Elafin, HGF, IL-2RA, IL-8, REG3, ST2, and TNFRI were measured at onset of GVHD, before corticosteroid initiation. The risks of noncomplete response to steroids, nonrelapse mortality (NRM), and mortality were tested for ST2 alone and for 4 previously described panels, and the additive value of biomarkers to clinical variables was tested.
Methods
Population and definitions
In this study, consecutive adult patients who agreed for the prospective protocol “plasma-inca” and signed the inform consent form were included between 2013 and 2016. The protocol was registered at www.clinicaltrials.com with the number NCT02254798 and was approved by ethics committee Ile de France IV (institutional review board 00003835). The protocol was supported by 2 national grants related to the “Agence de la Biomédecine” (AOR 2015) and the “Programme de Recherche Translationnelle en Cancérologie” (PRTC2013). All patients had weekly plasma collection until week 7 and, at acute GVHD onset, if any, and clinical symptoms of GVHD were prospectively collected. The current study focuses on the 204/304 patients who developed acute GVHD requiring systemic high-dose steroid (≥1 mg/kg). Patients with acute GVHD were a median of age 45 years and were mostly transplanted for acute leukemia, myelodysplastic syndrome, or myeloproliferative neoplasm (n = 146, 71%). Most patients (64%) presented with an intermediate Disease Risk Index scores.23 Sixty patients (29%) were transplanted from an HLA-matched sibling and 136 patients (67%) from an unrelated donor, including 43 HLA-mismatched donors. Peripheral blood stem cells were the sources of stem cells in 162 patients (79%). GVHD prophylaxis was either cyclosporine and methotrexate (57%) or cyclosporine and mycophenolate mofetil (43%). Supplemental Table 1 shows details on patient, disease, and transplant characteristics. Acute GVHD was classified according to the modified Glucksberg criteria.24 CR to first-line therapy (steroids) was assessed at day 28 after treatment. The study received institutional review board approval from the Comité d'éthique Paris IV and was conducted according to the Declaration of Helsinki.
Cytokines assays
Blood samples were collected into ethylene-diamine tetra-acetic acid tubes. Plasma was separated from blood cells within 2 hours after blood collection by 2 successive centrifugations and were immediately frozen at −80°C. Biomarkers Elafin, HGF, IL-2RA, IL-8, ST2, and TNFRI were measured simultaneously in a multiplex magnetic Luminex Assay (reference LXSAHM) from R&D Systems, whereas REG3 was measured by an enzyme-linked immunosorbent assay from MBL (reference 5323). Each sample was tested in duplicate for each cytokine. Luminex assays were read on a BioPlex MAGPIX Multiplex Reader from BioRad and enzyme-linked immunosorbent assays on a Biotek microplate reader. All assays were performed according to the manufacturers’ instructions. Cytokines and panels tested are reported in Table 1.
Cytokines and panels tested
| Name | Cytokines | Formula | Cutoff |
|---|---|---|---|
| ST219 | ST2 | — | Q3* |
| Panel-215 | ST2, REG3α | log[–log(1 – p)] = –11.263 + 1.844 × log10(ST2) + 0.577 × log10(REG3α) | P = .20 |
| Panel-316 | ST2, REG3α, TNFR1 | log[–log(1 – p)] = −9.169 + 0.598 × log2(TNFR1) −0.028 × log2(REG3α) + 0.189 × log2(ST2) | Q3*,† |
| Panel-418 | IL-2Rα, TNFR1, HGF, IL-8 | −4656 + 3.43 × IL-2Rα + 0.48 × TNFR1+ 0.11 × HGF –0.45 × IL-8 | Q3*,‡ |
| Panel-617 | Elafin, IL-2Rα, TNFR1, HGF, IL-8, REG3α | 0.31 × log(elafin) + 0.13 × log(IL-2Rα) + 0.80 × log(TNFR1) + 0.20 × log(IL-8) + 0.02 × log(HGF) + 0.19 × log(REG3α) | 12.8 |
Third quartile.
In the original publication, 2 cutoffs at P = .4 and P = .66 were used, but in the current data, values of P were > .66.
In the original publication, the panel score was 1000 times the linear combination presented, then back-transformed on a probability scale through reverse logit, but in the current data the range of values obtains makes it impossible for most observations.
Statistical analysis
Data are described as count and percent for categorical variables and median and interquartile range (IQR) for quantitative variables. ST2 and panels were classified as “high” or “low” (Table 1). For panels 2 and 6, the observed values were identical to the original publications and we used the published cutoff. For ST2, panel 3 and panel 4, the distributions of values were different from the original publications; the third quartile was thus chosen as the cutoff discriminating patients with low or high panels (supplemental Figure 1). Because dichotomizing continuous variables is known to result in a loss of information, we added an analysis in which biomarker panels were analyzed on their original linear predictor scale without dichotomization.
Nonresponse at day 28 (D28) after steroids initiation (ie, not meeting CR criteria at that time) was analyzed as a binary variable and adjusted (multivariable) analyses were performed using logistic regression. This is similar to analyzing CR but allows the presentation of association measures similarly to the other outcomes and an odds ratio >1, indicating a factor associated with unfavorable outcome. Overall survival up to D180 was analyzed using Kaplan-Meier estimator and Cox models. The cumulative incidence of NRM up to D180 was estimated and the association of variables analyzed using cause-specific Cox models, with relapse as a competing risk. Because the aim was to evaluate the clinical utility of biomarkers panels for patients with acute GVHD and to avoid overfitting, a set of clinical predictors was predetermined (initial liver GVHD, acute GVHD grade 3, and age older than 50 years), and we checked that they were associated with nonresponse at D28 in a multivariable logistic model. Adding 2 × 2 interactions between those 3 variables showed that the effects of age and the 2 other variables were not additive. Based on the observed regression coefficients, we simplified the clinical model and considered as high-risk patients with initial liver GVHD, or those aged older than 50 years, or with initial grade 3 GVHD. Because the only data-driven part of this score building was the grouping of combination of variables but not the coefficients or variable selection based on statistical testing, we considered that this would entail minimal optimism or risk of overfitting. The ability of clinical variables and biomarkers to predict outcomes was evaluated by the concordance (C) index. The C-index quantifies how well a marker or a model discriminates between patients with the event of interest and the others. For binary outcomes, it is equal to the area under the receiver operating characteristic curve, and for survival data, it can be viewed as its extension to the censored data setting. It varies from 0.5 to 1, where 0.5 indicates no better discrimination than would be obtained at random, and 1 perfect discrimination. For NRM, the competing risks version of the C-index was used.25
To quantify the additional value of biomarker panels compared with the clinical model, we computed the difference in C-index, as well as the category-less (or continuous) net reclassification index (NRIc).26 In both cases, 95% confidence intervals (CI) were computed by bootstrapping, as recommended.27 A lower confidence bound >0 would confirm that a biomarker panel adds additional value for predicting the outcome, compared with a simplified clinical model. Further, we also used decision curves analysis (DCA) to assess the incremental value of using the biomarker panels for medical decision making.28,29 Briefly, decision curves are a graphical summary of the net benefit of using a risk prediction model for decision, weighing the expected benefit of a possible intervention or treatment for patients correctly identified as high risk with the costs or harms (in a general sense) associated with a false-positive decision. The relative weights of benefits and costs are reflected by the decision threshold on the probability scale.
Analyses were performed using the R software version 4.0.5 (The R Foundation for Statistical Computing, Vienna, Austria). Packages used included pec to compute C-indexes for censored and competing risks data, nricens for NRIc and censored data, and rmda for decision curve analyses.
Results
Acute GVHD
Acute GVHD occurred in median 24 days (IQR: 15-36) after transplantation. At steroid initiation, patients had grade 1, 2, and 3 in 27 (13%), 116 (57%), and 61 (30%) cases, respectively. Skin, gut, and liver were involved in 169 (83%), 156 (76%), and 31(15%) patients. Maximal grade 1, 2, 3, and 4 was observed in 19 (9%), 62 (30%), 95 (47%), and 28 (14%) patients, respectively (supplemental Methods; supplemental Table 2). GVHD diagnosis was associated with concomitant fever in 91 (46%) patients: 48 in grade 1-2 and 43 in grade 3. Median albuminemia level was 35 g/L (IQR: 32-39) and median protidemia was 59 g/L (IQR: 55-64) at time of GVHD diagnosis. Gut biopsies were performed in 83 patients with gut involvement, confirming specific signs of GVHD in 76 patients (92%).
Outcome
Association of clinical variables on outcome.
Table 2 shows the incidences of D28 nonresponse, D180 overall survival (OS), and D180 NRM: 32% (95% CI, 26-39), 79% (95% CI, 74-85), and 16% (95% CI, 11-21), respectively. Causes of nonrelapse death were attributed to GVHD in the majority of patients (supplemental Table 3). Univariate analysis shows that all 3 outcomes (nonresponse, OS, and NRM) were better in patients with initial grade 1-2 GVHD or without initial liver involvement (supplemental Table 4). Fever increased the risks of D28 nonresponse and D180 NRM. Age ≥50 years increased the risk of D28 nonresponse and decreased D180 OS. A transplantation from an unrelated donor increased the risk of D180 NRM. Multivariable analyses (MVA) showed that an initial grade 3 GVHD, age ≥50 years, and initial liver involvement increased the risk of D28 nonresponse (Table 3). MVA also showed that initial grade 3 and initial liver involvement were both significantly associated with OS and NRM (Table 3). Cumulative incidences of complete response and NRM, and of OS are given for the clinical score (considering significant clinical variables of the MVA) in Table 2, Figure 1A, and supplemental Tables 2A and 3 A. The proportions of patients not in CR at D28 were 93%, 40%, 27%, and 16% with 3, 2, 1, or 0 clinical risk factors, respectively. OS was 43% with 3 risk factors vs 94% and 82% when none or 1 risk was present, respectively. NRM was 57% with the 3 clinical risk factors vs 2% or 12%, when none or 1 risk factor was present, respectively.
Outcome of patients with acute GVHD according to clinical or biological markers
| Day 28 nonresponse | Day 180 survival | Day 180 nonrelapse mortality | |||||
|---|---|---|---|---|---|---|---|
| Variable | N | No. | Estimate (95% CI) | No.* | Estimate (95% CI) | No. | Estimate (95% CI) |
| All patients | 204 | 66 | 32% (26-39) | 43 | 79% (74-85) | 32 | 16% (11-21) |
| Initial liver GVHD | |||||||
| No | 171 | 41 | 24% (18-31) | 22 | 87% (82-92) | 13 | 8% (4-12) |
| Yes | 33 | 25 | 76% (58-89) | 21 | 36% (23-57) | 19 | 58% (39-73) |
| Acute GVHD initial grade | |||||||
| 1–2 | 143 | 34 | 24% (17-32) | 19 | 87% (81-92) | 11 | 8% (4-13) |
| 3 | 61 | 32 | 52% (39-65) | 24 | 61% (50-74) | 21 | 34% (23-46) |
| Age | |||||||
| <50 y | 115 | 29 | 25% (18-34) | 18 | 87% (81-92) | 14 | 12% (7-19) |
| ≥50 y | 89 | 37 | 42% (31-53) | 25 | 61% (50-74) | 18 | 20% (13-29) |
| Fever | |||||||
| Yes | 91 | 38 | 42% (32-53) | 24 | 74% (65-83) | 11 | 10% (5-16) |
| No | 113 | 28 | 25% (17-34) | 19 | 83% (77-90) | 21 | 23% (15-32) |
| No. of clinical variables† | |||||||
| 0 | 49 | 8 | 16% (7-30) | 3 | 94% (87-100) | 1 | 2% (0-25) |
| 1 | 83 | 22 | 27% (17-37) | 15 | 82% (74-91) | 10 | 12% (6-20) |
| 2 | 58 | 23 | 40% (27-53) | 17 | 71% (60-83) | 13 | 22% (13-34) |
| 3 | 14 | 13 | 93% (66->99) | 8 | 43% (23-78) | 8 | 57% (27-79) |
| ST2 | |||||||
| High | 51 | 25 | 49% (35-63) | 22 | 57% (45-72) | 19 | 37% (24-50) |
| Low | 153 | 41 | 27% (20-35) | 21 | 86% (81-92) | 13 | 8% (5-14) |
| Panel 2 | |||||||
| High | 73 | 30 | 41% (30-53) | 28 | 62% (51-74) | 22 | 30% (20-41) |
| Low | 131 | 36 | 27% (20-36) | 15 | 89% (83-94) | 10 | 8% (4-13) |
| Panel 3 | |||||||
| High | 51 | 26 | 51% (37-65) | 22 | 57% (45-72) | 20 | 39% (26-52) |
| Low | 153 | 40 | 26% (19-34) | 11 | 86% (81-92) | 12 | 8% (4-13) |
| Panel 4 | |||||||
| High | 51 | 28 | 55% (40-69) | 22 | 57% (45-72) | 19 | 37% (24-50) |
| Low | 153 | 38 | 25% (18-32) | 21 | 86% (81-92) | 13 | 8% (5-14) |
| Panel 6 | |||||||
| High | 85 | 38 | 45% (34-56) | 30 | 65% (55-76) | 26 | 31% (21-41) |
| Low | 119 | 28 | 24% (16-32) | 13 | 89% (84-95) | 6 | 5% (2-10) |
Number of deaths by day 180.
Clinical variables considered were initial liver GVHD, age 50 years or more, and initial GVHD grade 3.
Multivariable models for clinical risk factors
| Day 28 nonresponse | Day 180 survival | Day 180 nonrelapse mortality | ||||
|---|---|---|---|---|---|---|
| Variable | OR (95% CI) | P | HR (95% CI) | P | HR (95% CI) | P |
| Initial liver GVHD | ||||||
| No | 1 | 1 | 1 | |||
| Yes | 7.11 (2.86-17.7) | <.001 | 5.18 (2.67-10.1) | <.001 | 7.07 (3.25-15.4) | <.001 |
| Acute GVHD initial grade | ||||||
| 1-2 | 1 | 1 | 1 | |||
| 3 | 2.52 (1.24-5.14) | .011 | 2.22 (1.14-4.32) | .019 | 2.74 (1.23-6.12) | .014 |
| Age | ||||||
| <50 y | 1 | 1 | 1 | |||
| ≥50 y | 2.13 (1.10-4.15) | .026 | 1.66 (0.89-3.09) | .11 | 1.46 (0.71-2.99) | .30 |
| Donor | ||||||
| Matched sibling | — | 1 | 1 | |||
| Others | — | 2.00 (0.83-4.82) | .12 | 1.99 (0.68-5.81) | .21 | |
CB, cord blood; BM, bone marrow; OR, odds ratio; PB, peripheral blood.
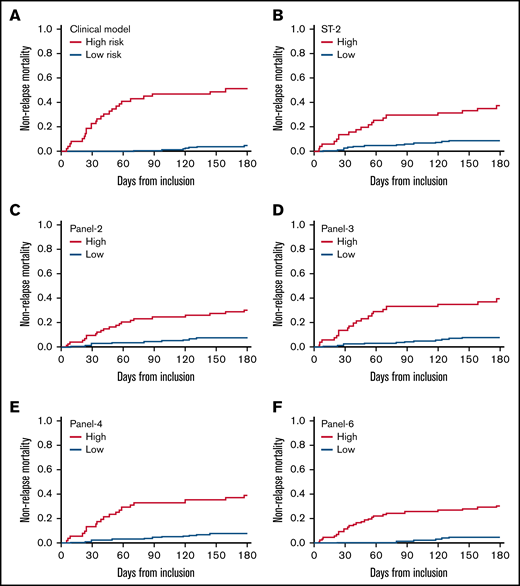
Cumulative incidence of nonrelapse mortality according to clinical factors and cytokines panels. In the clinical model, high-risk patients are those with initial liver GVHD or those aged 50 years or more with initial GVHD grade 3.
Cumulative incidence of nonrelapse mortality according to clinical factors and cytokines panels. In the clinical model, high-risk patients are those with initial liver GVHD or those aged 50 years or more with initial GVHD grade 3.
Association of plasmatic biomarkers on outcome.
As explained in the statistics section, 25% of patients were classified as high risk according to ST2, panel 3, and panel 4, whereas 36% and 42% were at high risk according to panel 2 and panel 6.
Probabilities of D28 nonresponse, D180 survival, and D180 NRM according to biomarkers are given in Table 2 and corresponding survival curves are shown in Figure 1B-F and supplemental Figures 1 and 2 . The univariate analysis showed that all biomarkers were significantly associated with response, OS, and NRM (Table 4). An MVA adjusted on the 3 clinical variables (age, initial GVHD grade, initial liver involvement) is shown in Table 4. None of the panels (or ST2) maintained their association with D28 response. In contrast, biomarkers maintained their significant association with D180 OS and NRM. For survival, the hazard ratio (HR) was the highest with panel 2 (HR: 2.65), followed by panel 6 (HR: 2.30), panel 4 (HR: 2.16), ST2 (HR: 2.12), and panel 3 (1.92). For NRM, the HR was highest with panel 6 (HR: 3.61), followed by panel 2 (HR: 2.68), panel 4 (2.53), panel 3 (HR: 2.45), and ST2 (HR: 2.43).
Biomarkers as risk factors for outcomes
| Univariate analysis | Adjusted analysis* | |||
|---|---|---|---|---|
| Outcome/cytokine panel | OR or HR (95% CI) | P | OR or HR (95% CI) | P |
| Day 28 nonresponse | ||||
| High ST2 | 2.63 (1.36-5.06) | .004 | 1.37 (0.63-2.98) | .43 |
| High panel 2 | 1.84 (1.01-3.37) | .048 | 1.07 (0.52-2.18) | .86 |
| High panel 3 | 2.94 (1.52-5.67) | .001 | 1.28 (0.57-2.86) | .55 |
| High panel 4 | 3.68 (1.90-7.14) | <.001 | 2.03 (0.94-4.35) | .070 |
| High panel 6 | 2.63 (1.44-4.80) | .002 | 1.39 (0.69-2.81) | .36 |
| Day 180 survival | ||||
| High ST2 | 3.89 (2.14-7.08) | <.001 | 2.12 (1.13-3.99) | .019 |
| High panel 2 | 4.00 (2.14-7.50) | <.001 | 2.65 (1.39-5.06) | .003 |
| High panel 3 | 4.07 (2.23-7.40) | <.001 | 1.92 (1.00-3.68) | .050 |
| High panel 4 | 4.02 (2.21-7.31) | <.001 | 2.16 (1.14-4.07) | .017 |
| High panel 6 | 3.92 (2.04-7.52) | <.001 | 2.30 (1.16-4.55) | .017 |
| Day 180 nonrelapse mortality | ||||
| High ST2 | 5.16 (2.54-10.4) | <.001 | 2.43 (1.17-5.09) | .018 |
| High panel 2 | 4.50 (2.13-9.51) | <.001 | 2.68 (1.25-5.77) | .011 |
| High panel 3 | 6.07 (2.96-12.4) | <.001 | 2.45 (1.14-5.28) | .022 |
| High panel 4 | 5.25 (2.59-10.6) | <.001 | 2.53 (1.21-5.28) | .014 |
| High panel 6 | 6.92 (2.85-16.8) | <.001 | 3.61 (1.44-9.03) | .006 |
Adjusted on a simple clinical model where high-risk patients are those with initial liver GVHD or those aged 50 years or more with initial GVHD grade 3.
Additional value of biomarkers over clinical factors.
We also analyzed the discriminative value of the biomarker panels and of clinical variables by measuring the C-index (Table 5). Biomarkers as well as clinical factors were both able to predict outcome. The difference between C-index (Δ C-index) was used to test the added value of biomarkers to clinical parameters. As expected from the MVA, biomarkers did not improve the discrimination for D28 nonresponse (Table 5). However, all biomarkers significantly improved discrimination for OS and NRM over clinical model alone (δ C-index > 0). This was confirmed by the NRIc showing positive values when adding biomarkers to clinical factors for D180 OS and NRM. NRIc was higher for NRM than OS, reflecting a better prediction of NRM than of OS. The next step was to determine if the additional value of biomarkers could help clinical management using DCA. These analyses rely on the hypothesis that predicting an outcome (nonresponse for instance), could help medical decision like adding new therapy to corticosteroids in acute GVHD. DCA, strategies based on clinical models (default strategy) or based on clinical models, and biomarkers were compared. Figure 2 shows DCA curves with clinical model and clinical model with ST2, panel 3, panel 4, and panel 6. Using DCA, biomarkers added only modest net benefit except for panel 6.
Discrimination of models and improvement in discrimination for outcomes
| Model | Parameter | Day 28 nonresponse | Day 180 survival | Day 180 nonrelapse mortality |
|---|---|---|---|---|
| Clinical model* | C-index | 0.71 (0.65-0.78) | 0.75 (0.68-0.81) | 0.81 (0.73-0.86) |
| ST2 | C-index | 0.60 (0.53-0.67) | 0.65 (0.58-0.72) | 0.69 (0.60-0.77) |
| Panel 2 | C-index | 0.57 (0.51-0.64) | 0.67 (0.60-0.74) | 0.68 (0.59-0.75) |
| Panel 3 | C-index | 0.61 (0.54-0.68) | 0.66 (0.58-0.73) | 0.71 (0.62-0.78) |
| Panel 4 | C-index | 0.63 (0.56-0.70) | 0.66 (0.58-0.73) | 0.69 (0.61-0.78) |
| Panel 6 | C-index | 0.62 (0.56-0.69) | 0.67 (0.59-0.73) | 0.72 (0.64-0.78) |
| Clinical + ST2 | C-index | 0.71 (0.63-0.78) | 0.78 (0.70-0.84) | 0.84 (0.76-0.90) |
| Δ C-index | −0.002 (−0.02 to 0.02) | 0.03 (0.004-0.08) | 0.04 (0.01-0.09) | |
| NRIc | 0.38 (−0.35 to 0.67) | 0.66 (0.30-0.99) | 0.82 (0.42-1.16) | |
| Clinical + panel 2 | C-index | 0.70 (0.58-0.76) | 0.79 (0.70-0.85) | 0.84 (0.73-0.89) |
| Δ C-index | −0.02 (−0.04 to −0.006) | 0.04 (0.006-0.09) | 0.03 (−0.002 to 0.07) | |
| NRIc | 0.29 (−0.29 to 0.61) | 0.74 (0.42-1.05) | 0.78 (0.39-1.09) | |
| Clinical + panel 3 | C-index | 0.70 (0.61-0.77) | 0.77 (0.69-0.84) | 0.85 (0.75-0.90) |
| Δ C-index | −0.01 (−0.03 to 0.01) | 0.03 (<0.001-0.07) | 0.04 (0.01-0.09) | |
| NRIc | 0.43 (−0.44 to 0.70) | 0.66 (−0.36 to 1.00) | 0.89 (0.46-1.20) | |
| Clinical + panel 4 | C-index | 0.73 (0.66-0.80) | 0.78 (0.70-0.84) | 0.85 (0.76-0.90) |
| Δ C-index | 0.02 (−0.01 to 0.05) | 0.03 (<0.001-0.08) | 0.04 (0.01-0.09) | |
| NRIc | 0.52 (−0.29 to 0.77) | 0.66 (−0.26 to 0.98) | 0.82 (0.43-1.16) | |
| Clinical + panel 6 | C-index | 0.72 (0.63-0.78) | 0.77 (0.68-0.84) | 0.84 (0.73-0.89) |
| Δ C-index | 0.002 (−0.03 to 0.03) | 0.02 (−0.02 to 0.06) | 0.03 (−0.001 to 0.08) | |
| NRIc | 0.47 (−0.44 to 0.77) | 0.71 (0.37-1.02) | 0.94 (0.55-1.21) |
Values are estimates with 95% confidence intervals. Δ C-index: difference in C-index compared with the clinical model; NRIc: category-less net reclassification index, using clinical model as comparator. Confidence intervals for Δ C-index and NRIc were obtained with 1000 bootstrap replicates. Confidence intervals that contain 0 indicate no evidence of improvement compared with the clinical model.
Clinical model where high-risk patients are those with initial liver GVHD or those aged 50 years or more with initial GVHD grade 3.

Decision curve analysis. The decision curves display the net benefit of using a risk prediction model for decision, weighing the expected benefit of a possible intervention or treatment for patients correctly identified as high risk with the costs or harms associated with a false-positive decision. The relative weights of benefits and costs (cost:benefit ratio) are also reflected by the decision threshold on the probability scale. The dashed blue lines correspond to using the clinical model only and are identical on the 4 panels. The decision curves represent the standardized net benefit of using a model (dashed blue or plain red lines) relative to a default strategy of changing management for no patient (“None,” black line), or all patients (“All,” gray line). The horizontal line (“None”) represents the default strategy of changing management for no patients (net benefit is 0 at all thresholds because there is no change in patient management). The line for changing management for all patients (black line) (ie, considering all patients at “positive”) starts at 1 at a threshold of 0 because false positives are given no weight relative to true positives. Consequently, falsely tagging an individual as positive has no negative consequence. When the risk threshold (corresponding to a given cost:benefit ratio) increases, false positives are given more weight comparatively to true positives, so that changing management for all patients leads to a decreasing net benefit. The dashed blue or plain red lines, corresponding to using models to predict risk and changing management for those predicted at higher risk, allows us to assess the evidence in favor of using the risk-prediction model over the “None” strategy. The thin lines present bootstrap 95% confidence intervals.
Decision curve analysis. The decision curves display the net benefit of using a risk prediction model for decision, weighing the expected benefit of a possible intervention or treatment for patients correctly identified as high risk with the costs or harms associated with a false-positive decision. The relative weights of benefits and costs (cost:benefit ratio) are also reflected by the decision threshold on the probability scale. The dashed blue lines correspond to using the clinical model only and are identical on the 4 panels. The decision curves represent the standardized net benefit of using a model (dashed blue or plain red lines) relative to a default strategy of changing management for no patient (“None,” black line), or all patients (“All,” gray line). The horizontal line (“None”) represents the default strategy of changing management for no patients (net benefit is 0 at all thresholds because there is no change in patient management). The line for changing management for all patients (black line) (ie, considering all patients at “positive”) starts at 1 at a threshold of 0 because false positives are given no weight relative to true positives. Consequently, falsely tagging an individual as positive has no negative consequence. When the risk threshold (corresponding to a given cost:benefit ratio) increases, false positives are given more weight comparatively to true positives, so that changing management for all patients leads to a decreasing net benefit. The dashed blue or plain red lines, corresponding to using models to predict risk and changing management for those predicted at higher risk, allows us to assess the evidence in favor of using the risk-prediction model over the “None” strategy. The thin lines present bootstrap 95% confidence intervals.
Discussion
In the past decade, many studies have highlighted the association of plasmatic biomarkers with prognosis after HSCT. In our study, we focused on patients who developed acute GVHD to determine if biomarkers at GVHD onset could better predict treatment response and NRM, as previously reported.10,14-21,30-36 We conducted a single-center prospective study with the aim of externally validating the potent clinical usefulness of these biomarkers at GVHD onset. In our hands, biomarkers are predictive of D180 NRM and OS, thus confirming previous results,15-17,19 in an independent center and using slightly different measurement methods of biomarkers.
Different classifications have been designed to predict GVHD severity but few have been tested at disease onset, as is the case in our study. To avoid overfitting, we had targeted a predefined limited set of clinical predictors to be adjusted for. Herein, grade at onset of GVHD and initial liver involvement were highly predictive for D28 response and NRM. Indeed, patients with initial grade 3 had a high probability of nonresponse on D28 (52%), whereas patients with grade 1/2 had a low probability of D180-NRM (8%). Furthermore, as we and others previously reported, an initial liver involvement had even a stronger impact on outcome with a D28 nonresponse reaching 76%.2,37 We also looked at other clinical variables for comparison with previous studies. In our clinical model, albuminemia was not predictive for D28 response or D180 NRM. Age remained an important risk factor for response and survival. Fever, which may reflect cytokine release, was associated with response and NRM, but its impact was no longer significant in the adjusted model when liver involvement was included.
Our study confirms that biomarkers measured at GVHD onset predict response and NRM. We subsequently tested if they could provide an additional value to the clinical predictors (grade, initial liver involvement, and age). First, to predict response, biomarkers did not add predictive value to clinical parameters in MVA in an adjusted Cox regression model. When comparing the discrimination models (C-index), we also confirmed that biomarkers did not add value to clinical model alone. This sharply contrasts with the results of the original panel 6 article, where none of the clinical parameters predicted response to treatment.17 In contrast, NRM and mortality predictions were both improved by the addition of biomarkers to clinical parameters in the MVA models.
We next used the C-index to quantify how well a marker or a model discriminates between patients. Both clinical model and ST2/panels had C-indexes in the 0.6. to 0.7 range. As described in Table 5, Δ C-indexes and NRIc showed that none of the panels adds significant additional value to clinical model to predict response.
Conversely, there was statistical evidence of slight (though not impressive) improvements over clinical parameters alone to predict mortality. Results were also very similar when analyzing the biomarker panels as continuous variables, so that the limited improvement in prediction should not be explained by a loss of information due to dichotomizing the panels as “high” and “low.” Of note, in the prospective BMT-CTN randomized trial 1501, clinical low risk according to the Minnesota algorithm is highly correlated with low risk according to the Ann Arbor biomarker panel 2. Table 1 shows formula and cutoff for panel 2 used in Pidala et al’s study and in ours. In Pidala et al’s study, only 5 of the 127 low-risk patients identified according to clinical criteria had higher risk according to the Ann Arbor biomarker panel.22 Finally, we asked whether biomarkers would help patients’ management using decision curve analyses. Decision curve analyses using panel 6 showed improved benefit ratio in predicting mortality. Overall, this study confirms that biomarkers maintained their significant association with D180 OS and NRM. However, in contrast with Ann Arbor results, we found that some clinical parameters had a strong influence on early endpoints. “In another recent study, it has been reported that biomarkers’ additional values as compared with clinical features are only modest; in this study samples and clinical data were taken 14 days after steroid initiation which differed from our (day 0).”32 This thus raises the points of their utility in clinical practice (from a medico-economic point of view), although their utility in randomized clinical trial to analyze results or risk-stratify patients surely warrants ongoing efforts.
Our study has some limits related to the number of patients that did not enable analyses in clinical subgroups where biomarkers may have a different impact. Also, we did not aim at building full risk prediction models using the biomarker panels and did not assess the calibration of models with those panels. We focused our study at disease onset, assuming that post-GVHD samples may be less predictive than clinical markers for steroid-refractory GVHD, in contrast with the MAGIC consortium.21 The aim of prediction studies may also be to adjust therapy at an earlier time point to prevent steroid-refractory GVHD mortality. Indeed, as a proof of concept, a prospective study has recently proposed a preemptive therapy with α-1 antitrypsin based on the results of a panel of 2 biomarkers measured at day 7 or 14 after HSCT.33 α-1 antitrypsin was given to 30 patients with “high-risk disease” panel 2 level, whereas 90 other high-risk patients were not treated. This study did not show any difference in the outcome of the 2 groups.
To conclude, biomarkers previously published by the Ann Arbor/MAGIC consortium appear as objective tools able to predict the outcomes. However, in our hands, their predictivity was relatively low (C-index ≤ 0.80) adding modest improvements to clinical parameters, casting caution on their use in daily practice.
Acknowledgments
Funding support for this article was provided by the Institut National du Cancer (InCA) and Organisation de la Direction Générale de l'Offre de Soins (DGOS) with the grant “TRANSLA13-122” and Agence de Biomédecine with the grant “Recherche Greffe 2015”.
Authorship
Contribution: M.R., M.-H.S., and G.S. designed the study; M.-H.S. and L.T. performed the biological analysis; R.P. and B.O. performed the statistical analysis; M.R., G.S., D.M., F.S.d.F., R.P.d.L., A.X., and A.S.D.G. enrolled and provided patients; M.R. and L.T. reviewed clinical data; M.R., M.-H.S., G.S., and R.P. wrote the paper; and all coauthors reviewed the paper and added substantial contributions.
Conflict-of-interest disclosure: The authors declare no competing financial interests.
Correspondence: Marie Robin, Service d’hématologie – Greffe, Hôpital Saint-Louis, APHP, 1 avenue Claude Vellefaux, 75010 Paris; e-mail: marie.robin@aphp.fr.

