

Key Points
ImmunoPET imaging of ICOS allows for in vivo visualization of T cells in the gastrointestinal tract in a murine model of acute GvHD.
ICOS targeting with the immunoPET tracer does not affect GvHD pathogenesis or the GvT effect.

Abstract
Allogeneic hematopoietic cell transplantation (HCT) is a well-established and potentially curative treatment for a broad range of hematological diseases, bone marrow failure states, and genetic disorders. Acute graft-versus-host disease (GvHD), mediated by donor T cells attacking host tissues, still represents a major cause of morbidity and mortality following allogeneic HCT. Current approaches to diagnosis of gastrointestinal acute GvHD rely on clinical and pathological criteria that manifest at late stages of disease. New strategies allowing for GvHD prediction and diagnosis, prior to symptom onset, are urgently needed. Noninvasive antibody-based positron emission tomography (PET) (immunoPET) imaging of T-cell activation post–allogeneic HCT is a promising strategy toward this goal. In this work, we identified inducible T-cell costimulator (ICOS) as a potential immunoPET target for imaging activated T cells during GvHD. We demonstrate that the use of the Zirconium-89-deferoxamine-ICOS monoclonal antibody PET tracer allows in vivo visualization of donor T-cell activation in target tissues, namely the intestinal tract, in a murine model of acute GvHD. Importantly, we demonstrate that the Zirconium-89-deferoxamine-ICOS monoclonal antibody PET tracer does not affect GvHD pathogenesis or the graft-versus-tumor (GvT) effect of the transplant procedure. Our data identify ICOS immunoPET as a promising strategy for early GvHD diagnosis prior to the appearance of clinical symptoms.
Introduction
Allogeneic hematopoietic cell transplantation (HCT) is an effective treatment for a broad range of hematological diseases. Despite its success, allogeneic HCT is still associated with a significant transplant-related morbidity and mortality related to posttransplant complications, namely graft-versus-host disease (GvHD). Acute GvHD results from the activation of donor T cells and subsequent cytolytic attack of host tissues, mainly skin, liver, and intestine.1 Unfortunately, current methods for GvHD diagnosis do not enable early diagnosis at a presymptomatic stage because they mostly rely on the assessment of clinical symptoms combined with tissue biopsies of target organs.
There is, therefore, a critical need to develop noninvasive strategies to accurately diagnose GvHD at early stages. Positron emission tomography (PET) is a promising approach for whole-body molecular imaging of GvHD. [18F]Fluorodeoxyglucose (18F-FDG)-PET enables noninvasive measurement of alterations in glucose metabolism and has demonstrated high sensitivity for detecting acute GvHD prior to the appearance of pathological signs.2-4 18F-FDG, however, is taken up by all cells with elevated glycolysis (eg, inflammatory cells, cancer cells) and thus lacks sufficient specificity to distinguish intestinal GvHD from other causes of gastrointestinal inflammation.3,4 Because donor T-cell activation is considered one of the earliest events in acute GvHD pathogenesis,1,5,6 we and others have reported the noninvasive detection of activated T cells using the small-molecule metabolic PET tracer 2′-deoxy-2′-[18F]fluoro-9-β-d-arabinofuranosyl guanine (18F-FAraG). PET imaging with 18F-FAraG enabled early detection of activated T cells during murine GvHD,7 a strategy that is currently under clinical investigation for early diagnosis of acute GvHD in HCT patients at our institution (#NCT03367962; clincialtrials.gov). Although this imaging approach is more specific than 18F-FDG-PET, it is still hindered by suboptimal T-cell specificity as the targeted metabolic pathways of 18F-FAraG can also be upregulated in other tissues or cells.
To address the limited specificity of metabolic tracers, several groups have been exploring the use of immunoPET, which combines the high specificity of monoclonal antibodies (mAbs) or antibody fragments targeting a particular cell surface marker with PET radioisotopes. PET imaging of GvHD targeting the T-cell lineage–defining marker CD38 and the activation marker HLA-DR9 has been reported. Although CD3 imaging enables T-cell visualization, it fails to report on T-cell activation status. Conversely, HLA-DR expression reflects T-cell activation, as well as that of the myeloid compartment, thus lacking specificity for tracking activated T-cells alone. We recently reported a 64Cu-labeled OX40 mAb, which noninvasively visualized murine OX40+, activated T cells10 and enabled detection of acute GvHD in a major histocompatibility complex (MHC)-mismatch murine model.11 Despite clearly delineating activated T cells in vivo, this approach unfortunately has limited utility as the immunoPET tracer, based on an agonist clone, led to the exacerbation of acute GvHD and, consequently, serious toxicity.11
In an effort to find new potential biomarkers to successfully and safely image activated T cells in acute GvHD by immunoPET, we identified the inducible T-cell costimulatory receptor (ICOS), a T-cell activation marker in the CD28/cytotoxic T lymphocyte antigen-4 (CTLA-4) family. Employing our previously reported Zirconium-89 (89Zr)-labeled, murine ICOS–specific antagonistic monoclonal antibody,12,13 we demonstrate that ICOS immunoPET successfully visualizes the dynamics of activation, expansion, and tissue distribution of alloreactive T cells in a MHC-mismatch murine model of acute GvHD, with high specificity and sensitivity and without any detectable toxicity, thus providing a compelling method for the early detection of gastrointestinal GvHD.
Methods
Animals and animal study approval
Female BALB/cJ (H-2kd), C57BL/6J (H-2kb), and NOD.Cg-Prkdcscid-Il2rgtm1Wjl/SzJ (NSG) mice were purchased from the Jackson Laboratory. Luciferase (Luc)+ transgenic C57BL/6-L2G85 mice6 were bred at Stanford University. All animal procedures were approved by the Stanford Administrative Panel of Laboratory Animal Care. All federal and state regulations governing the humane care and use of laboratory animals were upheld.
RNA sequencing data analysis
Previously published RNA sequencing (RNA-seq) datasets from GvHD models (National Center for Biotechnology Information Gene Expression Omnibus accession number GSE17216914 and EMBL-EBI ArrayExpress E-MTAB-686515 ) were analyzed. Murine CD4 and CD8 T cells were analyzed pre- and 7 days post–allogeneic HCT, as previously described,14 and data from human T cells were analyzed pre- and 14 days post–IV injection into sublethally irradiated NSG mice.15 Differential gene expression analysis was performed using DESeq216 version 1.28.1, and data were visualized using ggplot2 version 3.3.4.
MHC-mismatch murine models of acute GvHD
Female BALB/cJ mice (8-10 weeks) received lethal total body irradiation (TBI), consisting of 2 doses of 440 cGy, 4 hours apart (total dose 880 cGy). Splenocytes were harvested from Luc+ transgenic C57BL/6 or FVB/N L2G85 mice, and donor T cells were purified by positive selection (Miltenyi Biotec). T-cell–depleted bone marrow (TCD-BM) was obtained from C57BL/6J or FVB/NJ mice by homogenizing bones, collecting the bone marrow suspension, and depleting both CD4 and CD8 T cells using MicroBeads (Miltenyi Biotec). Irradiated BALB/cJ recipients were injected with 5 × 10⁶ TCD-BM cells and 1 × 10⁶ T cells IV to induce acute GvHD. After transplantation, mice were monitored daily, and GvHD score was assessed at day 4 and weekly thereafter as previously described.17 In experiments evaluating the graft-versus-tumor (GvT) effect, 2 × 10⁵luc+ A20 lymphoma cells were injected IV into the BALB/c recipient mice via a tail vein at time of transplantation; GvHD mice in these experiments received T cells from wild-type C57BL/6J mice.
Xenogenic GvHD model
Female NSG mice were sublethally irradiated (2 Gy) and injected IV with 107 human peripheral blood mononuclear cells (PBMCs) isolated from healthy human volunteers (Stanford Blood Center) using Ficoll-Paque (GE Healthcare) gradient centrifugation. Mice were monitored daily, and GvHD score was assessed weekly as previously described.17
Flow cytometry
Spleens were harvested on days 4 and 7 post–allogeneic HCT, or day 14 after human PBMC injection, for the MHC-mismatch murine acute and xenogenic GVHD models, respectively. Splenocytes were resuspended in phosphate-buffered saline (PBS) buffer containing 2% fetal bovine serum. Intestines were collected at day 7, flushed with PBS, and mechanically dissected into pieces. Tissues were digested with 1 mg/mL−1 Collagenase IV (Life Technologies) for 30 minutes, and lymphocyte was isolated using a Percoll (Sigma-Aldrich) gradient. Fluorescence-activated cell sorting (FACS) staining was performed at 4°C with the following antibodies: fluorescein isothiocyanate anti-mouse CD45.1 (clone A20), BV785 anti-human/mouse/rat ICOS (C398.4A) and isotype control antibody (HTK888), APC anti-mouse Thy1.1 (OX-7), APC/Fire750 anti-mouse CD19 (clone 6D5) and anti-mouse CD45.2 (104), BV421 anti-mouse CD4 (GK1.5), BV605 anti-mouse CD3 (17A2), BV650 anti-CD8 (53-6.7), Pacific Blue anti-human CD45 (2D1), BV605 anti-human CD3 (OKT3), BV650 anti-human CD4 (OKT4), and BV711 anti-human CD8a (RPA-T8). All antibodies were purchased from Biolegend. Data were acquired on a BD LSR II flow cytometer (BD Biosciences) and analyzed using FlowJo version 10.7.1 (BD Biosciences).
Bioluminescence imaging
Mice were anesthetized using 2% isoflurane and injected intraperitoneally with d-luciferin (10 mg/kg). Bioluminescence imaging (BLI) was performed using the IVIS Spectrum imaging system (Perkin Elmer), and data were analyzed with Living Image Software 4.1 (Perkin Elmer) or using an Ami LED-illumination–based imaging system (Spectral Instruments Imaging, Tucson, AZ) and analyzed with Aura Software (Spectral Instruments Imaging).
Bioconjugation and 89Zr radiolabeling of monoclonal antibodies
89Zr radiolabeled ICOS antibody (rat clone 7E.17G9, Bio X cell) was prepared as previously described.12 Briefly, 1 mg of antibody was diluted to 1 mg/mL in PBS, and the pH was adjusted to 8.8 to 9.0 prior to addition of deferoxamine-isothiocyanate (DFO-SCN) chelate (Macrocyclics) dissolved in DMSO (Thermofisher). The bioconjugation reaction was allowed to proceed for 1 hour at 37°C, after which the DFO-modified mAb was washed using a 2 mL Vivaspin filter with a 50 kDa cutoff (Sartorius) to remove unbound chelate. Matrix-assisted laser desorption/ionization (MALDI)-mass spectrometry was conducted on the bioconjugates to determine final chelate:mAb ratios (1.5-2.5 chelates per antibody), and final protein concentrations were determined using a Thermo Scientific NanoDrop UV-Vis spectrophotometer. For radiolabeling, ∼1 mCi 89Zr oxalate (3D Imaging), adjusted to pH 7.1 to 7.8 using 1 M Na2CO3, was incubated with the DFO-ICOS mAb for 1 hour at 37°C with gentle agitation. Free 89Zr oxalate was removed, and 89Zr-DFO-ICOS mAb was purified using 7K MW cutoff zeba spin desalting column (Thermofisher) and centrifuged for 1 minute at 1000g. Final radiochemical purity of >99% of 89Zr-DFO-ICOS mAb was determined using instant thin-layer chromatography using chromatography strips (Biodex).
Small animal PET/CT imaging, image analysis, and biodistribution (BioD) study
All PET/computed tomography (CT) imaging studies were performed using Siemens Inveon small animal Multi-Modality-PET/CT. Mice were anesthetized using isoflurane (2% to 2.5% for induction and 1.5% to 2.0% for maintenance) delivered by 100% oxygen. 50 microcurie (µCi) (1 µCi/µL, mass dose injected; 7 µg) 89Zr-DFO-ICOS mAb was administered IV via the tail vein on day 4 post-transplantation. At 24 and 48 hours post–tracer injection, 15-minute static PET scans were acquired, followed by a CT scan to provide an anatomic reference and for attenuation correction of the PET data. PET reconstruction and region of interest (ROI) analysis of the PET images were performed using a 3-dimensional volume drawing mode.11
Mice were euthanized following completion of the PET/CT scan at 48 hours. Blood, mesenteric lymph node (mLN), liver, spleen, heart, left kidney, large intestine, bone (femur), and muscle were collected, and wet weights were immediately recorded to allow normalization of tissue-associated radioactivity to tissue weight. An automatic γ counter (Hidex AMG) was used to determine the tissue-associated radioactivity for each tissue collected. Both PET and BioD data were normalized to injected dose and were expressed as percentage injected dose/g of tissue.
Assessment of the impact of ICOS mAb on GvHD and GvT
The antibody used for PET imaging, murine-specific ICOS mAb (clone 7E.17G9), or the appropriate isotype control (clone LTF-2) were administered IV as a single dose (10 μg in 100 μL of sterile PBS) on day 4 post-HCT. The dose was determined based on the upper limit of antibody administered during PET imaging studies (7 μg antibody was injected per PET tracer dose).
Statistical analysis
Statistical analyses were performed using R version 4.0.2 with R studio Version 1.3.1056. Data were visualized using ggplot2 version 3.3.4. Heatmaps were generated using Pheatmap version 1.0.12. Principal component analysis (PCA) was performed using the FactoMineR package version 2.41 and visualized using the factorextra package version 1.0.7. Receiver operating characteristic(ROC) curves were calculated and plotted using plotROC version 2.2.1.
Results
ICOS is strongly upregulated on murine and human T cells in models of acute GvHD
To identify surface markers of T-cell activation as potential new immunoPET targets for GvHD imaging, we interrogated an RNA-seq dataset we recently published14 containing data obtained from murine CD4 and CD8 T cells, pre- and 7 days post–MHC-mismatched allogeneic HCT. After analyzing differential gene expression between cells at day 0 and at day 7, we focused our attention on genes encoding T-cell surface activation molecules previously employed as immunoPET targets, namely OX40,11 ICOS,12 CD69,18 and GITR.19 Among these molecules, the gene encoding ICOS was the most highly differentially expressed in CD4 (log2 fold change, 2.57; adjusted P = 1.24E-71; Figure 1A) and CD8 T cells (log2 fold change, 1.90; adjusted P = 3.52E-58; Figure 1A). Interestingly, Icos transcription was upregulated to a higher extent than Tnfrsf4 (CD4: log2 fold change, 2.36; adjusted P = 2.28E-05; CD8: log2 fold change, 1.70; adjusted P = 9.30E-23), which encodes OX40, a molecule we previously reported as a target for sensitive immunoPET imaging of acute GvHD.11 To assess whether Icos transcription was similarly upregulated on activated human T cells, we analyzed a second publicly available RNA-seq dataset obtained from human T cells pre- and 14 days post-injection into alymphoid NSG mice induced with xenogeneic GvHD.15 In agreement with the murine data, Icos was the most significantly upregulated T-cell activation marker among those preselected (log2 fold change, 2.30; adjusted P = 4.42E-37; Figure 1B).
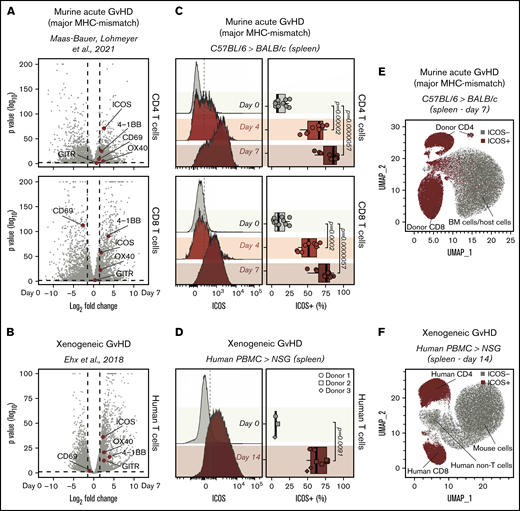
Identification of ICOS as a biomarker of acute GvHD. (A-B) Volcano plots summarizing the differential gene expression analysis performed on publicly available RNA-seq data comparing murine (A) and human (B) T cells recovered from murine models of acute GvHD with cells prior to adoptive transfer. Vertical dashed lines on volcano plots indicate a log2 fold change of 1.5; horizontal dashed lines indicate an adjusted P value of .05. Genes encoding for selected activation markers previously employed as immunoPET targets are highlighted in red. (C) Representative FACS histograms (left panels) and summary of percentages (right panels) of ICOS expression on CD90.1+CD45.1+CD4+ (top panels) and CD8+ (bottom panels) T cells recovered from the spleen 4 and 7 days post–adoptive transfer of C57BL/6 T cells into allogeneic BALB/c recipients. Values are summarized as box plots, representing the range, first quartile, median, third quartile, and eventual outliers. Results are pooled from 2 independent experiments (n = 9-11 mice per group). Day 4 and 7 values were compared with day 0 values using a nonparametric Mann-Whitney U test. P values are indicated. (D) Representative FACS histograms (left panels) and summary of percentages (right panels) of ICOS expression on human-CD45+ murine-CD45− CD3+ T cells recovered from spleen 14 days post–adoptive transfer of human PBMCs from healthy donors into sublethally irradiated NSG mice. Results are pooled for a total of 9 mice (n = 2-4 mice per group). Day 14 and 0 values were compared using a nonparametric Mann-Whitney U test. P values are indicated. (E-F) Uniform Manifold Approximation and Projection plots of FACS data obtained from the analysis of spleens recovered at day 7 after MHC-mismatch murine allogeneic HCT (E) or at day 14 upon induction of xenogeneic GvHD by adoptive transfer of PBMCs into NSG mice (F). ICOS-expressing cells are depicted in red.
Identification of ICOS as a biomarker of acute GvHD. (A-B) Volcano plots summarizing the differential gene expression analysis performed on publicly available RNA-seq data comparing murine (A) and human (B) T cells recovered from murine models of acute GvHD with cells prior to adoptive transfer. Vertical dashed lines on volcano plots indicate a log2 fold change of 1.5; horizontal dashed lines indicate an adjusted P value of .05. Genes encoding for selected activation markers previously employed as immunoPET targets are highlighted in red. (C) Representative FACS histograms (left panels) and summary of percentages (right panels) of ICOS expression on CD90.1+CD45.1+CD4+ (top panels) and CD8+ (bottom panels) T cells recovered from the spleen 4 and 7 days post–adoptive transfer of C57BL/6 T cells into allogeneic BALB/c recipients. Values are summarized as box plots, representing the range, first quartile, median, third quartile, and eventual outliers. Results are pooled from 2 independent experiments (n = 9-11 mice per group). Day 4 and 7 values were compared with day 0 values using a nonparametric Mann-Whitney U test. P values are indicated. (D) Representative FACS histograms (left panels) and summary of percentages (right panels) of ICOS expression on human-CD45+ murine-CD45− CD3+ T cells recovered from spleen 14 days post–adoptive transfer of human PBMCs from healthy donors into sublethally irradiated NSG mice. Results are pooled for a total of 9 mice (n = 2-4 mice per group). Day 14 and 0 values were compared using a nonparametric Mann-Whitney U test. P values are indicated. (E-F) Uniform Manifold Approximation and Projection plots of FACS data obtained from the analysis of spleens recovered at day 7 after MHC-mismatch murine allogeneic HCT (E) or at day 14 upon induction of xenogeneic GvHD by adoptive transfer of PBMCs into NSG mice (F). ICOS-expressing cells are depicted in red.
We then compared murine CD4+ and CD8+ T cells from CD45.1 and CD90.1 C57BL/6 donor mice preinjection with those recovered at day 4 and 7 post-HCT into allogeneic CD45.2 and CD90.2 BALB/c recipients to assess ICOS expression on T cells during GvHD at the protein level. We detected significantly higher proportions of ICOS+ cells among both CD4+ and CD8+ donor-derived CD45.1+ CD90.1+ T cells recovered at day 4 (CD4: median, 66% [range, 39%-77%], P = 1.2e-05; CD8: 52% [36%-67%], P = .0002) and at day 7 (CD4: 86% [60%-92%], P = 5.7e-06; CD8: 76% [50%-87%], P = 5.7e-06) post-HCT compared with day 0 (CD4: 9% [5%-23%]; CD8: 9% [1%-25%]; Figure 1C). Similar results were obtained when a second mouse model of acute GvHD (FVB/N into BALB/c mice) was employed (supplemental Figure 1A). Moreover, ICOS was strongly upregulated at the surface of CD4 and CD8 T cells infiltrating the intestine at day 7 after transplantation (supplemental Figure 1B). We next analyzed ICOS expression by human T cells in a model of xenogeneic GvHD. T cells recovered from spleens of NSG mice 14 days after transfer of human PBMCs showed significantly higher percentages of ICOS+ cells compared with T cells prior to injection (day 14: 62% [49%-78%]; day 0: 5% [4%-8%]; P = .0091; Figure 1D). Unsupervised clustering of splenocytes recovered from GvHD mice at day 7 post–MHC-mismatch HCT showed that ICOS expression selectively identified donor-derived CD4+ and CD8+ T cells, distinguishing them from BM-derived and host-derived cells (Figure 1E). Similarly, in splenocytes recovered from xenogeneic GvHD mice at day 14 post-hPBMC transfer, ICOS expression identified activated human CD4+and CD8+ T cells, distinguishing them from both mouse cells and other human immune cells (Figure 1F).
Collectively, these results demonstrate that ICOS expression is significantly upregulated by both mouse and human T cells in 3 murine models of acute GvHD.
89Zr-DFO-ICOS mAb immunoPET enables visualization of ICOS+-activated T cells in acute GvHD
We next evaluated the ability of ICOS-targeted immunoPET to visualize allogeneic T-cell activation and migration to target tissues during murine acute GvHD using 89Zr-DFO-ICOS mAb. Acute GvHD was induced by adoptive transfer of Luc+ T cells, allowing in vivo T-cell detection, localization, and monitoring via BLI. On day 4 after HCT, a time point when no obvious signs of disease were observed, BLI detected donor-derived Luc+ T cells in the spleen, as well as in the mesenteric and cervical LNs (Figure 2A); this is in agreement with previously reported allogenic T-cell expansion in secondary lymphoid organs at this early stage of GvHD.6 We then evaluated the capacity of 89Zr-DFO-ICOS mAb to detect allogenic T-cell activation during GvHD. To this end, splenic T cells and TCD-BM were adoptively transferred to induce GvHD, and 50 µCi of 89Zr-DFO-ICOS mAb was administrated IV at day 4 post-HCT. Mice receiving only TBI (TBI group) were used as a control to assess nonspecific tracer accumulation as a result of tissue damage and inflammation during conditioning. Mice receiving TCD-BM in the absence of T cells (BM group) were used as an additional control to evaluate signal derived from 89Zr-DFO-ICOS mAb binding to allogeneic hematopoietic cells other than T cells. PET images were acquired 24 and 48 hours after tracer administration; the 48-hour imaging timepoint was selected for further analysis due to optimal signal/noise ratios. A reference atlas of a representative volume-rendered technique PET/CT image with the location of key clearance organs, lymphoid organs, and GvHD target tissues is shown in Figure 2B. PET signal was observed in the heart and the liver of all groups (Figure 2C), depicting the antibody tracer circulating in the blood and its hepatic clearance, respectively.20 Conversely, 89Zr-DFO-ICOS mAb PET signal in the spleen, mLN, and abdominal region was pronounced in GvHD mice (Figure 2C).
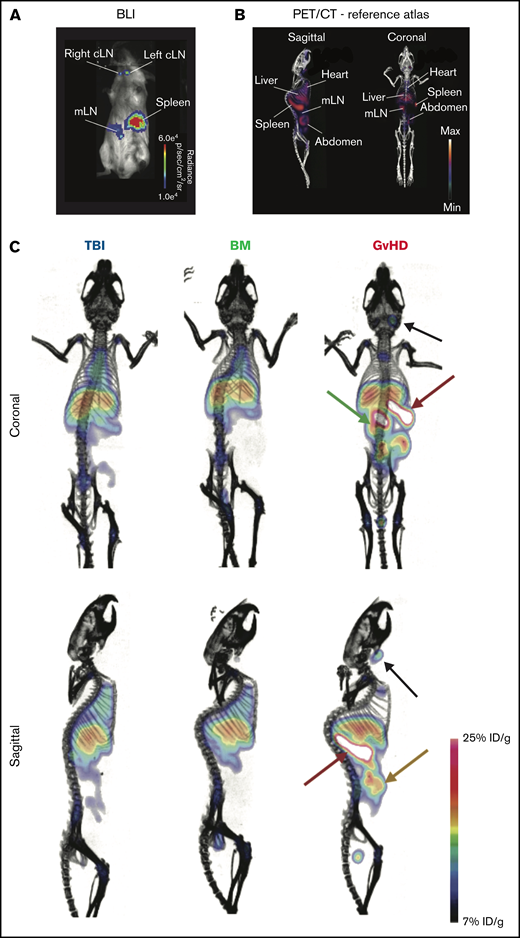
89Zr-DFO-ICOS mAb immunoPET imaging of acute GvHD. (A) Representative BLI of a mouse with acute GvHD at day 4 post-HCT. (B) Reference atlas indicating the location of key clearance and lymphoid organs as well as GvHD target tissues. (C) Representative 89Zr-DFO-ICOS mAb PET/CT images acquired 48 hours after tracer administration at day 4 after HCT in TBI control (n = 5), bone marrow control (n = 7), or GvHD (n = 11) mice. Key organs, namely spleen (red arrow), cervical lymph node (cLN) (black arrow), mLN (green arrow), and intestine (yellow arrow), are highlighted. Images are representative of 2 independent experiments. %ID/g, percent injected dose per gram.
89Zr-DFO-ICOS mAb immunoPET imaging of acute GvHD. (A) Representative BLI of a mouse with acute GvHD at day 4 post-HCT. (B) Reference atlas indicating the location of key clearance and lymphoid organs as well as GvHD target tissues. (C) Representative 89Zr-DFO-ICOS mAb PET/CT images acquired 48 hours after tracer administration at day 4 after HCT in TBI control (n = 5), bone marrow control (n = 7), or GvHD (n = 11) mice. Key organs, namely spleen (red arrow), cervical lymph node (cLN) (black arrow), mLN (green arrow), and intestine (yellow arrow), are highlighted. Images are representative of 2 independent experiments. %ID/g, percent injected dose per gram.
ROI analysis confirmed markedly increased tracer uptake in the spleen (median, 38.68% ID/g [range, 29.90-44.89]), mLN (25.15% ID/g [19.38-40.39]), and intestine (19.53% ID/g [15.31-35.67]) of GvHD mice compared with both TBI (spleen, 10.91% ID/g [10.45-14.7], P = 6.3e-05; mLN, 9.77% ID/g [7.79-10.93], P = .0005; intestine, 7.62% ID/g [5.23-9.51], P = .00046) and BM (spleen, 10.91% ID/g [10.45-14.70], P = 6.3e-05; mLN, 12.65% ID/g [10.69-17.43], P = 6.3e-05; intestine, 8.87% ID/g [7.42-16.26], P = .0001) controls (Figure 3A, upper panels). Slightly but significantly reduced levels of tracer accumulation were detected in the hearts of GvHD mice (5.96% ID/g [4.05-8.49]) compared with both TBI (14.04% ID/g [12.07-15.99], P = .00046) and BM (12.70% ID/g [10.40-14.51], P = 6.3e-05) controls; signal was also reduced in the kidney of GvHD mice (3.61% ID/g [0-9.01]) compared with TBI controls (6.30% ID/g [6.16-6.76]; P = .04; Figure 3, upper panels). These results are compatible with a sink effect, in which binding of the tracer to tissue-resident antigen effects signals reduction in the blood.
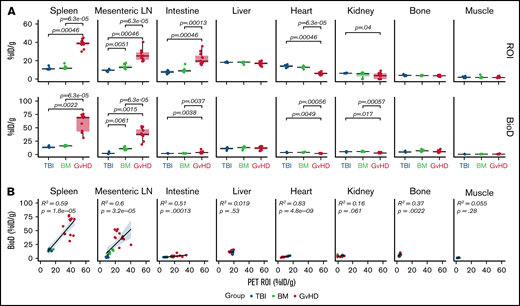
Quantitative PET ROI and BioD analysis of 89Zr-DFO-ICOS mAb in acute GvHD. (A) Quantitative ROI analysis of PET images (upper panels) and BioD (lower panels) of spleen, mLN, intestine, liver, heart, kidney, bone, and muscle 48 hours after tracer injection in TBI (blue; n = 5), BM (green; n = 7), or GvHD mice (red; n = 11). Values are summarized as box plots, representing the range, first quartile, median, third quartile, and eventual outliers. Tracer uptake in GvHD and TBI or BM mice was compared using the Mann-Whitney U test. (B) Correlation between tracer uptake measured by PET ROI image analysis with that determined by BioD analysis, evaluated using a Spearman rank correlation coefficient test. Results are pooled from 2 independent experiments. %ID/g, percent injected dose per gram.
Quantitative PET ROI and BioD analysis of 89Zr-DFO-ICOS mAb in acute GvHD. (A) Quantitative ROI analysis of PET images (upper panels) and BioD (lower panels) of spleen, mLN, intestine, liver, heart, kidney, bone, and muscle 48 hours after tracer injection in TBI (blue; n = 5), BM (green; n = 7), or GvHD mice (red; n = 11). Values are summarized as box plots, representing the range, first quartile, median, third quartile, and eventual outliers. Tracer uptake in GvHD and TBI or BM mice was compared using the Mann-Whitney U test. (B) Correlation between tracer uptake measured by PET ROI image analysis with that determined by BioD analysis, evaluated using a Spearman rank correlation coefficient test. Results are pooled from 2 independent experiments. %ID/g, percent injected dose per gram.
Ex vivo BioD analysis using γ counting of tissues, performed following the 48-hour PET acquisition, showed a similar trend to the PET ROI quantification, with significantly increased tracer uptake measured in lymphoid tissues and intestines of GvHD mice vs controls (TBI: spleen P = .0022; mLN, P = .0015; intestine P = .0038; BM: spleen P = 6.3e-05; mLN P = 6.3e-05; intestine, P = .0037) (Figure 3A, lower panels). Correlation analysis confirmed good concordance between PET ROI and BioD measurements, showing a significant positive correlation in spleen (R2, 0.59; P = 1.8e-05), mLN (R2, 0.6; P = 3.2e-05), and intestine (R2, 0.51, P = .0001; Figure 3B). Collectively, our data indicate that 89Zr-DFO-ICOS mAb immunoPET noninvasively and specifically captures the expansion of ICOS+, activated donor-derived T cells during murine acute GvHD.
ICOS immunoPET signals from intestine, spleen, and mLN have high diagnostic potential for early detection of murine acute gastrointestinal GvHD
We next evaluated the capability of 89Zr-DFO-ICOS mAb PET signal from different tissues to enable early diagnosis of murine acute gastrointestinal GvHD. Unsupervised hierarchical clustering based on ROI quantification of all tissues from mice in the PET dataset readily distinguished the GvHD group from TBI and BM mice (Figure 4A). Similarly, PCA clearly segregated mice from the GvHD group from other mice across the PC1, which accounted for 46% of the variance (Figure 4B). Spleen, mLN, and intestine PET ROIs were the strongest contributors in distinguishing mice in the GvHD group from other cohorts across PC1 (Figure 4B). To evaluate the diagnostic potential of 89Zr-DFO-ICOS mAb for early detection of acute GvHD, we employed ROC analysis. Spleen, mLN, and intestine ROIs had excellent diagnostic potential for GvHD diagnosis (spleen area under the curve [AUC], 1; mLN AUC, 1; intestine AUC, 0.99; Figure 4C), whereas, as predicted, muscle ROI had no diagnostic potential (AUC, 0.5). This analysis indicates that the 89Zr-DFO-ICOS mAb PET signal from secondary lymphoid organs and the intestine have an optimal diagnostic potential for murine acute gastrointestinal GvHD.
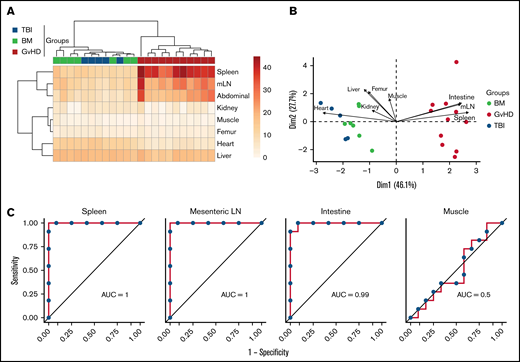
Assessment of 89Zr-DFO-ICOS mAb PET imaging as a potential tool for gastrointestinal GvHD early diagnosis. (A) Heatmap visualization and hierarchical clustering of normalized ICOS PET ROI values (rows) from single transplant recipients (columns). Data shown are pooled from 2 independent experiments. (B) PCA of normalized ICOS PET ROI values. Each arrow represents the relative contribution of each ROI. (C) ROC analysis showing sensitivity against 1 − specificity for distinguishing GvHD mice from other cohorts based on PET ROI values for organs identified by the PCA analysis (spleen, mLN, and intestine) and for muscle as a negative control.
Assessment of 89Zr-DFO-ICOS mAb PET imaging as a potential tool for gastrointestinal GvHD early diagnosis. (A) Heatmap visualization and hierarchical clustering of normalized ICOS PET ROI values (rows) from single transplant recipients (columns). Data shown are pooled from 2 independent experiments. (B) PCA of normalized ICOS PET ROI values. Each arrow represents the relative contribution of each ROI. (C) ROC analysis showing sensitivity against 1 − specificity for distinguishing GvHD mice from other cohorts based on PET ROI values for organs identified by the PCA analysis (spleen, mLN, and intestine) and for muscle as a negative control.
ICOS mAb does not affect murine acute GvHD pathogenesis or the GvT effect
Targeting costimulatory molecules with antibodies can potentially have perturbative effects on T-cell biology and, therefore, impact GvHD pathogenesis, leading to increased lethality.11 To reduce the risk of potential toxicity of the 89Zr-DFO-ICOS mAb tracer, we purposefully chose an antagonist ICOS mAb (clone 7E.17G9) for this study.21 To experimentally test the safety of the ICOS mAb employed, 10 µg cold anti-ICOS or isotype control mAb was administrated at day 4 post-HCT. No significant differences were observed in GvHD score (Figure 5A) or overall survival (Figure 5B) in mice injected with anti-ICOS mAb compared with those receiving the isotype control mAb, thus indicating that anti-ICOS mAb administered at imaging doses does not exacerbate acute GvHD pathogenesis.

Administration of ICOS mAb at tracer doses does not impact murine acute GvHD or the GvT effect. GvHD score (A) and animal survival (B) after allogeneic HCT. Two-way analysis of variance was used to compare GvHD score and log-rank test to compare survival curve between GvHD mice receiving 10 μg of cold anti-ICOS mAb (continuous red line) and isotype mAb (dashed red line) IV at day 4 post–allogenic transplantation. (C) Representative in vivo BLI images of A20luc+ cell burden 7 days post-HCT in GvHD mice and BM controls having received cold anti-ICOS mAb or isotope control at day 4 post-HCT. Results are pooled from 2 independent experiments (n = 10 mice/group) and compared using a nonparametric Mann-Whitney U test.
Administration of ICOS mAb at tracer doses does not impact murine acute GvHD or the GvT effect. GvHD score (A) and animal survival (B) after allogeneic HCT. Two-way analysis of variance was used to compare GvHD score and log-rank test to compare survival curve between GvHD mice receiving 10 μg of cold anti-ICOS mAb (continuous red line) and isotype mAb (dashed red line) IV at day 4 post–allogenic transplantation. (C) Representative in vivo BLI images of A20luc+ cell burden 7 days post-HCT in GvHD mice and BM controls having received cold anti-ICOS mAb or isotope control at day 4 post-HCT. Results are pooled from 2 independent experiments (n = 10 mice/group) and compared using a nonparametric Mann-Whitney U test.
Given the antagonistic nature of the anti-ICOS clone employed, we next assessed whether its administration at imaging doses would interfere with the antitumor potential of the allogeneic HCT. Mice were injected IV with luc+ A20 lymphoma cells (2 × 10⁵) at the time of HCT. At day 4 after transplantation, mice were randomized and injected with unlabeled anti-ICOS or isotype control mAb (10 µg). Tumor progression was assessed by BLI at day 7. T cells transferred at the time of HCT in GvHD mice led to significantly lower tumor burden compared with mice receiving BM alone, for both isotype control and anti-ICOS mAb-treated mice (Figure 5C). Importantly, no significant differences in antitumor control in GvHD mice were observed between anti-ICOS or isotype control mAb treatment groups (Figure 5C). Collectively, these data demonstrate that the antagonistic anti-ICOS mAb used in our tracer neither alters the course of GvHD nor impairs the GvT effect of the HCT procedure, suggesting that ICOS immunoPET represents a safe, as well as a sensitive, approach for acute gastrointestinal GvHD diagnosis.
Discussion
Acute GvHD remains the major cause of nonrelapse mortality in allogeneic HCT recipients; early diagnosis would be greatly aided by the development of noninvasive approaches to detect global T-cell activation throughout different tissues in the body, given the key role of these cells in acute GvHD pathogenesis.
Although small-molecule PET tracers such as 18F-FDG3,4 and 18F-FAraG7 have been evaluated, their utility for acute GvHD diagnosis is limited because the metabolic pathways they target are also upregulated in other tissues or cells, which can lead to low specificity. To date, other T-cell–targeted immunoPET imaging approaches in mouse models of GvHD have suffered from a lack of sensitivity or specificity8,9 or from toxicity.11 We previously reported the preclinical development of such an immunoPET tracer targeting OX40.11 Although this approach displayed excellent sensitivity for GvHD detection in a murine model of allogeneic HCT, the tracer also exacerbated GvHD, thus preventing its clinical translation for this particular application. To circumvent these limitations, here we assessed activation markers upregulated by both murine and human T cells in GvHD mouse models and identified ICOS as a potentially suitable target for immunoPET. Our preclinical results are in agreement with the recently reported molecular profiling of T-cell subsets from patients with acute GvHD, which demonstrated that ICOS was among the genes with the highest increase in transcript levels in both CD4 and CD8 T cells.22 Consistent with our previously reported OX40-immunoPET approach, ICOS immunoPET exhibited optimal diagnostic potential in a murine model of acute GvHD. Importantly, the ICOS tracer reported here overcomes the limitations of OX40-immunoPET as the antagonistic ICOS antibody used avoids any significant toxicities on GvHD pathogenesis and does not interfere with the GvT effect, thus promoting the overall transplant success while avoiding disease relapse. These differences may be due to the use of an antagonistic mAb in lieu of an agonistic clone for the tracer, as well as the different roles of ICOS and OX40 in acute GvHD pathogenesis.23-26 Notably, ICOS has a paradoxical role in the regulation of alloreactive CD4 T cells and CD8 T cells in murine models of acute GvHD, genetic ablation of ICOS in CD4 T cells having a protective effect, and in CD8 T cells exacerbating the disease.26 For this reason, we are working on the generation of a clinical tracer with a high affinity and no agonist/antagonist and Fc-effector functions before moving to phase 1 imaging studies in HCT recipients.
Future optimization of our ICOS immunoPET imaging approach, using alternative vector formats, would allow us to minimize nonspecific binding to other cells mediated through the Fc region and also address 2 limitations of this study. First, 89Zr-labeled mAbs impart higher radiation doses to patients than 18F-radiolabeled tracers. The use of smaller engineered antibodies (scFv and nanobodies) and protein scaffolds with shorter serum half-lives would allow for the use of short-lived isotopes (eg, 18F) for convenient same-day imaging while significantly reducing the radiation dose. Second, our 89Zr-DFO-ICOS mAb tracer does not allow GvHD detection in the liver, another key target tissue, due to the hepatic accumulation of whole mAbs. The use of antibodies with a mutant Fc region, which abrogates binding to Fc receptors or smaller formats lacking the Fc region altogether and which shows renal clearance, may significantly reduce background liver signal and allow extension of this diagnostic approach beyond acute gastrointestinal GvHD. Such tracer optimization would also allow the extension of ICOS immunoPET to liver and lung imaging for diagnosis of chronic GvHD, a condition in which ICOS expression has been shown to be upregulated at the surface of pathogenic T cells.27-29
Despite the fact that our ICOS immunoPET approach specifically detects activated T cells, T-cell activation in the gastrointestinal tract is not solely restricted to GvHD and can also be observed in other transplant-related complications, namely cytomegalovirus colitis. We believe that, upon clinical translation, ICOS immunoPET will need to be integrated in the whole clinical and biological workup and that its combination with biomarkers of GvHD (ST2, REG3α) or infection (cytomegalovirus viral load) will further increase the specificity of our approach.
In conclusion, we have identified ICOS as a highly sensitive and specific imaging biomarker for the in vivo visualization of allogenic, donor-derived, activated CD4 and CD8 T cells during acute gastrointestinal GvHD. ICOS immunoPET has the potential to have significant clinical impact and improve overall management of HCT recipients by enabling early diagnosis of acute gastrointestinal GvHD.
Acknowledgments
The authors would like to acknowledge Jason Lee, Frezghi Habte, and Laura Pisani at the Stanford Center for Innovation in In-Vivo Imaging (SCI3) for their assistance with the preclinical imaging studies. They are grateful to members of the Stanford FACS facility for sharing their expertise. They thank Kenneth Lau for assistance with mass spectrometry. Special thanks to Behnaz Mobashwera and Emily Deal for editing the manuscript.
This work was supported in part from funding from the Ben & Catherine Ivy Foundation (S.S.G.), the Canary Foundation (S.S.G.); National Cancer Institute (NCI), National Institutes of Health (NIH) (grants R01-CA201719-05 [S.S.G. and M.L.J.] and R01-CA23158201 and P01-CA49605 [R.S.N.]); the Parker Institute for Cancer Immunotherapy (S.S.G. and R.S.N.); the Department of Radiology, Stanford University (I.S.A.); the Geneva University Hospitals Fellowship (F.S.); the Swiss Cancer League (BIL KLS 3806-02-2016 to F.S.); the Dubois-Ferrière-Dinu-Lipatti Foundation (F.S.); the American Society for Blood and Marrow Transplantation (New Investigator Award 2018 to F.S.); and the Geneva Cancer League (LGC 20 11 to F.S.).
We dedicate this paper to the memory of our cherished mentor and friend, Sanjiv S. Gambhir, and his extraordinary contributions to the field of molecular imaging and early disease detection.
Authorship
Contribution: Z.X., I.S.A., F.S., R.S.N., and S.S.G. conceived and designed research studies; I.S.A., F.S., and Z.X. developed methodology, conducted experiments, and acquired and analyzed data; L.S., J.K.L., and T.L.R. developed methodology, conducted experiments, and acquired data; W.C. and S.M. conducted experiments; and I.S.A., F.S., Z.X., M.L.J., and R.S.N. wrote the manuscript.
Conflict-of-interest disclosure. The authors declare no competing financial interests.
Sanjiv S. Gambhir died on 18 July 2020.
Correspondence: Robert S. Negrin, Center for Clinical Sciences Research, 269 Campus Drive, Room 2205, Stanford, CA 94305; e-mail: negrs@stanford.edu; and Israt S. Alam, Stanford University, 318 Campus Drive, Clark Center, Stanford, CA 94305; e-mail: israt@stanford.edu.

