

Key Points
EBV LMP1 enhances MYC-mediated degradation of the p27kip1 tumor suppressor and accelerates MYC-induced lymphomagenesis.
EBV LMP1 and LMP2A differentially use G1-specific cell cycle and BCR-mediated signaling to accelerate MYC-induced lymphomagenesis.

Abstract
MYC translocations in association with Epstein-Barr virus (EBV) infection are often observed in B-cell lymphomas. A subset of Burkitt lymphoma (BL) expresses EBV latent membrane proteins 1 and 2A (LMP1 and LMP2A) in addition to the typical restricted EBV latent gene expression. EBV-associated diffuse large B-cell lymphoma (DLBCL) typically exhibits latency type II or III and expresses LMP1. Here, we investigate the role of LMP1 in MYC-driven lymphomagenesis in our murine model. λ-MYC mice develop tumors having a “starry sky” appearance and have abnormal p53 expression that is also observed in human BL. LMP2A/λ-MYC double-transgenic mice develop tumors significantly faster than mice only expressing MYC. Similar to LMP2A/λ-MYC mice, LMP1/λ-MYC mice also have accelerated MYC-driven lymphomagenesis. As observed in LMP2A/λ-MYC mice, p27kip1 was degraded in LMP1/λ-MYC pretumor and tumor B cells. Coexpression of LMP1 and LMP2A resulted in the enhancement of B cell proliferation. In contrast to LMP2A, the inhibition of Syk or cyclin-dependant kinase (CDK)4/6 activity did not effectively inhibit LMP1-mediated MYC lymphomagenesis. Also, in contrast to LMP2A, LMP1 did not lessen abnormal p53 expression in λ-MYC tumors. To investigate the significance of LMP1 expression in human BL development, we reanalyzed RNA sequencing (RNA-Seq) data of primary human BL from previous studies. Interestingly, p53 mutations were less observed in LMP1-expressing BL, although they were not significantly changed by EBV infection, indicating LMP1 may lessen p53 mutations in human primary BL. This suggests that LMP1 effects in EBV-associated human BL vary from what we observe in our murine model. Finally, our studies suggest a novel pathogenic role of LMP1 in lymphomagenesis.
Introduction
MYC dysregulation and Epstein-Barr virus (EBV) infection are frequently observed in human Burkitt lymphoma (BL) tumors. BL is defined by a translocation between the MYC gene and immunoglobulin (Ig) heavy or light chain loci and is commonly associated with EBV infection. Early studies of EBV-positive BL biopsies suggested EBV latent infection exhibited restricted gene expression of EBV genes termed latency I, which included expression of EBNA1, EBERs, and BART micro RNAs.1,2 More recent studies have shown that EBV latent expression in BL is more heterogeneous than these earlier studies suggested. LMP1 and LMP2A expression has been consistently observed in BL biopsies using reverse transcription polymerase chain reaction,3-5 quantitative reverse transcription polymerase chain reaction,2,6,7 and RNA sequencing (RNA-Seq).8-10 LMP1 and LMP2A proteins are also detected depending on the specific study in 0% to 30% and 10% to 60% of EBV+ BL biopsies by immunohistochemistry, respectively.2,5,8,11 ,, -16 MYC translocations (5% to 15%) and EBV association (8% to 15%) are also observed in diffuse large B-cell lymphoma (DLBCL), where EBV gene expression is typically latency type II or III.17,18 In EBV+ DLBCL, 60% of activated B-cell (ABC)-type and 24% of germinal center (GC)-type DLBCL express LMP1.8 These observations suggest that LMP1, along with LMP2A, play a pathological role in EBV-associated lymphomagenesis, leading us to investigate pathways activated by LMP1 in our murine model of MYC-driven lymphoma.
LMP1 and LMP2A are constitutive mimics of CD40 signaling and B-cell receptor (BCR) signaling and promote B-cell survival, growth, and differentiation to establish EBV latent infection in B cells.1 In peripheral lymphoid organs, signal transduction mediated from CD40 and BCR is essential for GC formation allowing secondary lymphoid follicles to form. LMP1 and LMP2A mimic the B-cell GC reaction driving B-cell proliferation to allow the establishment of EBV latent infection in B cells. This suggests that LMP1 and LMP2A play essential roles in EBV-associated lymphoma development by mimicking CD40 and BCR signal transduction in GC B cells. By driving EBV-infected B cells into a GC-type reaction, LMP1 and LMP2A allow bypass of the normal requirement for antigen recognition, which can result in mutations such as the Ig-MYC translocation and other genomic mutations that facilitate lymphoma development.
In these studies, we investigated the role of LMP1 in lymphoma using our murine transgenic model. LMP1 has been shown to promote cell growth and inhibition of apoptosis in a variety of cell types in vitro, establishing LMP1 as a viral oncoprotein.1 The C-terminal cytoplasmic region of LMP1 contains 2 distinct functional domains referred to as C-terminal activation regions 1 and 2 (CTAR1 and CTAR2), which provide binding sites for TRAFs and TRADD, leading to activation of the NF-κB, JNK, and JAK/STAT pathways.19 A third domain, CTAR3, located between CTAR1 and CTAR2, has been suggested to be important for JAK3-association and activation, although deletion of this region has no effect on the efficiency of B-cell transformation.20 Since EBV is a strict human pathogen, transgenic mice expressing EBV latent genes have been a powerful tool for studying the mechanism of EBV-associated lymphomagenesis. Transgenic studies have demonstrated that LMP1 contributes to both B-cell and epithelial cell tumorigenesis in vivo.21-23 Eµ-LMP1 mice develop B-cell lymphomas in mice >12 months.22 LMP2A plays a critical role in the early phase of EBV-induced primary B-cell immortalization in vitro.24 As a functional homolog of BCR, LMP2A provides development and survival signals independent of the BCR to allow pro/pre-B cells to mature into peripheral B cells in transgenic mice independent of a functional BCR.25 The cytosolic domain of LMP2A contains binding sites for Src-family and Syk kinases that are essential for LMP2A-mediated survival signals as well as normal B-cell development.
The deregulation of proto-oncogene MYC plays a key role in many human cancers. In BL, the ectopic expression of MYC due to chromosomal translocations is the molecular hallmark for its tumor classification. However, MYC aberration alone is not sufficient to initiate malignancies26,27 because MYC-target genes promote both proliferation and apoptosis. To escape MYC-induced apoptosis, cells must acquire additional genetic mutations or disruption of tumor suppressor functions. Indeed, p53 is frequently mutated in BL biopsies and cell lines.28
We have used λ-MYC as a murine model of MYC-driven B-cell lymphoma. λ-MYC mice develop B-cell lymphoma with typical characteristics similar to human BL, while Eµ-Myc mice develop heterogeneous lymphoma with a leukemic component.29 A genomic study of tumors developed in Eµ-Myc mice reveals 2 majority clusters molecularly representing human BL and the ABC subgroup of DLBCL.30 Our previous studies found LMP2A/λ-MYC double transgenic mice have splenomegaly and accelerated B-cell tumor development in about 50 days, whereas the λ-MYC control mice require >150 days for tumors to form.31 We demonstrated that the degradation of cyclin-dependent kinase (CDK) inhibitor p27kip1 is a fundamental mechanism for the accelerated tumor development in LMP2A/λ-MYC mice.32,33 Tumor acceleration is greatly delayed by p27kip1 stabilization when genetic mutations in ubiquitin-ligase complexes specific for p27kip1 are introduced in LMP2A/λ-MYC mice.33,34 In contrast to LMP2A, the role of LMP1 in MYC-driven tumorigenesis has not been investigated and, as a result, is not clear. In this paper, we demonstrate that LMP1/λ-MYC mice also have accelerated MYC-driven lymphomagenesis.
Materials and methods
Mice
Eµ-LMP1,22 Eµ-LMP2A (Tg6),35 and λ-MYC mice29 were previously described. Abemaciclib (Lilly), TAK-659 (Takeda), and PF-06651600 (MedChemExpress) were administrated by oral gavage. Tumor mice were sacrificed when lymph node tumors were observed or mice were moribund. Animals were maintained at Northwestern University’s Center for Comparative Medicine in accordance with the university’s animal welfare guidelines.
Spleen and tumor cell isolation
Pretumor splenic B cells were isolated with Mouse Pan-B Cell Isolation Kit (StemCell Technologies). Tumor-bearing lymph nodes were prepared as previously described.33
Flow cytometry and cell cycle analysis
For flow cytometry, isolated cells were stained with the indicated antibodies and analyzed with a FACS-CantoII flow cytometer (BD Biosciences). IgM-FITC, CD3ε-PE, and B220-APC antibodies were purchased from BD Biosciences. Cell cycle analysis was performed as described.33 All results were analyzed with FlowJo software (FlowJo, LLC).
Immunohistochemistry
Spleens and tumor-bearing lymph nodes were fixed as described.33 Serially sectioned samples were stained with hematoxylin and eosin, anti-p27 (Abcam), or anti-B220 (BD Biosciences) antibody. Stained tissue slides were imaged using an EVOS XL Core digital inverted microscope.
Immunoblots
Isolated pretumor B cells or tumor cells were lysed and immunoblotted as described.33 Primary antibodies used included p27kip (Santa Cruz), p53 (Cell Signaling), p19ARF (GeneTex), JNK, phospho-JNK, ERK1/2, phospho-ERK1/2, p38, phospho-p38 (Cell Signaling), and Gapdh (Abcam).
Statistics
Student t test, survival analysis, and log-rank test were calculated using Prism 7 (GraphPad Software).
Results
LMP1 accelerates tumor onset in λ-MYC mice with frequent alterations in the p53 pathway
To determine the role of LMP1 expression in MYC-induced tumorigenesis, we used a murine transgenic model. Tumor-free survival curves showed that LMP1/λ-MYC mice (47 days, median) had a significant decrease in survival compared with λ-MYC mice (190 days, median), indicating that LMP1 accelerates tumor onset in λ-MYC mice (Figure 1A). In comparison with our previous studies with LMP2A/λ-MYC, the LMP1/λ-MYC mice had a similar median tumor-free survival time, exhibiting tumor-free survival of 50 days (Figure 1A). In addition, the median survival of LMP1/LMP2A/λ-MYC mice was 51 days, similar to LMP1/λ-MYC and LMP2A/λ-MYC mice (Figure 1A). These results are of particular interest since LMP1 and LMP2A are known to target very different signal transduction pathways.1 LMP1 has been shown to be a CD40 mimic,36 whereas LMP2A has been shown to be a BCR mimic.25
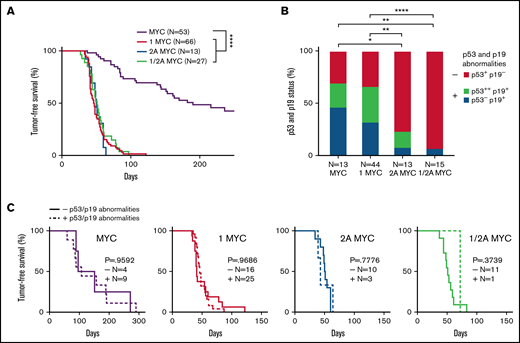
LMP1 accelerates MYC-driven tumor onset but does not alter the number of p53 and/or p19ARF abnormalities in λ-MYC tumors. (A) Kaplan-Meier curves indicate the percentage of tumor-free survival of indicated genotypes. Mice assigned for survival curve analysis were observed for tumor incidence. Days until the first sign of tumor is plotted as tumor-free survival. As found in our previous studies,31 LMP2A/λ-MYC mice are born with enlarged spleens, and lymphadenopathy can be readily detected by 5 to 6 weeks of age, whereas λ-MYC mice do not show splenomegaly or lymphadenopathy until they develop tumors. Mice between 4 and 6 weeks of age were classified as pretumor mice in our study. By 8 to 15 weeks of age, LMP1/λ-MYC and LMP2A/λ-MYC tumors are observed in cervical and axillary lymph nodes and then spread to other areas, including inguinal and abdominal lymph nodes. Tumor development in λ-MYC mice is generally observed after 20 to 30 weeks of age. In the mice of these ages, all tumors we analyzed showed a starry sky appearance typical for human BL. In contrast to LMP1/λ-MYC and LMP2A/λ-MYC tumors, primary organs in which λ-MYC tumors are first observed were not restricted to cervical areas but varied from cervical to abdominal areas. Tumor onset in λ-MYC mice in which tumors initiated in cervical areas was earlier (78.5 days, median survival) when compared with λ-MYC mice where tumors initiated in abdominal areas (156 days, median survival) (supplemental Figure 1C). Similar early- and late-tumor onsets were also reported in the studies of Eµ-Myc mice.59 Even though tumor onsets in LMP1/λ-MYC and LMP2A/λ-MYC mice were significantly earlier than the onset of λ-MYC tumors in the cervical area. Log-rank (Mantel-Cox) test was used to compare survival curves. ****P < .0001. (B) The status of p53 and p19ARF expression in lymph node tumors from the indicated genotypes as determined from immunoblots (supplemental Figure 2) are as indicated: p53+ and p19−, baseline p53 and p19ARF levels; p53−, undetected baseline level of p53; p53++, aberrant p53 accumulation at ∼53 kDa; p19+, abnormal accumulation of p19ARF. Fisher’s exact test was used to compare the abnormalities of p53 and p19ARF proteins. *P < .05, **P < .01, ***P < .001, and ****P < .0001. (C) Kaplan-Meier curves of tumor-free survival percentages with or without p53 and/or p19ARF abnormalities indicated by “+” or “−”. P values were calculated by log-rank (Mantel-Cox) test.
LMP1 accelerates MYC-driven tumor onset but does not alter the number of p53 and/or p19ARF abnormalities in λ-MYC tumors. (A) Kaplan-Meier curves indicate the percentage of tumor-free survival of indicated genotypes. Mice assigned for survival curve analysis were observed for tumor incidence. Days until the first sign of tumor is plotted as tumor-free survival. As found in our previous studies,31 LMP2A/λ-MYC mice are born with enlarged spleens, and lymphadenopathy can be readily detected by 5 to 6 weeks of age, whereas λ-MYC mice do not show splenomegaly or lymphadenopathy until they develop tumors. Mice between 4 and 6 weeks of age were classified as pretumor mice in our study. By 8 to 15 weeks of age, LMP1/λ-MYC and LMP2A/λ-MYC tumors are observed in cervical and axillary lymph nodes and then spread to other areas, including inguinal and abdominal lymph nodes. Tumor development in λ-MYC mice is generally observed after 20 to 30 weeks of age. In the mice of these ages, all tumors we analyzed showed a starry sky appearance typical for human BL. In contrast to LMP1/λ-MYC and LMP2A/λ-MYC tumors, primary organs in which λ-MYC tumors are first observed were not restricted to cervical areas but varied from cervical to abdominal areas. Tumor onset in λ-MYC mice in which tumors initiated in cervical areas was earlier (78.5 days, median survival) when compared with λ-MYC mice where tumors initiated in abdominal areas (156 days, median survival) (supplemental Figure 1C). Similar early- and late-tumor onsets were also reported in the studies of Eµ-Myc mice.59 Even though tumor onsets in LMP1/λ-MYC and LMP2A/λ-MYC mice were significantly earlier than the onset of λ-MYC tumors in the cervical area. Log-rank (Mantel-Cox) test was used to compare survival curves. ****P < .0001. (B) The status of p53 and p19ARF expression in lymph node tumors from the indicated genotypes as determined from immunoblots (supplemental Figure 2) are as indicated: p53+ and p19−, baseline p53 and p19ARF levels; p53−, undetected baseline level of p53; p53++, aberrant p53 accumulation at ∼53 kDa; p19+, abnormal accumulation of p19ARF. Fisher’s exact test was used to compare the abnormalities of p53 and p19ARF proteins. *P < .05, **P < .01, ***P < .001, and ****P < .0001. (C) Kaplan-Meier curves of tumor-free survival percentages with or without p53 and/or p19ARF abnormalities indicated by “+” or “−”. P values were calculated by log-rank (Mantel-Cox) test.
Mutation or inhibition of the p53 pathway is a major mechanism for dysregulated MYC overexpression in B cells, leading to malignancy.37 Aberrant accumulation or stabilization of p53 and/or p19ARF is often used as a readout for inactivation of the p53 pathway.31,33,37 λ-MYC lymphomas exhibit frequent mutations in the p53 pathway to avoid MYC-mediated apoptosis, similar to human BL.31 We found that LMP1/λ-MYC mice frequently had an abnormal expression of p53 and p19ARF, similar to that observed in λ-MYC mice tumors (Figure 1B). Although LMP1 greatly accelerated tumor onset, LMP1/λ-MYC tumors demonstrated a higher frequency of p53-pathway protein alterations very similar to that observed with λ-MYC–only tumors, suggesting a different mechanism of tumorigenesis in LMP1/λ-MYC tumors compared with LMP2A/λ-MYC tumors. LMP2A similarly accelerates MYC-driven lymphoma without protein alterations in the p53 pathway (Figure 1B).31 When tumor-free survival is grouped by the presence or absence of p53 and/or p19ARF abnormalities, there was no significant difference between each group of LMP1/λ-MYC tumors (Figure 1C), consistent with our previous results with LMP2A mice.33
LMP1 increases splenic B-cell populations at the pretumor stage in λ-MYC mice
Similar to our previous studies,31 4-week-old LMP2A/λ-MYC mice had increases in normalized spleen weights (Figure 2A) and splenic B-cell populations (Figure 2B-C) compared with λ-MYC and wild-type (WT) mice. LMP1 expression resulted in increased spleen weight in LMP1/λ-MYC mice, which was smaller when compared with LMP2A/λ-MYC spleens (Figure 2A). LMP1 also increased B-cell populations in spleens (Figure 2B-C). When LMP1 and LMP2A were coexpressed in λ-MYC B cells, spleen mass and B-cell populations were larger when compared with LMP1/λ-MYC mice, indicating a cooperative effect on MYC-driven B-cell proliferation when both LMP1 and LMP2A are expressed (Figure 2A-B). Consistent with previous studies, surface IgM+ expression of λ-MYC splenic B cells was 54.3% (Figure 2D). In LMP2A/λ-MYC and LMP1/LMP2A/λ-MYC, B cells were negative for IgM expression (Figure 2D). In LMP1/λ-MYC mice, the IgM-negative pre-B phenotype was dominant because only 19.4% of splenic B cells were IgM+ (Figure 2D).
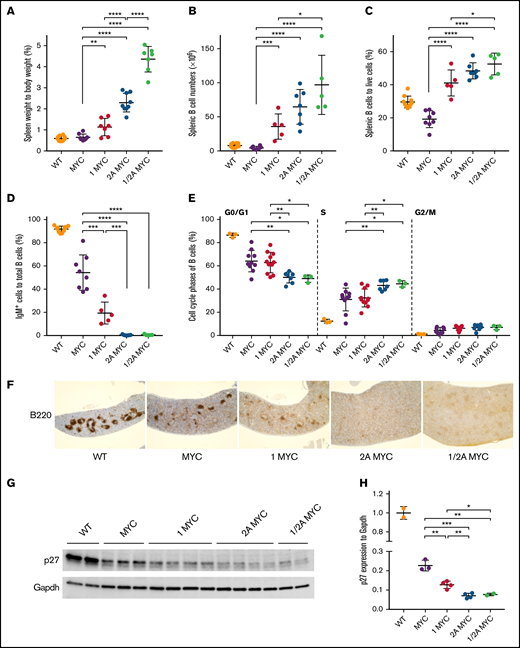
LMP1 decreases p27 expression and increases B-cell numbers in the pretumor spleens of λ-MYC mice. (A) Spleens were isolated from 4-week-old mice at the pretumor stage, and spleen weight as a percentage of body weight is shown. Lymphocytes were isolated from spleens of pretumor mice, and their B-cell numbers (B) and percentages (C) were calculated by B220 positivity using flow cytometry. (D) The percentage of IgM-positive cells to total splenic B cells was calculated by staining with anti-IgM. (E) The cell cycle phases of purified splenic pretumor B cells from 4-week-old mice are shown. Purified pretumor B cells were fixed in 70% ethanol and stained with a Ki-67–FITC antibody. DNA was stained with propidium–iodide/ribonuclease staining buffer according to the manufacturer’s instructions (BD Biosciences). (F) Representative immunohistochemical analysis of 4-week-old mouse spleens from each genotype stained with B220 (original magnification ×4). Splenomegaly was observed in LMP2A/λ-MYC and LMP1/LMP2A/λ-MYC spleens. (G) Representative immunoblots of p27kip1 expression in purified splenic B cells from 4-week-old mice. (H) P27kip1 expressions were normalized to Gapdh (a loading control). Dot plot graphs represent the mean ± standard deviation. P values were calculated by unpaired t test, *P < .05, **P < .01, ***P < .001, and ****P < .0001.
LMP1 decreases p27 expression and increases B-cell numbers in the pretumor spleens of λ-MYC mice. (A) Spleens were isolated from 4-week-old mice at the pretumor stage, and spleen weight as a percentage of body weight is shown. Lymphocytes were isolated from spleens of pretumor mice, and their B-cell numbers (B) and percentages (C) were calculated by B220 positivity using flow cytometry. (D) The percentage of IgM-positive cells to total splenic B cells was calculated by staining with anti-IgM. (E) The cell cycle phases of purified splenic pretumor B cells from 4-week-old mice are shown. Purified pretumor B cells were fixed in 70% ethanol and stained with a Ki-67–FITC antibody. DNA was stained with propidium–iodide/ribonuclease staining buffer according to the manufacturer’s instructions (BD Biosciences). (F) Representative immunohistochemical analysis of 4-week-old mouse spleens from each genotype stained with B220 (original magnification ×4). Splenomegaly was observed in LMP2A/λ-MYC and LMP1/LMP2A/λ-MYC spleens. (G) Representative immunoblots of p27kip1 expression in purified splenic B cells from 4-week-old mice. (H) P27kip1 expressions were normalized to Gapdh (a loading control). Dot plot graphs represent the mean ± standard deviation. P values were calculated by unpaired t test, *P < .05, **P < .01, ***P < .001, and ****P < .0001.
We previously demonstrated that LMP2A cooperates with MYC to disrupt the G1 cell cycle checkpoint leading to the proliferation of pretumor B cells.32,33 LMP1/λ-MYC exhibited increased S-phase B cells similar to λ-MYC mice when compared with WT B cells; however, there were fewer S-phase B cells compared with LMP2A/λ-MYC (Figure 2E). Next, we investigated B-cell follicle formation using B220 immunohistochemistry. Typical B-cell follicles were seen in WT mice (Figure 2F). In λ-MYC mice, B-cell follicles form with some disruption, with fewer large follicles observed (Figure 2F). In LMP1/λ-MYC spleens, fewer follicles formed, and those that did were much smaller than in WT mice (Figure 2F). Finally, the normal architecture and formation of B cell follicles were completely absent in LMP2A/λ-MYC and LMP1/LMP2A/λ-MYC spleens as previously reported for LMP2A/λ-MYC.33
We also investigate the levels of p27kip1 in the same genotypes. LMP2A functions to promote the cell cycle and proliferation by enhancing MYC-induced degradation of the cell-cycle inhibitor p27kip1 through the E3-ubiquitin ligases.32,33 LMP1 decreased p27kip1 expression compared with λ-MYC alone (Figure 2G-H). However, the p27kip1 decrease observed in LMP1/λ-MYC was smaller than that of LMP2A/λ-MYC. Overall, our results suggest that LMP1, like LMP2A, promotes B-cell proliferation by downregulating p27kip1 expression in pretumor spleens.
Low-level p27 expression in LMP1/λ-MYC tumors
Histologic analysis of the various tumors exhibited characteristics similar to human BL with a starry sky appearance (Figure 3A). This was seen in LMP1/λ-MYC and LMP1/LMP2A/λ-MYC tumors, as well as in λ-MYC and LMP2A/λ-MYC tumors, consistent with our previous results (Figure 3A). Flow-cytometric analysis showed that LMP1/λ-MYC tumors were nearly all B cells (Figure 3B). Fifty-five percent of λ-MYC and 25% of LMP1/λ-MYC tumor B cells were IgM+, respectively (Figure 3C). In contrast, LMP2A/λ-MYC and LMP1/LMP2A/λ-MYC tumors were all negative for IgM expression (Figure 3C). We next investigated the levels of p27kip1 in LMP1/λ-MYC tumors. Histologic analysis indicated that the p27kip1 expression in LMP1/λ-MYC tumors was low, as observed in LMP2A/λ-MYC tumors (Figure 3A). In immunoblots, LMP1/λ-MYC tumors expressed low levels of p27kip1, which was similar to LMP2A/λ-MYC but less than λ-MYC tumors (Figure 3D-E). These results indicated that LMP1 decreases p27kip1 expression in the presence of the λ-MYC gene.
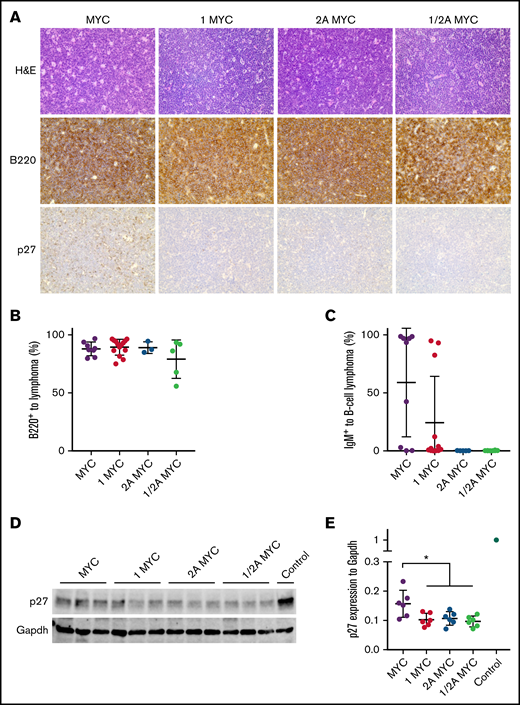
LMP1/λ-MYC B-cell lymphomas have decreased p27 expression. (A) Representative immunohistochemical analysis of lymph node tumors from 3 to 6 mice of each genotype. Tumors were isolated from the cervical area in LMP1/λ-MYC, LMP2A/λ-MYC, and LMP1/LMP2A/λ-MYC mice and from cervical or abdominal locations in λ-MYC mice. Formalin-fixed samples were stained with hematoxylin and eosin, B220, and p27kip1 using an EVOS XL microscope with 40× magnification. (B) Percentages of B-cell lymphoma cells to total prepared tumor cells were calculated by flow cytometry staining for B220. Isolated lymphoma cells were prepared using a nylon mesh. (C) Percentages of IgM+ cells in total B220+ lymphoma cells are indicated. (D) Representative immunoblots of p27kip1 expression in purified tumor cells. Prepared tumor samples from LMP2A/λ-MYC/Cks1−/− in which p27kip levels were similar to WT splenic B cells were used as a control. (E) P27kip1 expression was normalized to Gapdh. Dot plot graphs represent the mean ± standard deviation. P values were calculated by unpaired t test, *P < .05.
LMP1/λ-MYC B-cell lymphomas have decreased p27 expression. (A) Representative immunohistochemical analysis of lymph node tumors from 3 to 6 mice of each genotype. Tumors were isolated from the cervical area in LMP1/λ-MYC, LMP2A/λ-MYC, and LMP1/LMP2A/λ-MYC mice and from cervical or abdominal locations in λ-MYC mice. Formalin-fixed samples were stained with hematoxylin and eosin, B220, and p27kip1 using an EVOS XL microscope with 40× magnification. (B) Percentages of B-cell lymphoma cells to total prepared tumor cells were calculated by flow cytometry staining for B220. Isolated lymphoma cells were prepared using a nylon mesh. (C) Percentages of IgM+ cells in total B220+ lymphoma cells are indicated. (D) Representative immunoblots of p27kip1 expression in purified tumor cells. Prepared tumor samples from LMP2A/λ-MYC/Cks1−/− in which p27kip levels were similar to WT splenic B cells were used as a control. (E) P27kip1 expression was normalized to Gapdh. Dot plot graphs represent the mean ± standard deviation. P values were calculated by unpaired t test, *P < .05.
Restoration of p27kip expression by Cks1 knockout does not change tumor onset in LMP1/λ-MYC mice
Our previous studies found that the acceleration of LMP2A/λ-MYC tumor onset is blocked by the inhibition of p27kip1 degradation through the knockout of Cks1, a component of the SCFSkp2 ubiquitin-ligase complex.33 Since tumor onset acceleration and p27kip1 degradation was observed in both LMP1/λ-MYC and LMP2A/λ-MYC, Cks1−/− mice were crossed to LMP1/λ-MYC mice to examine the importance of p27kip1 degradation in LMP1-mediated tumorigenesis. Cks1−/− tumors exhibited high p27kip1 expression in both LMP1/λ-MYC and LMP2A/λ-MYC groups (Figure 4A-C), indicating that LMP1/λ-MYC tumors had p27kip1 degradation mediated through the SCFSkp2 ubiquitin-ligase complex. Unexpectedly, Cks1−/− did not delay tumor onset in LMP1/λ-MYC mice in contrast to what is observed in LMP2A/λ-MYC mice (Figure 4D). These results indicate that despite similar levels of p27kip1 degradation in the LMP1/λ-MYC mice when compared with LMP2A/λ-MYC, the mechanism that drives the rapid tumor onset is different between LMP1/λ-MYC and LMP2A/λ-MYC mice.
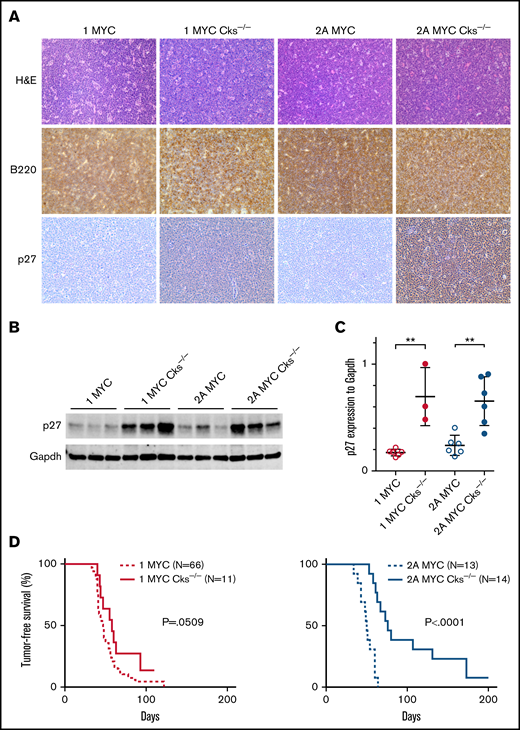
Cks1 knockout restores p27kip expression but does not change tumor onset in LMP1/λ-MYC mice. (A) Representative immunohistochemical analysis of lymph node tumors from 3 to 6 mice of each genotype stained with hematoxylin and eosin, B220, and p27kip1 using an EVOS XL microscope with 40× magnification. All tumors were isolated from the cervical area. (B) Representative immunoblots of p27kip1 expression in tumor cells. We previously reported that the p27kip levels in LMP2A/λ-MYC/Cks1−/− tumors were similar to WT splenic B cells.33 (C) P27kip1 expression was normalized to Gapdh. Dot plot graphs represent the mean ± standard deviation. P values were calculated by unpaired t test, **P < .01. (D) Kaplan-Meier curves indicate tumor-free survival percentages with or without Cks1 knockout in the background of LMP1/λ-MYC or LMP2A/λ-MYC mice.
Cks1 knockout restores p27kip expression but does not change tumor onset in LMP1/λ-MYC mice. (A) Representative immunohistochemical analysis of lymph node tumors from 3 to 6 mice of each genotype stained with hematoxylin and eosin, B220, and p27kip1 using an EVOS XL microscope with 40× magnification. All tumors were isolated from the cervical area. (B) Representative immunoblots of p27kip1 expression in tumor cells. We previously reported that the p27kip levels in LMP2A/λ-MYC/Cks1−/− tumors were similar to WT splenic B cells.33 (C) P27kip1 expression was normalized to Gapdh. Dot plot graphs represent the mean ± standard deviation. P values were calculated by unpaired t test, **P < .01. (D) Kaplan-Meier curves indicate tumor-free survival percentages with or without Cks1 knockout in the background of LMP1/λ-MYC or LMP2A/λ-MYC mice.
λ-MYC and LMP1/λ-MYC tumors show partial resistance to CDK4/6 inhibitor abemaciclib treatment, while LMP2A/λ-MYC tumors are susceptible
To understand why genetic inhibition of p27kip1 degradation did not affect LMP1/λ-MYC tumor onset, as shown in Figure 4, we used abemaciclib, a selective inhibitor for CDK4 and CDK6. The kinase activities of CDK4/6 are important for G1-phase progression and are restricted to the G1-S phase by the regulatory subunits d-type cyclins and CDK inhibitors p16INK4a and p27kip1. First, mice before tumor development at 5 weeks of age were treated with abemaciclib. As shown in our previous studies, LMP2A/λ-MYC mice are born with enlarged spleens, and lymphadenopathy can be readily detected by 5 to 6 weeks of age, whereas λ-MYC mice do not show splenomegaly or lymphadenopathy until tumors develop. Tumor development in λ-MYC mice is generally observed after 25 to 30 weeks of age.31,38 LMP1/λ-MYC mice demonstrated splenomegaly and lymphadenopathy by 5 to 6 weeks of age (Figure 5A). Abemaciclib treatment reduced splenomegaly and lymphadenopathy in both LMP1/λ-MYC and LMP2A/λ-MYC mice compared with buffer controls, and the mass of spleens and lymph nodes in these mice was decreased to the levels of WT or λ-MYC mice after the treatment (Figure 5A). This indicates that the robust growth observed in pretumor B cells before the development of tumors is sensitive to treatment with abemaciclib.
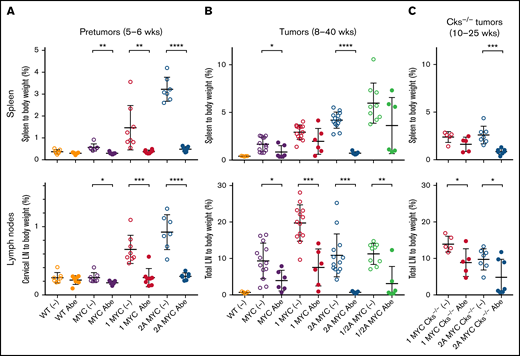
LMP2A/λ-MYC tumors are sensitive to CDK4/6 inhibitor abemaciclib treatment, whereas λ-MYC and LMP1/λ-MYC tumors are resistant. (A) 5-week-old pretumor mice of indicated phenotypes were treated with 1XPBS 0.5% methylcellulose as vehicle only (−) or 100 mg/kg per day abemaciclib (Abe) via oral gavage daily for 7 days and then sacrificed for the analysis at 6 weeks. Percentage masses of cervical lymph nodes were calculated for spleen and cervical lymph nodes. (B) Mice harboring tumors at ages of 8 to 40 weeks were treated with 1XPBS 0.5% methylcellulose only (−) or 100 mg/kg per day Abe daily for 7 days, and the percentage mass of spleen and total lymph node tumors developed in cervical, axillary, abdominal, and thoracic area were analyzed. Equivalent-age WT mice not treated with Abe were included as no tumor controls. (C) LMP2A/λ-MYC/Cks1−/− mice harboring tumors at the ages of 10 to 25 weeks were treated with 1XPBS 0.5% methylcellulose only (−) or 100 mg/kg per day Abe daily for 7 days, and their percentage mass of spleen and total lymph node tumors were analyzed. Dot plot graphs represent the mean ± standard deviation. P values were calculated by unpaired t test, *P < .05, **P < .01, ***P < .001, and ****P < .0001.
LMP2A/λ-MYC tumors are sensitive to CDK4/6 inhibitor abemaciclib treatment, whereas λ-MYC and LMP1/λ-MYC tumors are resistant. (A) 5-week-old pretumor mice of indicated phenotypes were treated with 1XPBS 0.5% methylcellulose as vehicle only (−) or 100 mg/kg per day abemaciclib (Abe) via oral gavage daily for 7 days and then sacrificed for the analysis at 6 weeks. Percentage masses of cervical lymph nodes were calculated for spleen and cervical lymph nodes. (B) Mice harboring tumors at ages of 8 to 40 weeks were treated with 1XPBS 0.5% methylcellulose only (−) or 100 mg/kg per day Abe daily for 7 days, and the percentage mass of spleen and total lymph node tumors developed in cervical, axillary, abdominal, and thoracic area were analyzed. Equivalent-age WT mice not treated with Abe were included as no tumor controls. (C) LMP2A/λ-MYC/Cks1−/− mice harboring tumors at the ages of 10 to 25 weeks were treated with 1XPBS 0.5% methylcellulose only (−) or 100 mg/kg per day Abe daily for 7 days, and their percentage mass of spleen and total lymph node tumors were analyzed. Dot plot graphs represent the mean ± standard deviation. P values were calculated by unpaired t test, *P < .05, **P < .01, ***P < .001, and ****P < .0001.
Next, LMP1/λ-MYC mice with palpable tumors were treated with abemaciclib, and tumor growth was examined. By 8 to 15 weeks of age, LMP1/λ-MYC tumors are observed in lymph nodes, including cervical, axillary, inguinal, and abdominal areas. The percentage of lymph node tumors to body mass in LMP1/λ-MYC mice was 19.7%, which was significantly larger than 9.3% in λ-MYC or 10.9% in LMP2A/λ-MYC mice (Figure 5B). After treatment of LMP1/λ-MYC mice, masses were decreased compared with buffer controls, with 7.5% of the remaining tumor burden resistant to abemaciclib (Figure 5B). Similarly, 3.9% of the tumor mass was resistant in λ-MYC mice (Figure 5B). The spleens were also resistant after treatment in LMP1/λ-MYC and λ-MYC mice (Figure 5B), indicating that tumor cells were present in spleens at the time tumors were palpable. In contrast, the percent mass of LMP2A/λ-MYC tumors was reduced to the levels observed in no tumor WT control subjects (Figure 5B), indicating that LMP2A-mediated tumors were completely susceptible to abemaciclib treatment. In LMP1/LMP2A/λ-MYC mice, tumors appeared to be a mixture of LMP1/λ-MYC–like resistance and LMP2A/λ-MYC–like susceptibility (Figure 5B). Taken together, these pharmacological results indicated that both λ-MYC and LMP1/λ-MYC tumors were partially resistant to the CDK4/6 inhibitor treatment, whereas LMP2A/λ-MYC and LMP1/LMP2A/λ-MYC are not as resistant as the LMP1/λ-MYC tumors.
Cks1-deficient LMP2A/λ-MYC tumors are resistant to CDK4/6 inhibitor abemaciclib
Our previous studies and Figure 4 show that Cks1−/− downregulated tumor onset in LMP2A/λ-MYC mice as well as λ-MYC mice.33 To examine if Cks1−/− affects resulting tumor phenotypes, Cks1−/− tumors were treated with abemaciclib. We found that 43% of lymph node tumors in LMP2A/λ-MYC/Cks−/− mice were resistant to abemaciclib treatment (Figure 5C), which contrasts with the results with LMP2A/λ-MYC tumors where all tumors were susceptible (Figure 5B). This indicates that Cks1−/− reduced tumor susceptibility to abemaciclib, similar to that of the λ-MYC tumors. As might be expected by the results with the LMP1/λ-MYC mice described above, lymph node tumors in LMP1/λ-MYC/Cks−/− mice varied in regard to their sensitivity to abemaciclib (Figure 5C). These suggest that tumors developed in the background of Cks1−/− may require additional mutations to be resistant to cell-cycle inhibition.
LMP1/λ-MYC tumor development is resistant to Syk or Jak3 inhibition
Our previous gene expression profile analysis of B cells from LMP2A/λ-MYC and λ-MYC mice indicated many phenotypic differences and changes in gene expression in pretumor B cells, but the transcriptional profiles of the tumor cells were strikingly similar.39 We also found fewer changes in gene expression in the transition from a pretumor B cell to a tumor B cell in LMP2A/λ-MYC mice compared with λ-MYC mice.39 This lead to our hypothesis that LMP2A is most important early in tumorigenesis by promoting survival in the presence of deregulated MYC while additional cellular changes are acquired for tumors to develop. To further investigate this hypothesis, changes in expression and phosphorylation downstream of LMP1 or LMP2A were determined in pretumor and tumor cells. Our results show MYC-induced JNK1 phosphorylation at T183 and Y185 as previously reported40 (Figure 6A). Interestingly, JNK1 phosphorylation in LMP2A/λ-MYC was more elevated in pretumor but returned to WT levels after the transition to tumor (Figure 6A). In contrast, JNK1 phosphorylation in LMP1/λ-MYC was repressed in pretumor and remained low in tumors (Figure 6B). The JNK family has been implicated in the pathogenesis of a number of tumor types. This result suggests that JNK activation may be critical for the proliferation of LMP2A/λ-MYC before tumors occur.
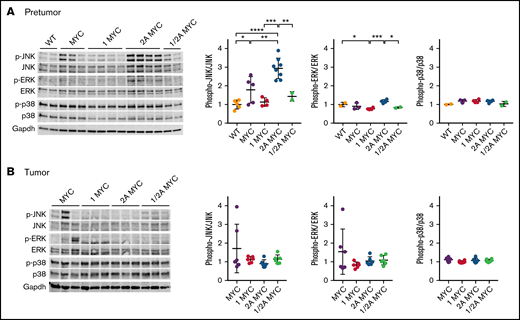
LMP1 restores MYC-induced p-JNK expression, while LMP2A further increases p-JNK levels. Expression of MAPK family proteins in purified splenic B cells from (A) 4-week-old mice and (B) in tumor B cells. Representative immunoblots of MAPK family proteins are indicated. Phosphorylated JNK, phosphorylated ERK, and phosphorylated p38 expression were normalized to JNK, ERK, and p38, respectively. Dot plot graphs represent the mean ± standard deviation. P values were calculated by unpaired t test, *P < .05, **P < .01, ***P < .001, and ****P < .0001.
LMP1 restores MYC-induced p-JNK expression, while LMP2A further increases p-JNK levels. Expression of MAPK family proteins in purified splenic B cells from (A) 4-week-old mice and (B) in tumor B cells. Representative immunoblots of MAPK family proteins are indicated. Phosphorylated JNK, phosphorylated ERK, and phosphorylated p38 expression were normalized to JNK, ERK, and p38, respectively. Dot plot graphs represent the mean ± standard deviation. P values were calculated by unpaired t test, *P < .05, **P < .01, ***P < .001, and ****P < .0001.
To investigate the important pathways for the development of LMP1 or LMP2A-mediated MYC tumorigenesis, LMP1/λ-MYC and LMP2A/λ-MYC tumors were tested with selective inhibitors specific for signal transducers downstream of LMP1 and LMP2A. LMP2A specifically binds to the Lyn and Syk PTKs, which are essential to mediate developmental and survival signals for B cells. Our previous studies show that LMP2A/λ-MYC tumors are susceptible to TAK-659, a selective Syk inhibitor, but λ-MYC tumors are not.41 As shown in Figure 7A, LMP1/λ-MYC tumors were decreased but not fully diminished by TAK-659, indicating that blocking Syk-mediated signal transduction pathways is insufficient to fully kill LMP1/λ-MYC tumors. This is in contrast to the reduction in tumor size observed in LMP2A/λ-MYC tumors. Next, LMP1/λ-MYC tumors were tested with PF-06651600, a selective Jak3 inhibitor since LMP1 contains a Jak3 association and activation domain. PF-06651600 treatment did not change the size of LMP1/λ-MYC tumors (Figure 7B), indicating Jak3 is not essential for the LMP1/λ-MYC tumor development. These results illustrate the different signaling pathways that LMP1 and LMP2A activate in MYC-driven lymphomagenesis.

Selective inhibitors for Syk or Jak3 do not eliminate LMP1/λ-MYC tumors. Mice harboring tumors were treated with 100 mg/kg/day TAK-659 (Syk inhibitor) daily for 10 days (A) or 25 mg/kg/day PF-06651600 (JAK3 inhibitor) daily for 10 days (B). Percentage masses were calculated for spleen and total lymph nodes. Equivalent-age WT mice were included as no tumor controls. Dot plot graphs represent the mean ± standard deviation. P values were calculated by unpaired t test, **P < .01.
Selective inhibitors for Syk or Jak3 do not eliminate LMP1/λ-MYC tumors. Mice harboring tumors were treated with 100 mg/kg/day TAK-659 (Syk inhibitor) daily for 10 days (A) or 25 mg/kg/day PF-06651600 (JAK3 inhibitor) daily for 10 days (B). Percentage masses were calculated for spleen and total lymph nodes. Equivalent-age WT mice were included as no tumor controls. Dot plot graphs represent the mean ± standard deviation. P values were calculated by unpaired t test, **P < .01.
LMP1 lessens p53 mutations in human BL
To investigate the role of LMP1 in human BL development, we reanalyzed RNA-Seq data of primary human BL from 3 previously published studies.2,27,42 ID3 and TCF3 mutations were observed in EBV-associated BL in human patients; however, LMP1 expression did not change ID3 or TCF3 mutations (supplemental Figure 4). Interestingly, p53 mutations were less observed in LMP1-expressing BL, although they were not significantly changed by EBV infection (supplemental Figure 4B). LMP1 also upregulated host replication-related genes and downregulated global genes in multiple pathways (supplemental Figures 5 and 6). These suggest that LMP1-mediated BL pathogenesis in humans differs somewhat from that observed in our transgenic model.
Discussion
Recent genomic sequencing studies have illustrated the unique genetic alterations critical for BL development. In addition to MYC, the p53 pathway is frequently mutated in BL.2,8 -10,27,43 -46 BL is often associated with EBV. Interestingly, the number of cellular mutations found in EBV-negative BL biopsies is significantly higher than observed in EBV-positive BL, suggesting that EBV lessens the requirement for mutations for lymphoma development.9,10,34 Whether EBV lessens p53 mutations in human BL is uncertain. Several studies found no relationship between EBV and p53 mutations,2,9,43 although 1 study found low p53 mutations in EBV-positive BL.10 Our analysis found no relationship between EBV and p53 mutations (supplemental Figure 4A).
Interestingly, we observed low p53 mutations in high LMP1-expressing BL (supplemental Figure 4B), indicating that LMP1 may lessen p53 mutations. However, low p53 mutations in human LMP1-high BL were inconsistent with high p53 abnormalities in LMP1/λ-MYC tumors (Figure 1B), suggesting that LMP1 effects in EBV-associated human BL are more complicated and different from what we observed in our transgenic models. Thus, our results suggest that MYC and LMP1 expression still require p53 mutations to develop murine lymphomas, whereas additional factors such as other EBV latent genes or mutation of other host genes besides p53 may be required for LMP1-expressing human BL. Alternatively, λ-MYC mice may develop tumors of non-BL subpopulations. As shown in the varied expression of B-cell–lineage marker IgM on λ-MYC tumors (Figure 3C), λ-MYC tumors are heterogeneous in B-cell development. In another murine lymphoma model, Eµ-Myc tumors are heterogeneous and exhibit similar 2-phase IgM expression.47 Interestingly, Eµ-Myc tumors are classified into 2 molecularly different subgroups: a cluster similar to human BL and a cluster similar to human ABC-DLBCL.30 Assuming that λ-MYC tumors are similarly heterogeneous as Eµ-Myc tumors, a subset of λ-MYC tumors may represent non-BL populations such as a subset of DLBCL. Interestingly, in Eµ-Myc tumors, a cluster similar to BL contains an aberrant p53 gene, whereas a cluster similar to ABC-DLBCL exhibits WT p53,30 suggesting p53 mutations determine the fate of tumors into BL or DLBCL. Considering p53 abnormalities are different in LMP1/λ-MYC and LMP2A/λ-MYC tumors, EBV may play a role in the fate of BL and DLBCL. In humans, mutations in the p53 gene occur in DLBCL patients (about 20%) and are identified in both GCB and ABC subtypes.48 Whether LMP1 or LMP2A affects p53 mutations in DLBCL remains to be elucidated. Finally, frequent mutations in cellular genes such as ID3 and TCF3 are found in BL and associated with the induction of cell survival mediated by the BCR and the promotion of tumor proliferation through cell cycle transition activated by CDK4/6−cyclin D.2,8 -10,27,43 -46 Mutations in these genes were not changed by LMP1 in our sequence analysis.
We have shown that LMP2A utilizes BL driver pathways to accelerate lymphoma development in our murine model. LMP2A activates cell proliferation through CDK4/6−cyclin D by inhibiting the cell cycle inhibitor p27 (Figure 5).32-34 LMP2A acting as a BCR mimic provides survival signals through the Syk–PI3K/Akt/mTOR pathway allowing bypass of p53-dependent apoptosis.41,49,50 Similar to LMP2A, LMP1 inhibits the cell cycle inhibitor p27 to promote cell proliferation through CDK4/6−cyclin D (Figures 2H and 3E). In contrast to LMP2A, significant but minor effects of genetic and pharmacologic cell cycle inhibition were observed in LMP1-mediated MYC lymphomagenesis (Figure 5). We have also shown that Syk–PI3K/Akt/mTOR axis is essential for LMP2A-accelerated MYC-driven lymphoma development.32 -34,41,49 -51 In contrast, the role of LMP1 in MYC-driven lymphoma had not been tested. Similar to an earlier study20 but in contrast to another,52 we show that Jak3 activation is not essential for LMP1/λ-MYC lymphomagenesis by use of a Jak3 inhibitor. Since molecular profiles of BL are conserved and homogenous when compared with other lymphomas,53-57 it is probable that EBV infection in BL functionally replaces some of the oncogenic events that occur in EBV-negative BL. Thus, LMP1/λ-MYC may recapitulate some oncogenic events observed in LMP2A/λ-MYC tumors. BCR-mediated signaling may be a key pathway. In support of this conclusion, the inhibition of Syk or CDK4/6 not only diminished LMP2A/λ-MYC tumors but also significantly reduced the size of LMP1/λ-MYC tumors. BCR-mediated cell cycle regulation appears to provide an important oncogenic event in the lymphoma development in our murine model. It is unknown if LMP1 enhances BCR/LMP2A-mediated lymphomagenesis or independently mediates its own driver signals. The cooperative enhancement of B-cell proliferation and tumorigenesis of LMP1 and LMP2A coexpression is suggestive that they might act in concert in human lymphoma (Figure 2). In support of this idea, previous studies have shown that coexpression of LMP1 and LMP2A in murine GC B cells causes lymphoproliferative disease upon suppression of T and natural killer cells that are not observed with LMP1 or LMP2A alone.58 Defining the role of LMP1 and LMP2A in lymphoma will provide a better understanding of EBV-mediated and EBV-negative lymphomagenesis.
We have identified several effective preclinical pathways that may lead to novel therapeutic strategies for targeted therapy, including CDK4/6 in this study and Lyn−Syk−mTOR pathways in our previous studies.41,49,50 We have developed murine models for EBV-associated lymphoma, which provide the basis to clarify the role of EBV in B-cell lymphomagenesis and provide a scientific foundation for therapeutically targeting EBV-related lymphoma.
Acknowledgments
The authors appreciate the help and advice from members of the Longnecker Laboratory.
This research was supported by CA073507 (R.L. and M.I.), the American Cancer Society, a supplement grant from the Cancer Center (P30CA060553 [M.I.]), and Lilly (R.L. and M.I.). LMP1 transgenic mice were kindly provided by Nancy Raab-Traub. Abemaciclib was obtained from Lilly. The TAK-659 compound was obtained from Millennium Pharmaceuticals Inc., a wholly-owned subsidiary of Takeda Pharmaceutical Company Limited (Cambridge, MA), under a material transfer agreement. Millennium and Lilly were not involved in the research or the drafting of this article.
Funding support for this article was provided by the Lilly, Non-clinical research grant and the National Institutes of Health, National Cancer Institute grant R01 CA073507.
Authorship
Contribution: M.I. and R.L. conceived the study and wrote the manuscript; M.I. supervised and performed the experiments with S.J.S.; C.K.H. performed the RNA-Seq analysis; and M.I. analyzed the experimental data.
Conflict-of-interest disclosure: The authors declare no competing financial interests.
Correspondence: Richard Longnecker, Department of Microbiology and Immunology, Feinberg School of Medicine, Northwestern University, 303 E Chicago Avenue, Chicago, IL 60611; e-mail: r-longnecker@northwestern.edu.

