

Key Points
Patients with impaired pretransplant kidney function demonstrated by mGFR <65 mL/min/1.73 m2 may be at a higher risk of NRM and infection.
Using mGFR pretransplant to assess clearance in patients with allogeneic HSCT may be preferred to standard creatinine-based eGFR strategies.

Abstract
The reduced-intensity conditioning regimen, fludarabine and melphalan, is frequently used in allogeneic hematopoietic stem cell transplantation (HSCT). Melphalan and the active metabolite of fludarabine, F-ara-A, are excreted via the kidneys. Existing methods to assess clearance in this setting are based on serum creatinine, which has known limitations for glomerular filtration rate (GFR) estimation in patients with malignancy. Measured GFR (mGFR) may better predict drug dosing to mitigate toxicity and increase the chances of successful engraftment. The primary objective of this study was to assess the association between mGFR and risk for nonrelapse mortality (NRM) in patients who have undergone allogeneic HSCT receiving conditioning with fludarabine and melphalan. In the 109 included patients, mGFR <65 mL/min/1.73 m2 predicted a significantly higher rate of overall NRM (hazard ratio [HR], 2.13; 95% confidence interval [CI], 1.03-4.35; P = 04) and 1-year incidence of infection (HR, 2.63; 95% CI, 1.54-4.55; P < .001) in addition to a significantly lower 2-year survival (P = .019). Kidney function estimated via estimated GFR (eGFR) and estimated creatinine clearance did not correlate with posttransplant outcomes. These results suggest that mGFR is a promising approach for assessing clearance in patients who have undergone allogeneic HSCT and may be preferred to standard creatinine-based eGFR strategies.
Introduction
Fludarabine and melphalan are frequently used in reduced-intensity conditioning (RIC) before allogeneic hematopoietic stem cell transplant (HSCT).1-3 The dose-limiting toxicity of fludarabine is neurotoxicity and the dose-limiting toxicity of melphalan is mucositis and marrow aplasia.4-7 In HSCT, both agents are dosed based on body surface area calculations and may be reduced for kidney dysfunction per provider discretion; however, it is unclear if current dose-reduction strategies provide an adequate reduction in toxicity without compromising engraftment or relapse.8 Therefore, a deeper understanding of their dosing in HSCT patients is necessary to balance the risks of toxicity and graft failure.
The parent drug fludarabine is rapidly converted to its active metabolite, F-ara-A, upon intravenous administration.9 Approximately 60% of F-ara-A is excreted via the kidneys.10 An elevated concentration of fludarabine’s active metabolite F-ara-A has been associated with a greater risk of treatment-related mortality.4,9 Low fludarabine exposure has been associated with a greater risk of graft failure.9 Kidney function and body size have been identified as factors influencing fludarabine exposure.11,12 Expert opinion suggests fludarabine dose reductions of 20% to 25% for patients with mild to moderate dysfunction (estimated creatinine clearance [eCrCl], 30-70 mL/min) and up to 50% dose reduction for patients with severe dysfunction (eCrCl <30 mL/min) or receiving dialysis.8
Melphalan is primarily eliminated by hydrolysis with ∼15% of the drug eliminated via the kidneys.13 Creatinine clearance, fat free mass, and hematocrit have been identified as factors that may influence a patient’s exposure to melphalan; increased exposure has been linked to increased rates of mucositis and longer hospital admissions.14 Expert opinion recommends reducing melphalan to 100 to 140 mg/m2 for patients undergoing HSCT with baseline kidney dysfunction.8
The best method to assess kidney function in who have undergone allogeneic HSCT patients is unknown, and different centers have different practices based on availability of testing methods and provider preferences. At this time, there is no consensus statement on which method of glomerular filtration rate (GFR) should be assessed in the pre-HSCT setting in clinical practice. The use of a creatinine-based approach to estimated GFR (eGFR) is accessible, inexpensive, and rapidly performed. Creatinine is the terminal byproduct of skeletal muscle catabolism and thus could be affected by nonrenal factors that are common in patients with cancer, including cachexia and malnutrition. These features limit the accuracy of a creatinine-based eGFR using calculation such as Cockcroft-Gault equation and the 2009 Chronic Kidney Disease Epidemiology Collaboration equation. More recently, use of cystatin C has gained favor as a renal function marker. In allogeneic HSCT patients, estimation of clearance based upon the average of eGFR calculated with serum creatinine and eGFR calculated with cystatin C has been shown to further improve estimation of clearance in comparison with serum creatine alone.15 However, cystatin C can be affected by factors such as inflammation, older age, being male, greater weight, greater height, thyroid function, and concomitant medications.15,16 Measured GFR (mGFR) is the criterion standard for kidney assessment, but it is more costly and complex to collect and rarely used to clinically approximate drug clearance.17 Substances such as inulin, EDTA, technetium-99-diethlenetriamine penta-acetic acid, iothalamate, or iohexol may be used to measure clearance.18 The hematopoietic cell transplantation-specific comorbidity index currently incorporates serum creatinine, dialysis, or previous kidney transplant in calculating a score to predict posttransplant outcomes such as nonrelapse mortality (NRM).19 In a prospective cohort study of 50 patients undergoing HSCT, Hingorani and colleagues reported that estimating clearance with calculated clearances were neither accurate nor precise in comparison with measured clearance, using an iohexol-based protocol.18 At our institution, we have assessed mGFR via iothalamate clearance before allogeneic HSCT since 2011 to guide dosing of transplant medications and assess comorbidities.
This study was aimed to identify the relationship between pretransplant kidney function estimated by mGFR and posttransplant outcomes, particularly NRM. The results were compared with standard methods for kidney assessment including creatinine-based estimates of GFR as predictors of posttransplant outcomes.
Materials and methods
Study design
This was a single-center, retrospective cohort study of adult patients who received an allogeneic HSCT for acute myeloid leukemia (AML) or myelodysplastic syndrome (MDS) from January 2011 through December 2018. Patients were identified through the transplant database at Mayo Clinic Rochester.
Participants
Adult patients with AML or MDS who received RIC with fludarabine and melphalan before HSCT and had an mGFR collected before allogeneic HSCT were included in this study. Standard dosing consisted of fludarabine 25 mg/m2 on days -6, -5, -4, -3, and -2 and melphalan 140 mg/m2 on day -1; dose reductions were allowed per provider discretion. For collection of mGFR, a baseline urine sample was collected, followed by subcutaneous administration of iothalamate meglumine (Conray 60%). Urine sample was collected at time of injection of iothalamate. After a 60-minute equilibration period to allow blood levels to stabilize, blood sample collected at 60 minutes postinjection, urine and blood sample collected at 90 minutes postinjection, and urine and blood sample collected at 120 minutes postinjection. The samples were then analyzed via spectrometry to calculate clearance. Patients who received total body irradiation as part of their conditioning regimen were excluded. Institutional review board approval from the Mayo Clinic was obtained before review of electronic medical records. The study was conducted in accordance with the Declaration of Helsinki.
Outcomes
The primary objective of this study was to identify the relationship between kidney function estimated by mGFR and risk of NRM in patients who had undergone allogeneic HSCT receiving fludarabine and melphalan RIC. Secondary objectives included the following: (1) determine the accuracy and precision of clearance estimations using eCrCl and eGFR formulas compared with mGFR in patients receiving fludarabine and melphalan before allogeneic HSCT; (2) describe how often fludarabine dose reductions are used in patients who had undergone allogeneic HSCT receiving fludarabine and melphalan; and (3) study the relationship between kidney function (eCrCl, eGFR, mGFR) and engraftment, relapse, overall survival, infection, acute graft versus host disease (GVHD), and chronic GVHD. The eCrCl was calculated using Cockcroft-Gault equation and eGFR was calculated using the 2009 Chronic Kidney Disease Epidemiology Collaboration equation. The mGFR was collected via measured corrected iothalamate clearance as detailed previously.
Statistical analysis
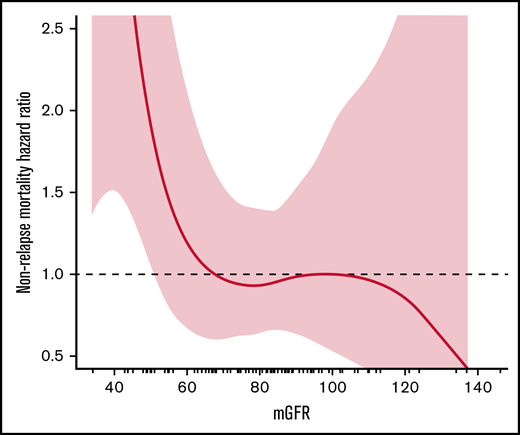
The relationship between pretransplant kidney function (mGFR, eGFR, eCrCl) and NRM was assessed using spline plots and Cox proportional hazards regression. The same methods were used to assess the relationship between kidney function (eCrCl, eGFR, mGFR) and posttransplant outcomes of engraftment, relapse-related mortality, mortality from any cause, relapse, infection, acute GVHD, and chronic GVHD. Posttransplant outcomes were collected at 100 days posttransplant, 1-year posttransplant, and at most recent clinic follow-up. Bland-Altman plots were used to visualize and assess agreement between mGFR and eCrCl or eGFR. The naturally occurring inflection cut point demonstrated on the mGFR spline plot for NRM was an mGFR of 67 mL/min/1.73 m2 (Figure 1), and the rounded mGFR of 65 was used for analysis purposes (c-statistic = 0.60) to divide patients into 2 comparative groups: mGFR <65 mL/min/1.73 m2 and mGFR ≥65 mL/min/1.73 m2. The Aalen-Johansen method with a competing risk of death was used to assess 1-year cumulative incidence of infection. All tests were 2-sided, and P values ≤ .05 were considered statistically significant. Analyses were performed using SAS version 9.4 software (SAS Institute, Inc.; Cary, NC) and R version 3.6.2 (R Core Team, R Foundation for Statistical Computing, Vienna, Austria).
Results
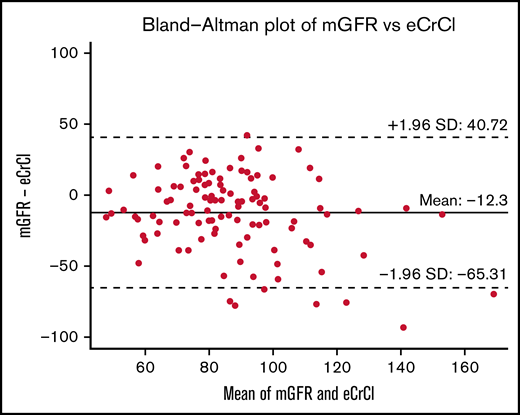
A total of 109 patients were included in this study; 72 patients had AML, 37 had MDS, and 67% were in first complete remission at time of transplant. The median age of study participants was 65 years (34-75) and the median comorbidity index confidence interval (CI) for the cohort was 5 (2-12). More than one-half of the patients had a matched related donor (56%), and most patients received a peripheral blood stem cell graft (97.2%). The median mGFR was 81 mL/min/1.73 m2; 22 (20%) patients had an mGFR <65 mL/min/1.73 m2 and 87 (80%) patients had an mGFR ≥65 mL/min/1.73 m2 (Table 1). When comparing pretransplant mGFR vs eCrCl on Bland-Altman analysis, measured clearances were on average 12.3 mL/min/1.73 m2 lower than calculated clearances, with a wide deviation in the differences between these (95% limits of agreement, -65.3 to 40.7) (Figure 2). Kidney function markers (creatinine, mGFR, eCrCl, eGFR) were the only significant baseline characteristic differences identified between the 2 groups pretransplant (Table 1). The median fludarabine dose and the median melphalan dose administered were not significantly different between the mGFR <65 mL/min/1.73 m2 and mGFR ≥65 mL/min/1.73 m2 group, and only 13 patients received an empiric dose reduction in fludarabine (n = 8), melphalan (n = 4), or both (n = 1). No standardized approaches to dose reductions were identified (supplemental Table 1).
Patient characteristics
| Pretransplant demographics | |||
|---|---|---|---|
| mGFR <65 mL/min/1.73 m2 | mGFR ≥65 mL/min/1.73 m2 | Total | |
| (n = 22) | (n = 87) | (N = 109) | |
| Age, median (range), y | 66.1 (48.8-75.1) | 63.8 (33.8-75.0) | 64.6 (33.8-75.1) |
| Recipient-donor sex | |||
| F-F | 5 (22.7%) | 14 (16.1%) | 19 (17.4%) |
| F-M | 6 (27.3%) | 26 (29.9%) | 32 (29.4%) |
| M-F | 4 (18.2%) | 15 (17.2%) | 19 (17.4%) |
| M-M | 7 (31.8%) | 32 (36.8%) | 39 (35.8%) |
| Comorbidity Index, median (range) | 5.0 (2.0-10.0) | 5.0 (2.0-12.0) | 5.0 (2.0-12.0) |
| Disease | |||
| AML | 18 (81.8%) | 54 (62.1%) | 72 (66.1%) |
| MDS | 4 (18.2%) | 33 (37.9%) | 37 (33.9%) |
| Disease status at transplant | |||
| CR1 | 17 (77.3%0 | 56 (64.4%) | 73 (67.0%) |
| CR2 | 2 (9.1%) | 17 (19.5%) | 19 (17.4%) |
| Progressed/active | 3 (13.6%) | 14 (16.1%) | 17 (15.6%) |
| Donor type | |||
| Related | 12 (54.4%) | 49 (56.3%) | 61 (56.0%) |
| Unrelated | 10 (45.5%) | 38 (43.7%) | 48 (44.0%) |
| HLA match | |||
| Matched | 22 (100.0%) | 86 (98.9%) | 108 (99.1%) |
| Mismatched | 0 (0.0%) | 1 (1.1%) | 1 (0.9%) |
| Graft type | |||
| Peripheral blood | 22 (100%) | 84 (96.6%) | 106 (97.2%) |
| Bone marrow | 0 (0.0%) | 3 (3.4%) | 3 (2.8%) |
| Pretransplant kidney function | |||
| Creatinine, median (range), mg/dL | 1.1 (0.5-1.6) | 0.8 (0.4-1.3) | 0.9 (0.4-1.6) |
| Corrected iothalamate, median (range), mL/min/1.73 m2 | 50 (34-64) | 85 (65.0-146) | 81 (34.0-146) |
| eCrCl, median (range), mL/min | 74.6 (46.9-130.4) | 89.8 (53.8-203.9) | 87.1 (46.9-203.9) |
| eGFR, median (range), mL/min/1.73 m2 | 65.4 (32.1-133) | 81.1 (46.5-154.9) | 79.2 (32.1-154.9) |
| Posttransplant characteristics | |||
| Time to engraftment, median (range), d | 16 (11-36) | 15 (6-191) | 16 (6-191) |
| GVHD* | |||
| Acute GVHD | 13 (64.6%) | 47 (56.7%) | 60 (58.1%) |
| Chronic GVHD | 12 (54.8%) | 58 (56.2%) | 70 (55.8%) |
CR1, first complete remission; CR2, second complete remission; F, female; M, male.
Rates presented are cumulative incidence rates at 1 year, and P values are from Cox proportional hazards regression.
The overall NRM rate was 55% in the mGFR <65 mL/min/1.73 m2 group compared with 31% in the mGFR ≥65 mL/min/1.73 m2 group (hazard ratio [HR], 2.13; 95% CI, 1.03-4.35; P = .04) (Table 2). Neither eGFR <65 mL/min/1.73 m2 (HR, 1.39; 95% CI, 0.65-2.94; P = .38) nor eCrCl <65 mL/min (HR 1.75, 95% CI, 0.68-4.55, P = .24) predicted a difference in overall NRM between the 2 groups (supplemental Table 2).
Primary and secondary outcomes with mGFR (<65 vs ≥65)
| Hazard ratio (95% CI) | P | |
|---|---|---|
| Nonrelapse mortality | ||
| Day 0-100 | 4.17 (0.84-20.0) | .081 |
| Day 0-1 y | 3.12 (1.28-7.69) | .012 |
| Overall | 2.13 (1.03-4.35) | .040 |
| Relapse | ||
| Day 0-100 | 0.63 (0.01-6.46) | .74 |
| Day 0-1 y | 0.98 (0.21-4.56) | .98 |
| Overall | 1.46 (0.33-6.46) | .62 |
| Engraftment | ||
| Day 0-100 | 0.80 (0.50-1.28) | .36 |
| Acute/chronic GVHD | ||
| Day 0-100 | 1.27 (0.62-2.56) | .52 |
| Day 0-1 y | 1.20 (0.71-2.08) | .48 |
| Chronic GVHD | ||
| Day 0-1 y | 0.92 (0.45-1.89) | .81 |
| Overall | 0.98 (0.52-1.82) | .94 |
| Infection | ||
| Day 0-100 | 2.78 (1.56-5.00) | <.001 |
| Day 0-1 y | 2.63 (1.54-4.55) | <.001 |
In regard to posttransplant outcomes, patients with an mGFR <65 mL/min/1.73 m2 exhibited a significantly higher 100-day infection incidence (HR, 2.78; 95% CI, 1.56-5.00; P < .001) and 1-year infection incidence (HR, 2.63; 95% CI, 1.54-4.55; P < .001) compared with patients with an mGFR ≥65 mL/min/1.73 m2 (Table 2). In the first year posttransplant, patients with an mGFR ≥65 mL/min/1.73 m2 had a lower rate of viral (45.1% vs 69.1%; HR, 0.50; 95% CI, 0.27-0.93; P = .028) and bacterial infections (23.4% vs 66.9%; HR, 0.23; 95% CI, 0.11-0.46; P < .001), there was no difference in rates of fungal infections. Overall, infection was the leading cause of death in both groups (supplemental Table 3). Using mGFR, no differences in relapse, engraftment, acute/chronic GVHD, or chronic GVHD were identified between the 2 groups (Table 2). The 2-year overall survival was significantly lower in patients with an mGFR <65 mL/min/1.73 m2 (P = .019) compared with patients with an mGFR ≥65 mL/min/1.73 m2 (Figure 3). The use of eGFR or eCrCl did not predict any differences in mortality, engraftment, GVHD, or infection between the 2 groups at any of the studied time points posttransplant (supplemental Table 2).
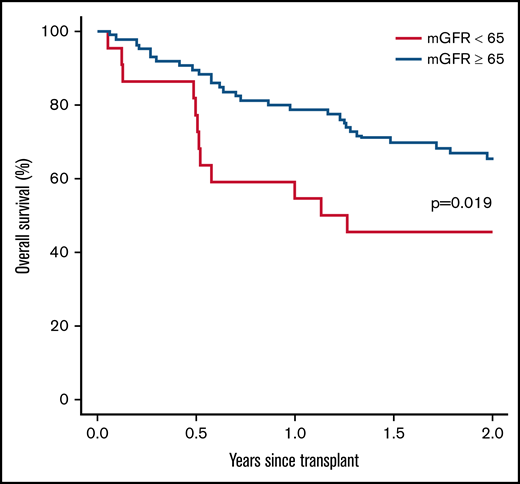
Two-year overall survival between mGFR <65 mL/min/1.73 m2 and mGFR ≥65 mL/min/1.73 m2.
Two-year overall survival between mGFR <65 mL/min/1.73 m2 and mGFR ≥65 mL/min/1.73 m2.
Discussion
Our results suggest that patients with impaired kidney function assessed by mGFR in the pretransplant setting were at a higher risk for NRM after HSCT with RIC using fludarabine and melphalan. To our knowledge, this is the first study to explore the correlation between mGFR and NRM. Thus far, only studies using clearance estimates have identified that a relationship does exist between the 2 variables, with decreased clearance associated with poorer posttransplant survival.20,21 A recent publication comparing patients with AML and MDS receiving fludarabine and melphalan (140 mg/m2) vs fludarabine and busulfan reported a 2-year NRM of 32% in their fludarabine and melphalan arm.22 Although our study includes patients with varying durations of follow-up, this NRM more closely follows our overall NRM of 31% in patients with mGFR ≥65 mL/min/1.73 m2, whereas patients with mGFR <65 mL/min/1.73 m2 revealed a significantly worse overall NRM incidence of 55%. This further supports our proposed relationship between decreased mGFR and NRM. Like NRM, mGFR <65 mL/min/1.73 m2 was associated with an increased incidence of infection. In the aforementioned study, 10% of deaths in the fludarabine and melphalan arm were attributed to infection,22 which is similar to our patients with mGFR ≥ 65 mL/min/1.73 m2 who had 10.3% deaths attributed to infection vs a 46% incidence of deaths attributed to infection in patients with mGFR <65 mL/min/1.73 m2. Fludarabine is more immunosuppressive than myelosuppressive; therefore, we hypothesize that those with impaired kidney function have delayed elimination of fludarabine, exposing them to higher levels of the active F-ara-A for longer periods compared with those with an mGFR ≥65 mL/min/1.73 m2. We also hypothesize that when patients have an increased exposure to melphalan because of impaired clearance of drug, it may predispose them to higher rates of melphalan-related mucositis and bacterial translocation.
Although our study was primarily aimed at exploring the relationship between mGFR and NRM, of most significance, this study highlights the importance of using actual measurements of kidney function in place of clearance estimates, and it echoes the discordance that exists between estimated and measured GFR as previously identified by Hingorani and colleagues. As demonstrated by the Bland-Altman analysis in Figure 2, the use of calculated kidney function does not always strongly agree to the actual measured clearance, and may lead to dosing decisions that put the patient at risk for under- or overdosing the conditioning chemotherapy, which may have a significant impact on posttransplant outcomes. Although we are unable to draw dosing conclusions from our limited number of patients that received empiric dose adjustments because of pretransplant kidney function, this indicates the need of pharmacokinetic-based dosing, like we see with busulfan. Very limited research has been done on individualized dosing of fludarabine and melphalan based on area under the curve modeling. Langenhorst and colleagues have studied the relationship between fludarabine exposure and survival, whereas Nath and colleagues have studied the relationship between melphalan exposure and toxicity; both groups have identified that kidney clearance is a factor that influences the over- or underexposure of these agents.9,12,14 Now that we have an understanding of the importance of measured vs estimated clearance, future studies investigating the relationship between mGFR and drug exposure could significantly assist in developing an individualized dosing strategy for fludarabine and melphalan conditioning chemotherapy, considering pretransplant mGFR measurements.
The retrospective, single-center design is a limitation of this study. In addition, the nonstandardized approach to dose adjustments and small number of patients receiving dose adjustments limits our ability to discern the benefit of renal dose adjustments and at what magnitude these adjustments should be made. Finally, the mGFR assessed during pretransplant evaluation phase may not always reflect kidney function at time of conditioning chemotherapy administration because of delays between pretransplant evaluation and initiation of conditioning chemotherapy.
Conclusion
In an attempt to balance toxicity and engraftment, the use of measured clearance may be favored over calculated clearance estimates such as eGFR and eCrCl in the pretransplant setting. In our study, patients with impaired kidney function demonstrated by mGFR <65 mL/min/1.73 m2 that received RIC with fludarabine and melphalan were at a higher risk of NRM and infection, whereas eGFR and eCrCl measurements did not share these relationships. However, prospective studies are required to validate these results and determine appropriate dose reductions.
Acknowledgments
This project was supported by the Mayo Midwest Pharmacy Research Committee.
Authorship
Contribution: J.L.K. designed research, collected data, analyzed results, and wrote the paper; J.A.M. designed research, analyzed results, and wrote the paper; A.G.P. designed research, analyzed results, and wrote the paper; E.F.B. designed research, analyzed results, and wrote the paper; G.T.B. analyzed results and wrote the paper; K.C.M. designed research and statistical analysis; M.R.L. analyzed results and wrote the paper; W.J.H. analyzed results and wrote the paper; M.V.S. analyzed results and wrote paper; A.A.M. analyzed results and wrote the paper; N.L. analyzed results and wrote the paper; and H.B.A. designed research, analyzed results, and wrote the paper.
Conflicts of interest: The authors declare no competing financial interests.
Corresponding author: Jade L. Kutzke, Department of Pharmacy, Mayo Clinic – Rochester 200 First St SW, Rochester, MN 55905; e-mail: Kutzke.jade@mayo.edu.

