

Key Points
Metformin was safe and well tolerated in nondiabetic patients with FA.
Hematologic response was observed in 4 of 13 (30.8%; 90% CI, 11.3-57.3) evaluable patients with FA treated with metformin.

Abstract
Fanconi anemia (FA), a genetic DNA repair disorder characterized by marrow failure and cancer susceptibility. In FA mice, metformin improves blood counts and delays tumor development. We conducted a single institution study of metformin in nondiabetic patients with FA to determine feasibility and tolerability of metformin treatment and to assess for improvement in blood counts. Fourteen of 15 patients with at least 1 cytopenia (hemoglobin < 10 g/dL; platelet count < 100 000 cells/µL; or an absolute neutrophil count < 1000 cells/µL) were eligible to receive metformin for 6 months. Median patient age was 9.4 years (range 6.0-26.5 ). Thirteen of 14 subjects (93%) tolerated maximal dosing for age; 1 subject had dose reduction for grade 2 gastrointestinal symptoms. No subjects developed hypoglycemia or metabolic acidosis. No subjects had dose interruptions caused by toxicity, and no grade 3 or higher adverse events attributed to metformin were observed. Hematologic response based on modified Myelodysplastic Syndrome International Working Group criteria was observed in 4 of 13 evaluable patients (30.8%; 90% confidence interval, 11.3-57.3). Median time to response was 84.5 days (range 71-128 days). Responses were noted in neutrophils (n = 3), platelets (n = 1), and red blood cells (n = 1). No subjects met criteria for disease progression or relapse during treatment. Correlative studies explored potential mechanisms of metformin activity in FA. Plasma proteomics showed reduction in inflammatory pathways with metformin. Metformin is safe and tolerable in nondiabetic patients with FA and may provide therapeutic benefit. This trial was registered at as #NCT03398824.
Introduction
Fanconi anemia (FA) is a genetic bone marrow failure disorder characterized by DNA repair defects and propensity to develop hematologic malignancies and solid tumors. Bone marrow failure is a major cause of early morbidity/mortality in FA, with a cumulative incidence of 90% by age 40.1,2 Although allogeneic hematopoietic stem cell transplantation (HSCT) offers curative therapy for hematologic complications of FA, graft-versus-host disease and other therapy-related adverse effects remain challenging. Exposure to genotoxic agents in transplant conditioning regimens also raise concern given the increased risk of solid tumors with FA.3 Androgens can improve blood counts in a subset of patients with FA, although patients may relapse and remain at risk for hematologic malignancies.4-7 Long-term treatment with androgens is limited by side effects such as transaminitis, virilization, and risk of hepatic adenomas and carcinomas.8,9 Thus, the identification of safe and effective oral agents that aid hematopoiesis and reduce the risk of malignant transformation are of clinical interest.
Previous studies of resveratrol in a Fancd2−/− murine model of FA demonstrated that the drug improved hematopoietic function but had no effect on tumor formation.10 Resveratrol is a stilbenoid polyphenol with multiple bioactivities including activation of AMP-activated protein kinase (AMPK). AMPK plays an important role in hematopoietic stem cell maintenance.11,12 Metformin (N,N-dimethylguanide), an oral drug used to safely treat type 2 diabetes and insulin resistance, is known to activate AMPK.13 In addition, metformin may also scavenge aldehydes through the Mannich reaction.14 FA mice with mutations in the aldehyde detoxifying enzymes Aldh2 or Aldh5 manifest accelerated bone marrow failure.15-17 An increased risk of severe bone marrow failure was also observed in patients with FA with impaired aldehyde detoxification from constitutional mutations in ALDH2.18 Treatment of Fancd2−/− mice with metformin improved hematopoiesis and delayed tumor formation.19 Based on these findings, we hypothesized that metformin may provide therapeutic benefit in patients with FA. As insulin resistance is also frequent in patients with FA, metformin treatment may also afford a secondary benefit on glucose homeostasis.20,21 To investigate this hypothesis, we developed a pilot study of metformin for nondiabetic children and young adults with FA to assess safety, tolerability, and impact of the drug on hematologic parameters. Exploratory biological correlative assays were also assessed.
Methods
Human subjects research
The study was conducted in accordance with the principles of the Declaration of Helsinki and Good Clinical Practice guidelines. The protocol was approved by the institutional review board at Boston Children’s Hospital. All patients/legal guardians provided written informed consent, and patient assent was also obtained where appropriate. A medical monitor reviewed data on a quarterly basis for assessment of toxicities and/or futility. This trial was registered at https://clinicaltrials.gov/ct2/show/NCT03398824.
Patients
Patients with FA 6 to 35 years of age were eligible for enrollment at Boston Children’s Hospital. All patients had baseline increased chromosomal breakage with mitomycin C (MMC) and diepoxybutane (DEB). Patients met at least 1 of the following cytopenia requirements for study enrollment: hemoglobin (Hb) < 10 g/dL, platelet count < 100,000 cells/µL, or an absolute neutrophil count (ANC) < 1000 cells/µL. Exclusion criteria included, but were not limited to, prior HSCT, history of myeloid malignancy, use of concurrent medications with the intent to improve hematopoiesis, history of type I diabetes or prior symptomatic hypoglycemia, G6PD deficiency, vitamin B12 deficiency, or other significant health comorbidities.
Study design
This was an investigator-initiated single institution, open-label, single-arm pilot study of metformin in patients with FA. Patient examinations were conducted in person before initiation of metformin and after 6 months of treatment with remote interim weekly assessments for the first month and monthly assessments thereafter. Patients underwent bone marrow (BM) aspiration and biopsy evaluations at study entry and at end of protocol therapy. Metformin immediate-release tablets (Ascend Laboratories) were administered orally for 6 months using dosing prescribed for type 2 diabetes. Starting dose was 500 mg once daily for all subjects, and the dose was increased by 500 mg/day until goal dosing was reached (500 mg twice daily for patients < 10 years of age and 1000 mg twice daily for patients 10 years or older). For patients exhibiting metformin intolerance, as defined by gastrointestinal toxicity, renal toxicity, hypoglycemia, lactic acidosis, or sustained grade 2/onset of grade 3 toxicity, the dose was reduced by 500 mg/day until a tolerated dose was achieved. If an individual was already on the lowest dosing of drug (500 mg/day), treatment was discontinued. Blood counts were assessed monthly. Liver function and renal function were assessed at 1, 3, and 6 months. Data on adverse events (AEs) were collected in accordance with the National Cancer Institute Common Terminology for Adverse Events, Version 4.03. AEs are reported for patients that received metformin for any duration of time.
The primary end point was the proportion of subjects with a hematologic response (HR) after initiation of metformin. Patients were deemed evaluable for HR if they received metformin for at least 1 month. Hematologic improvement criteria were based on modified Myelodysplastic Syndrome International Working Group (IWG) criteria (supplemental Appendix 1).22 To be classified as a HR, protocol-defined metrics of response needed to be sustained for at least 2 months and demonstrated on 2 consecutive measurements in at least 1 hematopoietic lineage. BM cellularity was evaluated by blinded central pathology review.
Statistical analysis
Predefined stopping rules were developed in the event that an unacceptable frequency of severe AEs was observed. Any patient who received at least 1 dose of metformin on study was eligible for safety analysis. The primary end point of the study was to assess the proportion of subjects with a HR during 6 months of metformin treatment; sample size was calculated assuming that a HR rate ≥ 20% suggests preliminary efficacy of treatment that warranted additional investigation and, conversely, that the study should be deemed futile if the rate of HR was ≤5%. Accrual goal for the study was 22 evaluable subjects; therefore, the treatment would warrant further investigational studies if at least 3 of 22 evaluable subjects had HR. The probability of observing at least 3 of 22 responders is at least 0.84 assuming the true response is ≥20% and is <10% if the true response is <5%. Study accrual was stopped early on 9 October 2020 given the COVID-19 pandemic’s impact on clinical research infrastructure and evidence that the primary end point had been achieved after 14 patients received protocol therapy.
Patient demographic and baseline characteristics, including age, sex, medical history, FA subtype, prior therapy, and baseline hematologic values (Hb, platelet count, ANC, transfusion requirements) were summarized using descriptive statistics. Responses were reported for Hb, platelet count, and ANC along with 90% exact binomial Clopper-Pearson confidence interval (CI). For secondary objectives, change from baseline in continuous variables (Hb, platelet count, ANC) was reported as proportion of subjects with no improvement and maximum improvement. For assessment of safety and tolerability, the proportion of patients with each AE was reported. Maximal dosing and dose interruptions/modifications were recorded for patients enrolled. Change in exploratory end points before and after treatment was assessed using a paired t test or the Wilcoxon signed-rank test.
Chromosomal breakage assessment
Chromosomal breakage was quantitated before and after treatment with MMC or DEB in the cytogenetics laboratory in the Comprehensive Center for Fanconi Anemia at the Dana-Farber Cancer Institute as previously described.23 Peripheral blood stimulated with phytohemagglutinin was cultured and subsequently exposed to MMC or DEB. Metaphase cells were scored and analyzed for chromosomal breakage, including formation of radials. Results were compared with healthy subjects (negative controls) and FANCD1−/− cell lines (positive control).
Nanoscale liquid chromatography coupled to tandem mass spectrometry quantification of endogenous DNA-protein cross-link
Flash-frozen BM aspirates were homogenized with 1 mL ice-cold homogenization buffer (20 mM sodium phosphate buffer, 250 mM sucrose, 5 mM MgCl2, 25 mM KCl, pH 7.2) and centrifuged at 4000g at 4°C for 10 minutes before resuspension in 1 mL ice-cold 20 mM sodium phosphate buffer (pH 7.2). The sample was again centrifuged at 4000g at 4°C for 10 minutes, and the resulting pellet was resuspended in 1 mL DNAzol reagent. Proteinase K (20 μL, 20 mg/mL) was added for overnight digestion. DNA-protein cross-link (DPC) isolation, further enzymatic digestions, high-performance liquid chromatography purification of target DPCs, nano-LC-MS/MS detection of purified DPCs fraction, and accurate quantification of DPCs based on calibration curve were then performed as previously described.24
Methylcellulose colony-forming cell assays
CD34+ cells were isolated from mononuclear cells by magnetic cell sorting using the EasySep human CD34-positive selection kit II (Stem Cell Technologies, Vancouver, Canada) following the manufacturer’s recommendations. CD34+ cells were plated at low-density in 2 to 4 wells of a SmartDish (Stem Cell Technologies) in MethoCult H4034 Optimum Methylcellulose-based media containing Stem Cell Factor, GM-CSF, G-CSF, interleukin-3, and EPO (Stem Cell Technologies). Cultures were placed in an incubator set at 37°C, 5% CO2, and 90% humidity for 14 days. At the end of the incubation, colonies were scored (CFU-E, BFU-E, CFU-GM) in a blinded manner by 2 independent investigators, and photographs were documented with the STEMvision automated colony counter (Stem Cell Technologies).
Fluorescent in situ hybridization
Fluorescent in situ hybridization (FISH) was performed by Integrated Oncology. Four applications of FISH were performed on interphase nuclei using the following commercial probes: (1) a dual-color probe targeting either side of BCL6 on chromosome 3q27, (2) 5q33 (CSF1R/RPS14)/5p12(FGF10) probes, (3) 7q31 (MDFIC)/SE7(D7Z1), and (4) SE8 (D8Z1)/8q24(MYC).
Somatic mutation analysis
The RHPv3 assay assessed targeted regions in 88 genes that are recurrently mutated in myeloid and lymphoid neoplasms. DNA from peripheral blood was submitted to NEBNext Direct chemistry (New England Biolabs, Ipswich, MA) with dual indices and unique molecular identifiers allowing sub-1% variant calling at many loci. Samples were pooled before massively parallel sequencing on a NextSeq 550Dx (150 base pair paired-end sequencing, Illumina, San Diego, CA). The bioinformatic pipeline integrated several publicly available modules and internally developed algorithms for the detection of copy number variants and FLT3 internal tandems duplications.25
SOMAscan analysis
SOMAscan (SomaLogic, Boulder, CO) analysis of plasma samples was performed at the Beth Israel Deaconess Medical Center Genomics, Proteomics, Bioinformatics, and Systems Biology Center according to standard protocols for biologic fluids from SomaLogic that have been described elsewhere.26,27 Plasma samples (50 μL) were run on the SOMAscan Assay 1.3k for human plasma, which measures the expression of 1305 human proteins with the use of highly selective single-stranded modified slow off-rate modified DNA aptamers. Five pooled human plasma samples and a no-protein buffer control were run in parallel with the plasma test samples. Sample-to-sample variability was controlled by several hybridization spike-in control cases. Data quality control, calibration, plate scaling, hybridization normalization, and median normalization were done according to the manufacturer’s protocol.28,29 SOMAscan data were analyzed using methods previously described.30,31
Oral glucose tolerance test
An oral glucose tolerance test was performed before and after completion of study treatment. Patients fasted overnight before the fasting glucose and insulin levels were drawn, and 5 mg/kg Trutol (Permula) (100 g glucose/295 mL bottle, maximum dose of 220 mL) was administered. Repeat glucose levels were drawn 2 hours after administration of Trutol.
Micronucleus assay in buccal cells
Buccal swabs were obtained at different time points before and after metformin treatment from each cheek. After washing, fixation, and staining with 4′,6-diamidino-2-phenylindole, the frequency of micronuclei (MN) was studied as previously described.32 To compare means of the frequency of MN before and after treatment, the Wilcoxon matched-pairs signed rank test was used.
Results
Patients
Eligible patients were recruited from April 2018 through February 2020.
Fifteen subjects consented to study; 1 patient was deemed ineligible after screening BM evaluation demonstrated an increasing del(7q) clone. Fourteen subjects received protocol therapy (Figure 1).
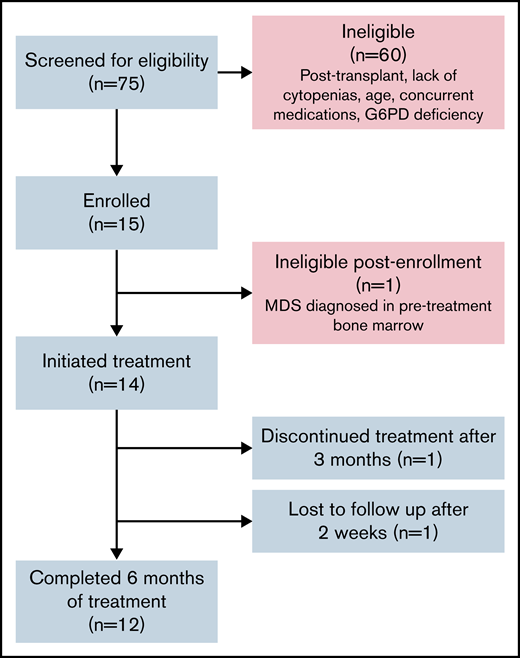
Flow diagram of study population. Includes patients screened, enrolled, and determined to be eligible for protocol treatment.
Flow diagram of study population. Includes patients screened, enrolled, and determined to be eligible for protocol treatment.
Clinical characteristics of study population
The median age of treated patients was 9.4 years (range, 6.0-26.5 years), and 8 subjects were male (57.1%). All patients had chromosomal breakage studies and genetic studies consistent with FA (supplemental Appendix 2). Median blood counts at study entry were Hb of 11 g/dL (range, 8.4-14.2 g/dL), platelet count of 54 000 cells/µL (range, 16 000-78 000 cells/µL), ANC of 1.1K cells/µL (range, 0.6-1.6K cells/µL). One patient was transfusion dependent for red blood cells (Table 1).
Baseline characteristics of study subjects
| Characteristic | Median (range) or n (%) |
|---|---|
| Age, y | 9.4 (6.0-26.5) |
| Sex | |
| Female | 6 (42.9%) |
| Male | 8 (57.1%) |
| FA subtype | |
| FANCA | 12 (85.7%) |
| FANCC | 2 (14.3%) |
| Red blood cell transfusion dependent | 1 (7.1%) |
| Characteristic | Median (range) or n (%) |
|---|---|
| Age, y | 9.4 (6.0-26.5) |
| Sex | |
| Female | 6 (42.9%) |
| Male | 8 (57.1%) |
| FA subtype | |
| FANCA | 12 (85.7%) |
| FANCC | 2 (14.3%) |
| Red blood cell transfusion dependent | 1 (7.1%) |
Total number of study subjects = 14.
Treatment
Twelve of 14 patients (86%) completed 6 months of metformin treatment. One patient was lost to follow-up after 2 weeks of metformin treatment and another withdrew from the study after 3 months of treatment due to a desire to proceed to HSCT. Thirteen of 14 patients treated (93%) achieved maximal age-based dosing of the study drug. One subject underwent dose reduction from 2000 to 1500 mg/day for sustained grade 2 gastrointestinal symptoms, a known side effect of metformin that often improves with time. With dose reduction, the subject completed the remainder of protocol treatment.
Safety and tolerability
AEs felt to be possibly related to metformin are summarized in Table 2. The most common side effect was diarrhea (12 of 14, 85.7%). The worst grade recorded for a given AE was grade 1 in 9 subjects and grade 2 in 4 subjects. No grade 3 or higher adverse events attributed to study drug were observed. No subjects developed symptomatic hypoglycemia or metabolic acidosis. No serious AEs were reported.
Toxicities possibly, probably, or definitely related to metformin
| Toxicity type | Worst grade | Total | Percentage* | |
|---|---|---|---|---|
| 1 | 2 | |||
| Diarrhea | 11 | 1 | 12 | 27.9 |
| Nausea | 6 | 1 | 7 | 16.3 |
| Abdominal pain, intermittent | 4 | 0 | 4 | 9.3 |
| Increased alanine aminotransferase (ALT) | 2 | 1 | 3 | 7 |
| Increased aspartate aminotransferase (AST) | 2 | 1 | 3 | 7 |
| Fatigue | 2 | 0 | 2 | 4.7 |
| Headache | 2 | 0 | 2 | 4.7 |
| Papulopustular rash, localized | 2 | 0 | 2 | 4.7 |
| Anorexia, intermittent | 1 | 0 | 1 | 2.3 |
| Anxiety, intermittent | 1 | 0 | 1 | 2.3 |
| Dyspepsia | 1 | 0 | 1 | 2.3 |
| Eye disorders, other-pruritis | 1 | 0 | 1 | 2.3 |
| Eye disorders, other-redness/edema | 1 | 0 | 1 | 2.3 |
| Hyperkalemia | 1 | 0 | 1 | 2.3 |
| Vomiting, intermittent | 1 | 0 | 1 | 2.3 |
| Watering eyes | 1 | 0 | 1 | 2.3 |
| Worst grade across all toxicities (no. of patients) | 9 | 4 | 13 | |
Percentage of total toxicities.
Because vitamin B12 depletion has been reported with metformin treatment because of malabsorption, vitamin B12 levels were monitored. Ten of 11 evaluable patients (90.9%) had vitamin B12 levels in the normal range at initiation and completion of metformin treatment; in 1 instance (9.1%), the vitamin B12 level fell from a normal level of 355 pg/mL at treatment start to 168 pg/mL (lower limit of normal = 190 pg/mL) at the end of therapy. Given metformin’s impact on glucose control, we also assessed the effects of metformin on glucose metabolism, particularly given the inherent risk for insulin resistance and higher rates of diabetes seen with FA. The oral glucose tolerance test was assessed at the start and end of treatment in 11 evaluable patients. None of the study subjects had frank diabetes, defined as fasting blood glucose ≥ 126 mg/dL or 2-hour blood glucose ≥ 200 mg/dL. The mean change in fasting insulin level was −2.0 mcIU/mL (95% CI, −5.1 to1.1; P = .17), which was not significantly different before and after metformin therapy. Three subjects had mildly elevated insulin levels consistent with mild insulin resistance prior to study start. Two of 3 normalized their insulin levels after metformin treatment. Growth parameters were also assessed before and after metformin treatment. No significant change in height, weight, or body mass index was noted after metformin treatment. Specifically, the mean change before and after metformin in height z-scores was 0.02 (95% CI, −0.17 to 0.13; P = .77), weight Z-scores was −0.03 (95% CI, −0.21 to 0.15; P = .72), and body mass index Z-scores was 0 (95% CI, −0.2 to 0.2; P = .92).
Treatment response
Four patients (30.8%; 90% CI, 11.3-57.3) achieved HR on metformin therapy. The median time to first response was 84.5 days (range, 71-128 days). One subject had a bilineage (Hb and ANC) response, 2 subjects had a neutrophil response, and 1 subject had a platelet response. Age of the patient was not associated with response. The patient with HR based on Hb improvement had been red cell transfusion dependent at the time of study entry and became transfusion independent after 1 month of therapy. Overall changes in blood counts are summarized in Table 3 and Figure 2. Maximum improvement in Hb was 2.3 g/dL (median, 0.7 g/dL), platelets was 49 000 cells/µL (median, 13.8K cells/µL), and ANC 1.4K cells/µL (median, 0.8K cells/µL) . No subjects met criteria for disease progression or relapse after response during the study period.
Magnitude of hematologic improvement with metformin
| Hematologic parameter | Number (N) | Baseline studies median (range) | Maximum improvement over baseline median (range) | Maximum percentage improvement over baseline median (range) |
|---|---|---|---|---|
| Hemoglobin* g/dL | 13 | 11 g/dL (8.4-14.2) | 0.7 g/dL (0-2.3) | 6.2% (0-27.4) |
| Reticulocyte count (cells/µL) | 14 | 60,000 cells/µL (0.02-0.1) | 2,000 cells/µL (0-0.022) | 4.5% (0-91.7) |
| Mean corpuscular volume (fL) | 14 | 105.3 fL (92.1-111.2) | 1.2 fL (0-6.2) | 1.2% (0-5.6) |
| Platelets (cells/µL) | 14 | 53,800 cells/µL (16-78) | 11,500 cells/µL (0-49) | 31.8% (0-87.5) |
| Neutrophils (cells/µL) | 14 | 1,100 cells/µL (0.6-1.6) | 800 cells/µL (0-1.4) | 55.4% (0-166.7) |
The patient who was transfusion dependent for red blood cells at baseline before metformin initiation was not included in this hemoglobin analysis.
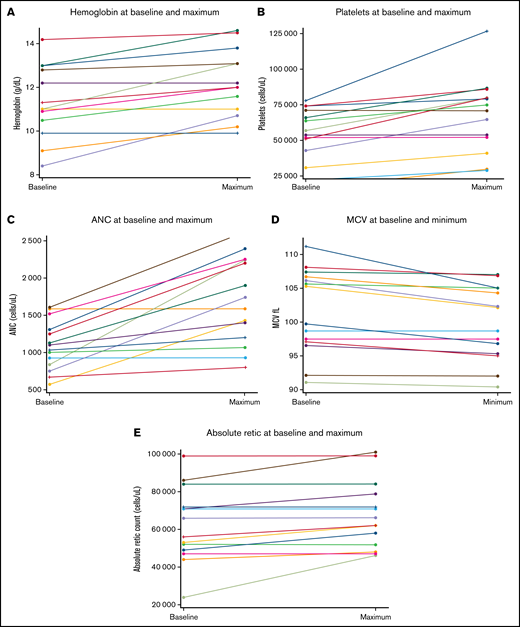
Hematologic parameters at baseline and maximum response following metformin treatment. (A) Hemoglobin. (B) Platelet count. (C) Absolute neutrophil count. (D) Mean corpuscular volume. (E) Absolute reticulocyte count.
Hematologic parameters at baseline and maximum response following metformin treatment. (A) Hemoglobin. (B) Platelet count. (C) Absolute neutrophil count. (D) Mean corpuscular volume. (E) Absolute reticulocyte count.
All subjects had low BM cellularity for age. For evaluable patients, there was no significant change in marrow cellularity at the end of metformin treatment (P = .8164; supplemental Appendices 2 and 3). FISH studies were negative for all patients evaluable both before and after metformin. All 12 patients with normal cytogenetics at study entry retained normal karyotype at study completion. Two patients had cytogenetic abnormalities noted at study entry: 1 had a stable clone and 1 had emergence of a new clone and resolution of the previously identified clone at time of study completion (supplemental Appendix 2).
Targeted deep sequencing analysis of somatic mutations was conducted on blood samples collected from 11 subjects before and after metformin treatment. No new mutations were detected after metformin treatment. Nine patients lacked somatic mutations in either sample. Two patients with a variant of unknown significance at study entry (CUX1 and EP300, respectively) had no change in these clones following metformin treatment (supplemental Appendix 2).
Sufficient CD34+ cells were collected from paired marrow samples before and after metformin treatment for 4 patients, none of whom had achieved HR. Despite not meeting HR criteria, increased myeloid and erythroid colony-forming cell numbers were noted in 2 of the 4 patient samples performed in replicate plates (supplemental Appendix 4).
Chromosomal breakage after exposure to MMC or DEB is a hallmark of cells from patients with FA. We therefore determined whether metformin impacts chromosomal breakage. Chromosomal aberrations, radial forms, and number of metaphase cells with radials after MMC or DEB were quantitated in blood samples drawn before or after metformin (supplemental Appendix 5). Following metformin treatment, a decline in breakage was observed in 8 of 10 patient samples exposed to MMC and 7 of 10 patient samples exposed to DEB, although the absolute change in breaks for the entire cohort was not statistically significantly different before and after treatment. Specifically, with MMC treatment, the mean of change before vs after metformin for chromosomal aberrations was −114.8 (95% CI, −325.5 to 95.9; P = .10), for radial forms was −31.6 (95% CI, −116 to 53.5; P = .23), and for cells with radials was −8.0 (95% CI, −25.5 to 9.5; P = .38). With DEB treatment, the mean of change for chromosomal aberrations was −29.2 (95% CI, −144.3 to 86; P = .56), for radial forms was −4.6 (95% CI, −44.9 to 35.7; P = .51), and for cells with radials was −3.0 (95% CI, −16.6 to 10.6; P = .38).
The frequency of MN is a biomarker of chromosomal fragility. FA has been associated with an increase in the frequency of MN in buccal cells.32 A reduction in radiation-induced MN formation has been reported with metformin treatment of cultured human lymphocytes.33 We therefore quantitated MN present in buccal epithelial cells before and after metformin treatment for 14 evaluable subjects. No significant mean change was noted in numbers of MN per 1000 buccal epithelial cells (mean change, 1.2; 95% CI, −0.7 to 3.1; P for generalized estimation equation = .22) or in cells with MN per 2000 buccal epithelial cells (mean change, 1.2; 95% CI, −1.2 to 3.6; P for generalized estimation equation = .34; supplemental Appendix 6).
DPCs are considered the primary DNA damage induced by aldehyde exposure. To explore the potential effects of metformin on aldehyde-mediated DNA damage, we quantified DPCs before and after metformin therapy. Baseline DPCs levels were low, and analysis was limited by inadequate DNA yields from 5 of the 10 paired marrow samples. For the 5 evaluable subjects, none of whom achieved HR with metformin therapy, levels of DPCs/108dG are shown in supplemental Appendix 7. Analysis was limited by the small sample numbers and low levels of adducts at baseline, so these observations are included descriptively.
We conducted quantitative proteomic assessments of 1305 plasma proteins before and after metformin treatment using the aptamer-based SOMAscan multiplexed platform. We observed a reduction of 32 proteins and an increase in 67 proteins (|log2(FCmean)| > log2(1.2); P < .05) after metformin treatment (supplemental Appendices 8 and 9).
Corresponding KEGG and GSEA analyses identified downregulation of cytokine and cytokine receptor interaction pathways, inflammatory pathways, and type 1 diabetes mellitus pathways (supplemental Appendices 10 and 11).
Discussion
In this prospective pilot study, we found that metformin, administered at dosing used for diabetes, is safe and well tolerated in nondiabetic patients with FA. The most common AEs were mild transient gastrointestinal side effects, as have been previously reported in patients without FA. No grade 3 or higher treatment-related AEs were identified in our study cohort. Importantly, we did not observe weight loss or growth reduction with treatment. Despite metformin being an insulin-sensitizing agent, we found no significant difference in markers of glucose homeostasis before and after treatment. Further assessment is needed to determine whether metformin can protect against end-organ toxicity secondary to hyperglycemia and insulin resistance in patients with FA, particularly after HSCT.34
We observed HR in 4 of 13 patients with FA treated with metformin for 6 months. No patients had worsening cytopenias or relapse. Although many of our correlative analyses were limited by sample availability and assay limitations, interestingly, improvement in hematopoiesis with metformin was observed with in vitro erythroid and myeloid hematopoietic colony assay after metformin treatment in 3 of 4 patients who did not meet HR criteria. These results support further investigation of the impact of metformin on hematopoiesis in FA.
The mechanisms by which metformin improves hematopoiesis in FA remain to be determined. Despite the observed improvement in blood counts when Fancd2−/− mice are treated with metformin in vivo, the addition of metformin in vitro to isolated hematopoietic stem cell precursors from Fancd2−/− mice19 or to marrow samples from patients with FA (unpublished observation) fails to increase hematopoietic colony numbers. These observations raise the possibility that the hematopoietic stem/progenitor cells are not directly targeted by metformin. Exploratory proteomic studies of plasma from patients with FA treated with metformin suggest that metformin might reduce inflammatory pathways, although further studies are needed to address this question. Metformin is also known to inhibit mitochondrial complex 1, activate AMPK with resultant downstream effects including inhibition of mTOR, and cause other metabolic effects.13,35-37 These also warrant further investigation as potential mechanisms for metformin benefit.
Recent studies in non-FA populations have reported decreased incidence of solid tumors in patients taking metformin, although causality and effects in nondiabetic populations remain to be investigated.38-41 Patients with FA have increased rates of both hematologic malignancies and solid tumors, particularly squamous cell carcinomas of the head, neck, and gastrointestinal tract, as well as hepatocellular carcinomas, and therefore strategies to reduce cancer risk in FA are also of great clinical interest. As metformin has been previously shown to delay tumor formation in Fancd2−/− mice,19 further study regarding the drug’s impact on risk for malignant transformation would also be beneficial.
This study has several limitations. FA is a rare disease, and recruitment to our study was further impacted by a halt on enrollment because of the COVID-19 pandemic. Pandemic-related restrictions also curtailed sample acquisition for correlative biology studies. Importantly, the assessment of metformin treatment was limited to 6 months in this pilot trial. Future studies should consider a longer-term exposure to metformin to determine whether this enhances clinical benefit and a possible escalation in dosing from that used for diabetes to determine whether that might afford greater therapeutic benefit in the context of FA. Because of the rarity of FA, a randomized design with a control group was not feasible to rigorously study metformin effects. As only one-third of our patients responded to treatment, correlative assays that facilitate our ability to predict early in treatment those patients most likely to respond would be advantageous in future studies. Moreover, a study design that entails longer duration of metformin treatment may improve the response rate in a larger subset of patients and aid our identification of prognostic correlative assays. Biomarkers for genomic instability before and after metformin treatment in this study were limited by low baseline levels and low cellularity of marrow and blood samples in this small FA cohort. Development of more robust correlative assays could further clarify metformin’s potential for mitigation of such instability.
Despite these limitations, this pilot study suggests that metformin is safe and well tolerated in FA and may afford clinical benefit in a subset of patients. Development of a subsequent multicenter efficacy study may provide greater clarity regarding metformin’s role in the treatment of FA. Given the historical experience of treating FA-associated cytopenias with androgens, combination treatment of androgens with metformin could also be explored. Future efficacy end points should study the utility of metformin as both a prophylactic agent aimed at curtailing progression of bone marrow failure and as a chemo preventive agent aimed at reducing cancer risk in FA.
Acknowledgments
The authors gratefully acknowledge the patients, families, and referring providers who participated in this study. David Williams provided advice for this study.
This work was supported in part by National Institutes of Health/National Institute for Diabetes and Digestive and Kidney Diseases (NIDDK) grant P01 HL048546-21A (to A.S.), Boston Children’s Hospital Mooney Family Fund (to E.F.), and the Fanconi Anemia Research Fund (to E.F. and A.S.). The authors thank the mass spectrometry support from the Chemistry and Analytical Core of the University of North Carolina (UNC) Superfund Research Program (grant P42ES031007).
Authorship
Contribution: J.A.P. analyzed the data and wrote the manuscript; E.F. wrote the study protocol, performed clinical research, and edited the manuscript; S.L. was responsible for statistical design, analysis of clinical characteristic, treatment, response, adverse events, and bone marrow cellularity and contributed to the manuscript; E.E. performed clinical research and contributed to the manuscript; L.E.C. designed and analyzed the endocrine studies and contributed to the manuscript; J.B. conducted the central pathology review and contributed to the manuscript; C.-W.L. and K.L. assayed and analyzed the DNA-protein adducts and contributed to the manuscript; M.J.R.d.H. and J.S. conducted and analyzed the micronucleus assay and contributed to the manuscript; M.M., A.A., A.K., and A.G. collected data and provided regulatory support; M.A. processed samples and conducted and analyzed the hematopoietic colony assays; A.S.K. analyzed the somatic mutations and contributed to the manuscript; K.B. processed samples and conducted and analyzed the hematopoietic colony assays; L.M. conducted and analyzed the chromosomal breakage assays; Y.Z., X.G., and T.A.L. analyzed the proteomics data and contributed to the manuscript; D.B., F.B., C.C., H.H., A.H., T.N., T.O., S.-G.-S., A.A.T., and M.W.W. collected data and contributed to the manuscript; A.D.A. and M.G, contributed to the study concept and development; E.W. was responsible for statistical design, analysis of clinical characteristic, treatment, response, adverse events, and bone marrow cellularity, and contributed to the manuscript; and A.S. was responsible for study design, data analysis, and wrote the manuscript.
Conflict-of-interest disclosure: J.A.P. was on the advisory board for Syndax, Inc. and Kura Oncology. E.F. was employed by Keros Therapeutics (following completion of all protocol enrollment and after all patients had completed protocol therapy). E.E. was on the advisory board for Bluebird Bio. All remaining authors declare no financial competing interests.
Correspondence: Akiko Shimamura, Boston Children’s Hospital, 1 Blackfan Circle, Karp 8210, Boston, MA 02115; e-mail: akiko.shimamura@childrens.harvard.edu.

