

Key Points
Age of onset and survival disparities exist for racial and ethnic minority patients diagnosed with MM.
Differences in somatic mutations in tumor and blood (ie, clonal hematopoiesis) may contribute to disparities in outcomes observed.

Abstract
Multiple myeloma (MM) incidence, mortality, and survival vary by race and ethnicity, but the causes of differences remain unclear. We investigated demographic, clinical, and molecular features of diverse MM patients to elucidate mechanisms driving clinical disparities. This study included 495 MM patients (self-reported Hispanic, n = 45; non-Hispanic Black, n = 52; non-Hispanic White, n = 398). Hispanic and non-Hispanic Black individuals had an earlier age of onset than non-Hispanic White individuals (53 and 57 vs 63 years, respectively, P < .001). There were no differences in treatment by race and ethnicity groups, but non-Hispanic Black patients had a longer time to hematopoietic cell transplant than non-Hispanic White patients (376 days vs 248 days; P = .01). Overall survival (OS) was improved for non-Hispanic Black compared with non-Hispanic White patients (HR, 0.50; 95% CI, 0.31-0.81; P = .005), although this association was attenuated after adjusting for clinical features (HR, 0.62; 95% CI, 0.37-1.03; P = .06). Tumor mutations in IRF4 were most common in Hispanic patients, and mutations in SP140, AUTS2, and SETD2 were most common in non-Hispanic Black patients. Differences in tumor expression of BCL7A, SPEF2, and ANKRD26 by race and ethnicity were observed. Clonal hematopoiesis was detected in 12% of patients and associated with inferior OS in non-Hispanic Black patients compared with patients without clonal hematopoiesis (HR, 4.36; 95% CI, 1.36-14.00). This study provides insight into differences in molecular features that may drive clinical disparities in MM patients receiving comparable treatment, with the novel inclusion of Hispanic individuals.
Introduction
Multiple myeloma (MM) is the second most common hematologic malignancy in the world.1 In the United States, an estimated 34 470 new MM diagnoses will occur in 2022. These diagnoses will be unequally distributed among racial and ethnic groups. MM is twice as common among Black compared with Hispanic and non-Hispanic White individuals,2 and both Black and Hispanic individuals present with disease at an earlier age than non-Hispanic White individuals.3,4 Mortality rates also differ by race and ethnicity, with the highest mortality rates occurring in Black MM patients. Although this high mortality is at least partially attributable to the increased MM incidence in Black individuals,5 other factors such as access to care or disease biology may play a role.
Recent treatment advancements have substantially improved survival of MM patients, with data from the Surveillance, Epidemiology and End Reports (SEER) program showing a 20% increase in 5-year relative survival rates in the last 2 decades (34% in 2000 to 56% in 2020).5 These survival improvements are observed largely among non-Hispanic White MM patients; it is unclear whether racial and ethnic minority groups are also experiencing this survival advantage.4 In fact, studies of SEER-Medicare and large clinical cancer databases show that racial and ethnic minority patients with MM are less likely to receive novel therapies and experience a longer time between diagnosis and initiation of therapy.6-9 These observations in racial and ethnic minority patients diagnosed with MM (higher incidence, earlier age of onset, and disparities in treatment) highlight the critical need to study these populations to inform personalized management and optimize patient outcomes.
Although treatment disparities and delays may contribute to differences in clinical outcomes for racial and ethnic minority patients diagnosed with MM, the factors driving differences in disease presentation and treatment responses are largely unknown. Variability in molecular features by race is a possible explanation for the disparities observed in patients diagnosed with MM. Differences in tumor somatic mutations have been reported between Black and White patients,10,11 but there is limited data on Hispanic patients. Another molecular biomarker that may be associated with pathogenesis and outcomes for MM patients is clonal hematopoiesis (CH). CH, the presence of hematopoietic cells with recurrent somatic mutations in myeloid-malignancy driver genes, has been associated with worse survival in patients with solid tumors but is largely unexplored in the context of MM and especially racial and ethnic minority patients.12,13 In the present study, we investigated demographic, clinical, and molecular features from diverse populations to generate hypotheses about biological mechanisms that may be contributing to clinical disparities for patients diagnosed with MM.
Methods
Study population and clinical data
Patients for this study were consented to the Moffitt Cancer Center’s Total Cancer Care (TCC) Protocol, an Institutional Review Board-approved institutional biorepository.14 Patients who participate in TCC provide written informed consent to: (1) collection of clinical data from medical care; (2) collection of blood, biological fluids, and tissues; (3) storage of biospecimens for long-term use; (4) be followed for life; and (5) be contacted for research studies. In collaboration with the Oncology Research Information Exchange Network, a research partnership among 18 North American cancer centers that fosters collaboration to accelerate cancer discovery, molecular data were generated as described below, and clinical and epidemiological data were collected for select TCC-consented patients. The study reported herein included patients diagnosed and treated for MM at Moffitt Cancer Center who had matched tumor and blood whole-exome sequencing (WES) available through the TCC and Oncology Research Information Exchange Network resources. Patients with monoclonal gammopathy of undetermined significance, smoldering myeloma, or other myeloma spectrum diagnoses who had not progressed to MM within 60 days of blood collection were excluded. Data for this study included United States adults who self-reported as non-Hispanic Black, Hispanic, or Latino (hereafter, Hispanic), and non-Hispanic White. We excluded individuals with missing data on race and ethnicity or those who self-reported being of another race and ethnicity (eg, Asian, Other Pacific Islander) because of small sample sizes. There were no self-reported Hispanic Black patients in the cohort. Clinical data were abstracted from electronic medical records by clinical data abstractors; quality control of data abstraction was conducted by independent reviewers.
Genetic ancestry
In addition to self-reported race and ethnicity, genetic ancestry was quantified using inherited germline variants obtained from WES data. In brief, variants were filtered for quality (VQRSTranche “PASS”), and variants for which strand orientation can be ambiguous (A/Ts and C/Gs) were excluded to avoid error resulting from strand inconsistencies. Variants were intersected with reference populations from the 1000 Genomes Project.15 Genotypes were also filtered for minor allele frequency (>0.01) and pruned to remove variants in high linkage disequilibrium (> 0.3). After quality control and filtering, 55 509 variants remained for analysis. Global ancestry proportions were estimated at k = 5. The concordance of self-reported race and ethnicity with genetic ancestry was visualized after 2-dimensional plotting of coordinates obtained using multidimensional scaling followed by dimensionality reduction by t-Distributed Stochastic Neighbor Embedding. Genotype file processing, variant quality control and filtering, and analysis were performed using R, Plink 1.9,16 VCFTools,17 and Admixture 1.3.18
Sample processing
MM tumor cells were purified from bone marrow aspirates by CD138 affinity chromatography (Miltenyi Biotec, Bergisch Gladbach, Germany), and nucleic acids were isolated from frozen samples containing 1 million purified CD138+ MM cells. Resulting isolated tumor cells and patient-matched whole blood samples were sent to HudsonAlpha Genomic Service Laboratory. Blood and isolated tumor cell DNAs were extracted using QIASymphony (QIAGEN, Hilden, Germany). For each patient, library preparation and WES of tumor and blood were generated using SeqCap Ez Exome Enrichment Kit v3.0 (Roche NimbleGen, Pleasanton, CA) or xGen Exome Research Panel with supplemental probes (Integrated Data Technologies, Inc., Coralville, IA), with tumors targeted to 300× coverage and blood to 100× coverage. Variants were limited to regions covered by both capture kits. WES was performed using a HiSeq 4000 (Illumina, San Diego, CA).
Tumor mutation detection
Tumor somatic mutations were identified in CD138+ plasma cells isolated from bone marrow and using matched whole blood samples as a “normal” reference. Paired sequence reads were aligned to the reference human genome (hs37d5) with the Burrows-Wheeler Aligner,19 and insertion/deletion realignment and quality score recalibration were performed with the Genome Analysis ToolKit.20 Tumor-specific mutations were identified with Strelka21 and MuTect22 and were annotated to determine genic context (eg, nonsynonymous, missense, splicing) using ANNOVAR.23 Additional contextual information was incorporated, including allele frequency in other studies (such as 1000 Genomes, the National Heart, Lung, and Blood Institute Exome Sequence Project, and the Exome Aggregation Consortium24 ), in silico function impact predictions, and observed impacts from databases like ClinVar,25 the Collection of Somatic Mutations in Cancer,26 and The Cancer Genome Atlas. Tumor mutations were retained if they were rare in healthy reference populations (ie, 1000 Genomes frequency ≤ 1%) and likely functional (ie, exclude intergenic mutations, intronic mutations, synonymous single-nucleotide variants, non-frameshift substitutions, frameshift substitutions), and untranslated region mutations. A subset of genes (n = 35) reported to be mutated in other MM tumor sequencing studies, including both Black and White populations,10,27 , -31 were included in our final analysis (supplemental Table 1). Tumor and blood variant allele frequencies (VAFs) were calculated as the number of alternative alleles divided by the depth of sequencing for each patient locus.
Tumor RNAseq
RNA was extracted from MM CD138+ tumor cells using RNeasy Plus Mini Kits (QIAGEN). RNA sequencing (RNAseq) was performed at HudsonAlpha Genomic Service Laboratory using TruSeq RNA Exome (Illumina) with single library hybridization, complementary DNA synthesis, library preparation, and sequencing (100 bp paired-end reads), to a coverage of 100M total reads, on a HiSeq 4000 (Illumina). RNAseq reads were summarized to gene-level expression values using RNA-Seq by Expectation-Maximization 1.3.032 with STAR-2.5.3a aligner,33 hs37d5 as the reference genome, and GENECODE v30 as the gene model. Sequencing strand specificity was verified with RSeQC-2.4,34 and RNAseq quality metrics were gathered using picard-tools-1.82. Additional details on RNAseq quality control methods are provided in supplemental Methods.
Clonal hematopoiesis detection
Blood and tumor (ie, CD138+ plasma cells) sequencing reads were aligned to the human genome (GRCh38) using the BWA-MEM algorithm.35 Variant calling was performed using Genome Analysis ToolKit best practices and MuTect2.20,36 Variants were filtered and annotated using BCFtools.37 Downstream filtering was conducted to identify CH mutations (ie, blood-derived somatic mutations) following the basic premise previously described.38,39 Additional details on CH identification methods are provided in supplemental Methods. Remaining variants detected in the blood with a VAF > 0.05 (due to coverage limitations by WES) were considered CH.
Statistical analysis
The distribution of patient and clinical characteristics was examined overall and by self-reported race and ethnicity using Kruskal-Wallis rank sum tests, Pearson’s χ2 tests, and Fisher’s exact tests, as appropriate. Overall survival (OS) was calculated as the time between diagnosis and death or last contact, and progression-free survival (PFS) was calculated as the time between first treatment and progression (as defined by the International Myeloma Working Group Uniform Response Criteria for Multiple Myeloma40 or, when documentation was unavailable, the date of earliest clinical note denoting progression and planned change of myeloma treatment) or last contact. Unadjusted Kaplan-Meier curves, log-rank tests, and multivariable Cox proportional hazard regression models were used to examine the association of race and ethnicity and CH status with OS and PFS. All models adjusted for age at diagnosis (years), sex (male, female), International Staging System (ISS)41 stage at diagnosis (I, II, III), hematopoietic cell transplantation (HCT) status (ever, never), and frontline treatment (proteasome inhibitor [PI]-based, immunomodulatory drug [IMID]-based, combination PI- and IMID-based, or other regimens). Although dexamethasone was included in most of the frontline treatment regimens, single-agent PI or IMID regimens were used, albeit rarely (< 5%). Schoenfeld residuals for each covariate individually and collectively were used to test the proportional hazards assumption. For the models examining PFS, HCT status violated the proportional hazards assumption and was included as a strata term in the models to allow for different baseline hazard functions by HCT status. Comparisons between tumor mutation frequencies by race and ethnicity were conducted using Pearson’s χ2 test and Fisher’s exact test, as appropriate. Comparisons between log-transformed gene expression levels were conducted using analysis of variance. For this hypothesis-generating study, a P value <.05 was considered statistically significant. Statistical analysis was performed with R version 4.0.4 (15-02-2021).
Results
Study population
This study included 495 patients diagnosed with active MM treated at the Moffitt Cancer Center (Table 1). The majority of MM patients were diagnosed in 2010 or later (81%). The median age at diagnosis was ∼62 years, and there were slightly more males than females. Most patients self-identified as non-Hispanic White (80%), followed by non-Hispanic Black (11%) and Hispanic (9%). Slightly more MM patients (38%) were diagnosed as ISS stage I vs stage II (25%) and stage III (22%) (14% unknown).
Patient characteristics by race and ethnicity
| Hispanic (n = 45) | Non-Hispanic Black (n = 52) | Non-Hispanic White (n = 398) | ||
|---|---|---|---|---|
| Patient characteristics | Median (IQR) or n (%) | Median (IQR) or n (%) | Median (IQR) or n (%) | P |
| Age at MM diagnosis | 53.3 (48.0, 64.4) | 56.8 (49.7, 62.6) | 62.7 (54.7, 69.1) | <.001 |
| Year of MM diagnosis | ||||
| <2010 | 6 (13) | 15 (29) | 71 (18) | .04 |
| 2010-2014 | 20 (44) | 28 (54) | 182 (46) | |
| ≥2015 | 19 (42) | 9 (17) | 145 (36) | |
| Sex | .02 | |||
| Male | 23 (51) | 22 (42) | 244 (61) | |
| Female | 22 (49) | 30 (58) | 154 (39) | |
| ISS at MM diagnosis | >.9 | |||
| I | 20 (50) | 17 (44) | 153 (44) | |
| II | 10 (25) | 13 (33) | 100 (29) | |
| III | 10 (25) | 9 (23) | 92 (27) | |
| Unknown | 5 | 13 | 53 | |
| CH status | .8 | |||
| No CH | 40 (89) | 47 (90) | 347 (87) | |
| CH | 5 (11) | 5 (10) | 51 (13) | |
| Frontline treatment* | .2 | |||
| PI + IMIDs | 18 (40) | 15 (29) | 164 (41) | |
| PI | 19 (42) | 21 (40) | 125 (31) | |
| IMIDs | 6 (13) | 11 (21) | 90 (23) | |
| Others | 2 (4) | 5 (10) | 19 (5) | |
| Time to frontline treatment (days) | 30 (11, 58) | 27 (14, 69) | 27 (13, 62) | .9 |
| HCT | .8 | |||
| HCT | 29 (64) | 30 (58) | 238 (60) | |
| No HCT | 16 (36) | 22 (42) | 160 (40) | |
| Time to HCT (days) | 270 (189, 462) | 376 (234, 823) | 248 (189, 377) | .01 |
IQR, interquartile range.
For the majority of these regimens, patients were also given dexamethasone. Single-agent PIs and IMIDs were used rarely (<5%).
Genetic ancestry
Self-reported race and ethnicity was concordant with genetic ancestry (supplemental Figure 4). Among MM patients that self-reported as non-Hispanic White, the mean proportion of European ancestry was 97%, and among patients that self-reported as non-Hispanic Black, the mean proportion of African and European ancestry was 81% and 13%, respectively. Among Hispanic patients, the mean proportion of European ancestry was 70%, 16% for Indigenous American ancestry, and 12% for African ancestry.
Clinical disparities
Non-Hispanic Black and Hispanic individuals had a younger age at MM diagnosis compared with non-Hispanic White individuals (57 and 53 years, respectively, vs 63 years; P < .001; supplemental Figure 1). There were no differences in frontline therapy or use of HCT by race and ethnicity (Table 1). No differences in the time to drug initiation by race and ethnicity were observed, but non-Hispanic Black patients had a longer time to HCT than Hispanic or non-Hispanic White patients (376 vs 270 and 248 days, respectively; P = .01).
OS of MM patients in this cohort varied by race and ethnicity (P = .008; Figure 1A). These racial and ethnic differences in OS were driven by the better survival of Non-Hispanic Black patients compared with non-Hispanic White patients (P = .004; supplemental Figure 2). In univariable analyses, non-Hispanic Black (hazard ratio [HR], 0.50; 95% confidence interval [CI], 0.31-0.81) and Hispanic patients (HR, 0.66; 95% CI, 0.37-1.19) had better OS compared with non-Hispanic White patients (Table 2). When adjusting for age at diagnosis, stage, and treatment, the associations with OS for non-Hispanic Black and Hispanic patients were consistent but attenuated (HR, 0.62; 95% CI, 0.37-1.03 and HR, 0.76; 95% CI, 0.42-1.38, respectively). Hispanic patients had the shortest PFS compared with the other racial and ethnic groups (P = .08; Figure 1B), which was consistent in pairwise comparisons to both non-Hispanic Black and White patients (P = .04 and P = .06, respectively; supplemental Figure 2B). The worse PFS of Hispanic vs non-Hispanic White patients persisted in univariable and multivariable analyses (HR, 1.41; 95% CI, 0.98-2.03 and HR, 1.44; 95% CI, 0.98-2.10, respectively) (Table 3).
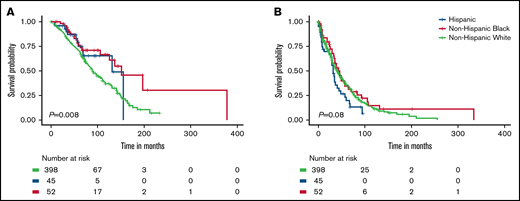
Survival differences for MM patients by race and ethnicity. Overall survival (A) and progression-free survival (B).
Survival differences for MM patients by race and ethnicity. Overall survival (A) and progression-free survival (B).
HRs and 95% CIs for the association between patient characteristics and OS
| Univariable model | Multivariable model | ||||
|---|---|---|---|---|---|
| Patient characteristics | N (event N) | HR (95% CI) | P | HR (95% CI) | P |
| Race and ethnicity | |||||
| Non-Hispanic White | 398 (184) | 1.00 (referent) | 1.00 (referent) | ||
| Non-Hispanic Black | 52 (19) | 0.50 (0.31, 0.81) | .005 | 0.62 (0.37, 1.03) | .06 |
| Hispanic | 45 (12) | 0.66 (0.37, 1.19) | .2 | 0.76 (0.42, 1.38) | .4 |
| Age at MM diagnosis* | 495 (215) | 1.05 (1.04, 1.07) | <.001 | 1.04 (1.02, 1.05) | <.001 |
| Sex | |||||
| Female | 206 (85) | 1.00 (referent) | 1.00 (referent) | ||
| Male | 289 (130) | 1.25 (0.95, 1.65) | .1 | 1.19 (0.89, 1.57) | .2 |
| ISS at MM diagnosis | |||||
| I | 190 (67) | 1.00 (referent) | 1.00 (referent) | ||
| II | 123 (55) | 1.45 (1.02, 2.08) | .04 | 1.49 (1.04, 2.13) | .03 |
| III | 111 (54) | 1.49 (1.04, 2.14) | .03 | 1.33 (0.92, 1.92) | .1 |
| Unknown | 71 (39) | 0.86 (0.57, 1.29) | .5 | 0.80 (0.53, 1.21) | .3 |
| HCT | |||||
| No HCT | 198 (90) | 1.00 (referent) | 1.00 (referent) | ||
| HCT | 297 (125) | 0.50 (0.38, 0.66) | <.001 | 0.65 (0.47, 0.89) | .008 |
| Frontline treatment† | |||||
| PI + IMIDs | 197 (58) | 1.00 (referent) | 1.00 (referent) | ||
| PI | 165 (89) | 1.47 (1.06, 2.05) | .02 | 1.44 (1.03, 2.02) | .03 |
| IMIDs | 107 (52) | 0.83 (0.56, 1.22) | .3 | 0.75 (0.51, 1.10) | .1 |
| Others | 26 (16) | 0.56 (0.31, 1.02) | .06 | 0.67 (0.36, 1.23) | .2 |
HR reflects the association of a 1-year increase in age at MM diagnosis with OS.
For the majority of these regimens, patients were also given dexamethasone. Single-agent PIs and IMIDs were used rarely (<5%).
HRs and 95% CIs for the association between patient characteristics and PFS
| Univariable model | Multivariable model | ||||
|---|---|---|---|---|---|
| Patient characteristics | N (event N) | HR (95% CI) | P | HR (95% CI) | P |
| Race and ethnicity | |||||
| Non-Hispanic White | 398 (249) | 1.00 (referent) | 1.00 (referent) | ||
| Non-Hispanic Black | 52 (36) | 0.83 (0.58, 1.19) | .3 | 0.95 (0.66, 1.37) | .8 |
| Hispanic | 45 (33) | 1.41 (0.98, 2.03) | .07 | 1.44 (0.98, 2.10) | .06 |
| Age at MM diagnosis* | 495 (318) | 1.01 (1.00, 1.02) | .2 | 1.00 (0.99, 1.01) | .6 |
| Sex | |||||
| Female | 206 (128) | 1.00 (referent) | 1.00 (referent) | ||
| Male | 289 (190) | 1.22 (0.97, 1.53) | .09 | 1.26 (1.00, 1.59) | .05 |
| ISS at MM diagnosis | |||||
| I | 190 (113) | 1.00 (referent) | 1.00 (referent) | ||
| II | 123 (75) | 1.25 (0.93, 1.68) | .1 | 1.23 (0.91, 1.66) | .2 |
| III | 111 (79) | 1.32 (0.99, 1.76) | .06 | 1.31 (0.97, 1.77) | .07 |
| Unknown | 71 (51) | 0.74 (0.53, 1.04) | .08 | 0.74 (0.52, 1.04) | .09 |
| HCT | |||||
| No HCT | 198 (113) | 1.00 (referent) | 1.00 (referent) | ||
| HCT | 297 (205) | 0.77 (0.61, 0.97) | .03 | N/A† | |
| Frontline treatment‡ | |||||
| PI + IMIDs | 197 (103) | 1.00 (referent) | 1.00 (referent) | ||
| PI | 165 (118) | 1.12 (0.86, 1.47) | .4 | 1.17 (0.89, 1.53) | .3 |
| IMIDs | 107 (73) | 0.77 (0.57, 1.05) | .1 | 0.83 (0.61, 1.14) | .2 |
| Others | 26 (24) | 0.61 (0.38, 1.00) | .05 | 0.69 (0.42, 1.14) | .2 |
HR reflects the association of a 1-year increase in age at MM diagnosis with overall survival.
HCT violated the proportional hazard assumption and was included as a strata term in the multivariable model; therefore, no HR is provided for this variable.
For the majority of these regimens, patients were also given dexamethasone. Single-agent PIs and IMIDs were used rarely (<5%).
Molecular disparities
Sequencing quality.
Of the 495 MM patients included in matched blood and tumor sequencing, 5 (1%) had indications of tumor-normal sample mismatch or contamination as evidenced by disproportionately high rates of tumor mutations (ie, >1000) and widening of the peak of mutations around 0%, 50%, and 100% VAF in one of the samples (ie, suggesting contamination with DNA from >1 patient’s germline included). These 5 patients were excluded from molecular analyses. For the 490 patients analyzed, WES of tumor and blood DNA generated an average of 222 million and 84 million paired reads per sample, respectively. Reads mapped well to the reference human genome, with >99% properly mapped reads in both sample types and low duplication rates (36% in tumor and 21% in blood). Average depth of coverage for the target regions were 291× in tumor and 131× in blood.
Tumor mutations and RNA expression.
Somatic mutations in the MM genes included were identified in CD138+ tumor samples for 459 (of 490) patients with MM (94%). The most mutated genes overall were KRAS (24%), NRAS (17%), TP53 (11%), DIS3 (9%), and BRAF (9%) (Figure 2A; supplemental Table 1). Genes with differences in mutation rates by race and ethnicity were IRF4 (Hispanic 11% vs non-Hispanic Black 0% vs non-Hispanic White 3.3%; P = .02), SETD2 (Hispanic 4.4% vs non-Hispanic Black 5.8% vs non-Hispanic White 1%; P = .025), and SP140 (Hispanic 6.7% vs non-Hispanic Black 12% vs non-Hispanic White 3.8%; P = .04) (supplemental Table 1). Pairwise comparisons identified a higher prevalence of IRF4 mutations in Hispanic compared with non-Hispanic White patients and a higher prevalence of SP140, AUTS2, and SETD2 mutations in non-Hispanic Black compared with non-Hispanic White patients (Figure 2B; supplemental Table 1). When analyzing RNAseq results for the MM genes also assessed for tumor mutations, there were 3 genes identified as having an association with race and ethnicity: BCL7A (P = .012), SPEF2 (P = .043), and ANKRD26 (P = .026) (Figure 2C; supplemental Figure 3). Pairwise comparisons identified that the primary driver of these racial and ethnic differences in expression of BCL7A, SPEF2, and ANKRD26 was the difference between non-Hispanic White and Black patients (P < .05). These results were consistent both with and without imputation of missing values.
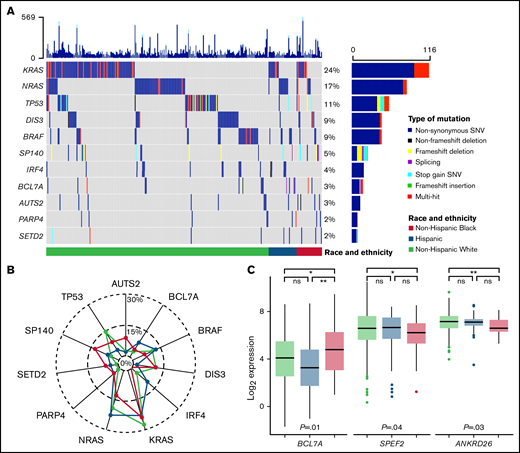
Tumor molecular differences by race and ethnicity. (A) Oncoplot of selected tumor somatic mutations in MM patients by race and ethnicity. Each row is a gene and vertical lines are individual patients, grouped by race and ethnicity. Each gene is counted once per patient, and colors represent the presence of different functional types of mutations. Selected mutations include the 5 most commonly mutated genes and those with racial and ethnic differences in prevalence at P ≤ 0.1. A comprehensive list of tumor somatic mutations in the MM genes (n = 35) and their frequencies by race and ethnicity is provided in supplemental Table 1. (B) Radar plot of the prevalence of selected tumor somatic mutations by race and ethnicity. (C) Racial and ethnic differences in RNA expression of MM genes that reached statistical significance at P < 0.05. Expression is normalized and displayed as log2 (100× transcripts per million). P values for the pairwise comparisons are presented as *P < .05, **P < .01. ns, not statistically significant; SNV, single nucleotide variant.
Tumor molecular differences by race and ethnicity. (A) Oncoplot of selected tumor somatic mutations in MM patients by race and ethnicity. Each row is a gene and vertical lines are individual patients, grouped by race and ethnicity. Each gene is counted once per patient, and colors represent the presence of different functional types of mutations. Selected mutations include the 5 most commonly mutated genes and those with racial and ethnic differences in prevalence at P ≤ 0.1. A comprehensive list of tumor somatic mutations in the MM genes (n = 35) and their frequencies by race and ethnicity is provided in supplemental Table 1. (B) Radar plot of the prevalence of selected tumor somatic mutations by race and ethnicity. (C) Racial and ethnic differences in RNA expression of MM genes that reached statistical significance at P < 0.05. Expression is normalized and displayed as log2 (100× transcripts per million). P values for the pairwise comparisons are presented as *P < .05, **P < .01. ns, not statistically significant; SNV, single nucleotide variant.
CH.
We identified CH in 60 (of 490) patients with MM (12%). The most frequently mutated CH genes in our cohort were ASXL1 (33%), DNMT3A (17%), TET2 (17%), and TP53 (15%). The median VAF in blood was 0.11 (range, 0.05-0.79), and most patients (48/60, 80%) had only 1 CH mutation. Presence of CH in MM patients was associated with age (median, 65 years vs 61 years; P < .001) and ISS stage at diagnosis (P = .015) (supplemental Table 2). There were no differences in the prevalence of CH (supplemental Table 2) or the distribution of CH genes mutated by race and ethnicity (supplemental Table 3).
There was a difference in the association between CH status and OS among non-Hispanic Black patients (P = .007) but not non-Hispanic White or Hispanic patients (P = .88 and 0.51, respectively) (Figure 3Ai-iii). For non-Hispanic Black patients, presence of CH (HR, 4.36; 95% CI, 1.36-14.00) was associated with inferior OS (supplemental Table 4). In multivariable analysis, the positive association with CH status among non-Hispanic Black patients persisted but was attenuated (HR, 2.72; 95% CI, 0.48-15.40). There were no differences in PFS by CH status among non-Hispanic Black and Hispanic patients (Figure 3Bi-ii). We observed inferior PFS for non-Hispanic White patients with CH (P = .07; Figure 3Biii), which was consistent in multivariable analyses (HR, 1.41; 95% CI, 0.98-2.05) (supplemental Table 4).
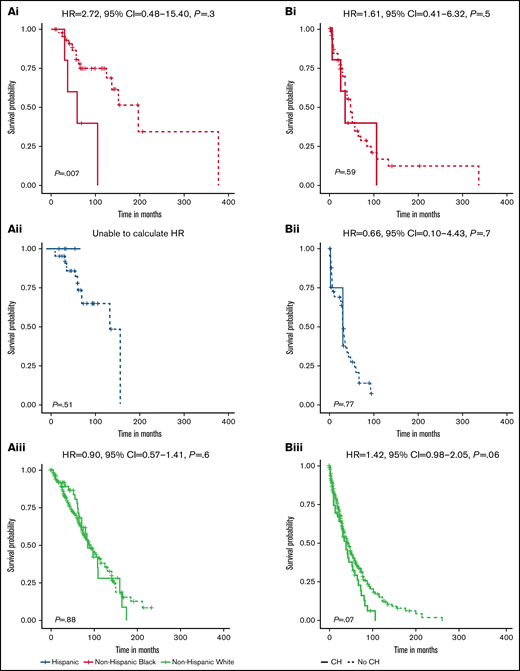
Survival differences for MM patients by CH status and race and ethnicity. Stratified OS curves with multivariable HRs and 95% CIs for the association of CH status with risk of mortality are provided for non-Hispanic Black (Ai, Bi), Hispanic (Aii, Bii), and non-Hispanic White (Aiii, Biii) MM patients. Multivariable models are adjusted for age at MM diagnosis, sex, ISS at MM diagnosis, HCT, and frontline treatment regimen. The HR for OS among Hispanic MM patients could not be calculated because no deaths occurred in the patients with CH (n = 5).
Survival differences for MM patients by CH status and race and ethnicity. Stratified OS curves with multivariable HRs and 95% CIs for the association of CH status with risk of mortality are provided for non-Hispanic Black (Ai, Bi), Hispanic (Aii, Bii), and non-Hispanic White (Aiii, Biii) MM patients. Multivariable models are adjusted for age at MM diagnosis, sex, ISS at MM diagnosis, HCT, and frontline treatment regimen. The HR for OS among Hispanic MM patients could not be calculated because no deaths occurred in the patients with CH (n = 5).
Discussion
In a diverse cohort of MM patients treated at a National Cancer Institute Comprehensive Cancer Center (NCI-CCC), there were differences in clinical and molecular features by race and ethnicity that correlated with outcomes. Racial and ethnic minority groups had a median age of MM diagnosis ∼6 to 10 years younger than non-Hispanic White patients. Non-Hispanic Black MM patients had a longer time from diagnosis to HCT. Differences in OS, but not PFS, were noted by race and ethnicity; however, these associations did not persist after adjusting for clinical- and treatment-level characteristics. The novel aspects of this study focus primarily on the molecular differences across racial and ethnic groups. Although the distribution of tumor mutations for MM patients was as expected based on literature,42 differences in tumor mutation frequencies were observed by race and ethnicity. A notable effect of CH on OS in non-Hispanic Black patients was observed, conferring over a fourfold increased risk of mortality. However, adjustment for demographic and clinical factors attenuated the association.
The present study observed marked differences in age of onset and time to HCT by race and ethnicity. Non-Hispanic Black and Hispanic individuals had an earlier age of MM onset compared with non-Hispanic White individuals, and this finding has been consistently replicated in other studies.4 The overall median age of MM onset in the present cohort is younger than what has been reported in population-based data (62 vs 69 years, respectively), which is due, in part, to Moffitt Cancer Center being a transplant referral center. Although no differences in utilization of HCT were noted by race and ethnicity in our NCI-CCC cohort, non-Hispanic Black patients had a longer time from diagnosis to HCT compared with Hispanic and non-Hispanic White patients. Studies leveraging data from SEER-Medicare7,8 and the Center for International Blood and Marrow Transplant Research6 found that use of HCT was lowest in Hispanic patients with MM, followed by Black patients, and both populations were less likely to receive HCT than non-Hispanic White patients. Likewise, Black and Hispanic patients had a longer time from diagnosis to HCT than White patients. Additional studies showed that Black patients with MM had lower utilization of HCT compared with White patients, but neither delays in HCT nor Hispanic MM patients were investigated.43-45 Collectively, these findings are counterintuitive considering the younger age of MM onset in racial and ethnic minority groups, which would be predicted to correspond to higher use of HCT; however, barriers in care (eg, socioeconomic factors, insurance status, travel distance) that disproportionately affect racial and ethnic minority groups may also play a role.46-50
Despite the delays in HCT experienced by non-Hispanic Black patients in our cohort, no differences in OS or PFS were observed by race and ethnicity after adjusting for prognostic factors. These findings are confirmatory in nature. Studies show that with similar access to care and novel treatment utilization, as would be expected at an NCI-CCC, clinical outcomes are similar across racial and ethnic groups, with some studies suggesting slightly improved outcomes for Black patients.6,8,51 In fact, despite the earlier age of onset in non-Hispanic Black and Hispanic patients in our cohort, the age at death was not different from non-Hispanic White patients (66 and 59 vs 67 years, respectively; P = .1; data not shown). Large clinical trial databases also show comparable outcomes across race and ethnicity with access to cutting-edge therapeutics52-54 ; however, low accrual of racial and ethnic minority individuals in trials brings into question the generalizability of these findings.
This study provides the first assessment of somatic alterations, in tumor and blood, for diverse MM patients, with the novel inclusion of Hispanic patients. We identified 4 genes with differential tumor mutation profiles by race and ethnicity: SP140, AUTS2, and SETD2 were most mutated in non-Hispanic Black patients, and IRF4 mutations were most common in Hispanic patients. These differences observed are consistent with previous studies of Black and White MM patients, including the absence of IRF4 mutations in Black patients10 ; however, the high prevalence of IRF4 mutations in Hispanic patients with MM is a novel finding, which informs hypotheses for differences in disease biology by race and ethnicity. IRF4 encodes interferon regulatory factor 4, which plays an essential role in controlling B-cell to plasma-cell differentiation and is central to the pathogenesis of MM.55 Dysregulation of IRF4 is associated with poor prognosis and response to immunomodulatory inibitors56 and is being investigated as a novel treatment strategy for patients with MM,57 thus providing direct translational implications of this disparity. We also conducted exploratory analyses to investigate whether these mutations may be associated with OS and PFS within each racial and ethnic group. We observed inferior OS for MM patients with AUTS2 mutations among Hispanic individuals (P = .006) and inferior PFS for MM patients with SP140 mutations among non-Hispanic Black individuals (P = .02; data not shown). We were unable to further examine these associations in multivariable analyses due to the small sample size. Notably, we did not observe any BRAF V600 mutations in non-Hispanic Black patients (Hispanic 4% and non-Hispanic White 5%), which may also have therapeutic implications, as the efficacy of BRAF inhibitors is currently being evaluated in clinical trials.58,59 Our results were also consistent with TP53 mutations occurring more in White patients compared with Black patients, although not statistically significant (non-Hispanic Black 7.7% vs Hispanic 4.4% vs non-Hispanic White 13%).
Another novel aspect of our study was the exploration of gene expression differences across race and ethnicity. When assessing the subset of genes mutated in MM, we noted differences in RNA expression of 3 genes: BCL7A, SPEF2, and ANKRD26. Although the prevalence of tumor somatic mutations in these genes did not meet statistical significance, intriguing differences in the directions of the effects were noted. For example, higher prevalence of BCL7A tumor mutations in Black MM patients compared with White patients has been reported previously.10 Our cohort showed a similar pattern (non-Hispanic Black 4% vs non-Hispanic White 3%), but most notably, the prevalence of BCL7A mutations was highest in Hispanic MM patients (9%). The tumor gene expression level was inversely related to the prevalence of BCL7A tumor mutations, with Hispanic patients having the lowest expression. Recently, mutations in BCL7A that downregulate expression were shown to induce MM tumor cell proliferation,60 thus alluding to the potential therapeutic opportunity of these alterations. Likewise, prevalence of SPEF2 mutations was inversely related to the gene expression level, with non-Hispanic Black patients having the highest prevalence of tumor mutations (2%) and the lowest RNA expression. The translational impact of this finding is less clear at this time. Taken together, these findings contribute to hypothesis generation regarding potential differences in MM pathological drivers that may contribute to observed disparities across racial and ethnic groups.
This study provides the first data exploring CH as a biomarker in patients with MM in the context of race and ethnicity. Although there are no robust published studies investigating CH across racial and ethnic subgroups, exploratory findings suggest that the prevalence of CH is similar across racial and ethnic groups or slightly higher in White individuals.13,61 The prevalence, distribution, and characteristics of CH across the diverse cohort of MM patients in our study were similar to other cancer cohorts. Although we did not observe a difference in frequency of CH by race and ethnicity, differences in the clinical impact of CH by race and ethnicity cannot be ruled out. Specifically, CH as a predictor of inferior OS in non-Hispanic Black patients with MM and PFS in non-Hispanic White patients with MM warrant further investigation in larger cohorts.
Although our cohort provided a diverse group of patients with comprehensive clinical and molecular data, limitations in the present study exist. First, our analysis included a relatively small sample size of racial and ethnic minority MM patients, especially within subgroups (eg, CH+), limiting the precision of the effect estimates and the power to detect small effect sizes. This also limited our power to further stratify Hispanic MM patients into ethnic subgroups (eg, Mexican, Puerto Rican, Cuban), potentially masking subgroup differences in clinical outcomes, CH status, or tumor alterations. The observational design of our study provided challenges with standardizing analyses by treatment effects; however, it also provides the opportunity to explore real-world differences in clinical practice that influence outcomes for racial and ethnic minority groups. Moreover, treatment utilization and access to novel therapeutics at an NCI-CCC may be different than community hospitals. Data on cytogenetic abnormalities prior to treatment were missing for the majority of MM patients in our cohort (∼70%) and were not included in the present analysis. Not all patients included in our analyses were newly diagnosed, which may impact the prevalence of somatic mutations (both tumor-derived and CH); however, the distribution of disease statuses in our cohort was similar by race and ethnicity (Fisher’s exact test P value = .9), ensuring comparability between the groups. Additionally, a survivorship bias may be present with the inclusion of relapsed MM patients, potentially limiting the generalizability of our findings to non–rapidly fatal cases. Finally, use of WES for CH classification limited our detection threshold for CH mutations (≥5% VAF); however, substantial data exists supporting higher VAF mutations as conferring the strongest clinical effects, of which we successfully captured with this detection threshold.12,62,63
This study provides evidence of differences in clinical and molecular presentation of MM that correlates with outcomes based on race and ethnicity, with the novel inclusion of Hispanic patients. Although we did not observe statistically significant differences in clinical outcomes by race and ethnicity after adjusting for known prognostic factors, equal access to care and novel therapeutics in our NCI-CCC–treated cohort may explain this observation. Tumor molecular feature presentation varied by race and ethnicity, which helps inform hypotheses for future studies and, ultimately, is an important factor to take into consideration when conducting clinical trials and making personalized treatment decisions. Although we provide the first-in-kind data on Hispanic patients with MM, studies in larger populations are warranted to confirm the reported associations and provide more definitive insight into the mechanisms driving clinical disparities for patients diagnosed with MM.
Acknowledgments
This research was made possible through the Total Cancer Care Protocol in collaboration with the H. Lee Moffitt Cancer Center & Research Institute and supported, in part, by the Collaborative Data Services Core Facility, Tissue Core Facility, Molecular Genomics Core Facility, and Biostatistics and Bioinformatics Shared Resource at the H. Lee Moffitt Cancer Center & Research Institute, a National Cancer Institute (NCI)-designated Comprehensive Cancer Center (P30-CA076292). The whole-exome sequencing and RNAseq data included in this work were obtained through the Oncology Research Information Exchange Network Avatar Project, which is managed and funded, in part, by M2Gen, a for-profit company. M2Gen received funding from third-party partners to partially support data generated in the Avatar Project. Funding for this work was also provided by a Miles for Moffitt Research Grant (H. Lee Moffitt Cancer Center & Research Institute). The authors would like to thank the Pentecost Family Myeloma Research Center for their support to the Multiple Myeloma Working Group (H. Lee Moffitt Cancer Center & Research Institute), and the PHSU-MCC PACHE Partnership Quantitative Sciences Core (U54CA163071 and U54CA163068).
Authorship
Contribution: N.G. designed the study; C.M.C.-L. performed the statistical analysis; J.D., M.T., J.K.T., and D.D. contributed to the bioinformatics data analysis; Q.M. provided statistical support; L.C.P. and N.G. drafted the manuscript; R.R.A., G.D.A., E.M.S., O.A.H., and A.S.S. contributed to data collection; M.A., J.B., B.B., R.B., T.N., and K.H.S. evaluated patients in the study; and all authors reviewed and edited the initial version of the manuscript and approved the final version of the manuscript.
Conflict-of-interest disclosure: O.A.H. is employed by M2Gen, a for-profit company focused on providing oncology health informatics solutions to accelerate cancer treatment discovery, development, and delivery by leveraging clinical and molecular data. B.B. is on the advisory board for Janssen Pharmaceuticals. T.N. reports research support to Moffitt Cancer Center by Novartis (for clinical trial support) and Karyopharm Therapeutics (for drug supply for a clinical trial).
Correspondence: Nancy Gillis, Moffitt Cancer Center, 12902 Magnolia Dr., MRC-CANCONT, Tampa, FL 33612; e-mail: nancy.gillis@moffitt.org.

