

Key Points
The lipid raft protein flotillin 2 differentially influences disease course in murine CML, but not AML.
The flotillin 2-CD44-CDC42 axis regulates CML via an impact on the cytoskeleton and homing ability of leukemia- initiating cells.

Abstract
Lipid raft-associated proteins play a vital role in membrane-mediated processes. The lipid microdomain-associated protein flotillin 2 (FLOT2), which has a scaffolding function, is involved in polarization, as well as in actin cytoskeletal organization of primitive and mature hematopoietic cells and has been associated with different malignancies. However, its involvement in myeloid leukemias is not well studied. Using murine transplantation models, we show here that the absence of FLOT2 from leukemia-initiating cells (LICs) altered the disease course of BCR-ABL1+ chronic myeloid leukemia (CML), but not of MLL–AF9-driven acute myeloid leukemia (AML). While FLOT2 was required for expression of the adhesion molecule CD44 on both CML- and AML-LIC, a defect in the cytoskeleton, cell polarity, and impaired homing ability of LIC was only observed in FLOT2-deficient BCR-ABL1+ compared with MLL-AF9+ cells. Downstream of CD44, BCR-ABL1 kinase-independent discrepancies were observed regarding expression, localization, and activity of cell division control protein 42 homolog (CDC42) between wild-type (WT) and FLOT2-deficient human CML and AML cells. Inhibition of CDC42 by ML141 impaired the homing of CML LIC and, thereby, CML progression. This suggested that alteration of both CD44 and CDC42 may be causative of impaired CML progression in the absence of FLOT2. In summary, our data suggest a FLOT2-CD44-CDC42 axis, which differentially regulates CML vs AML progression, with deficiency of FLOT2 impairing the development of CML.
Introduction
The bone marrow (BM) microenvironment (BMM), a complex entity consisting of various cell types, an extracellular matrix, cytokines, and chemical and mechanical factors, maintains regulatory interactions with normal hematopoietic stem cells (HSCs) and immune cells. Similarly, the BMM provides and receives reciprocal signals between its own milieu and hematological malignancies such as leukemia, thereby promoting leukemia progression and furnishing chemoresistance of leukemias.1
The exact molecular nature of these interactions is the object of intense study, but it is known that adhesion between leukemia cells and the BMM is instrumental for leukemic spread.1 CD44, for example, an adhesion molecule, cell surface glycoprotein, and selectin ligand,2 is required for homing and engraftment of leukemia stem cells in chronic myeloid leukemia (CML)3 and acute myeloid leukemia (AML),4 as inhibition or loss of CD44 resulted in a reduction of leukemia burden or survival prolongation in murine models. However, deficiency of CD44 was dispensable for BCR–ABL1-driven B-cell acute lymphoblastic leukemia (B-ALL).3 Furthermore, inhibition of E-selectin, expressed on vascular endothelium, influenced the retention and quiescence of CML cells in the BMM via CD44.5 On the leukemia cell side, L-selectin and P-selectin glycoprotein ligand-1 (PSGL-1), a membrane-associated glycoprotein, contributed to the homing and engraftment of CML-initiating cells in the BMM.6
This same adhesion molecule, PSGL-1, which contains sialyl-LewisX tetrasaccharide structures similar to CD44, plays a role in the migration of T cells7 and physically interacts with flotillins.8 Flotillin 1 (FLOT1) and flotillin 2 (FLOT2) (Reggie-2 and Reggie-1, respectively) are conserved, ubiquitously expressed proteins associated with the plasma membrane, where they are thought to act as scaffolding proteins of lipid microdomains or rafts.9,10 Flotillins are involved in uropod formation in neutrophils11 and polarization in primitive and mature hematopoietic cells,12 as well as in actin cytoskeletal organization,13,14 phagocytosis, and endocytosis.15,16 Due to their association with receptor tyrosine kinases17-19 or adhesion molecules, flotillins play an important role in normal and malignant cell physiology.20-22
Based on these functions and interactions with PSGL-1, we hypothesized that flotillins might play a role in leukemia progression, either by influencing cytoskeletal organization or the structure of adhesion molecules known to play a role in leukemia-initiating cell (LIC) engraftment, such as CD44.
In this study, we have identified a previously unknown and differential role of flotillin 2 for CML vs AML via regulation of CD44 and cell division control protein 42 homolog (CDC42), a member of the Rho GTPase family. Using Flot2 knockout (KO) mice in retroviral transduction/transplantation models, we show that FLOT2 is important for CML but not AML progression. While FLOT2 regulates surface expression of CD44 in both CML and MLL-AF9+ AML, homing and cytoskeletal defects of FLOT2-deficient LIC and survival prolongation of mice transplanted with FLOT2-deficient LIC were only observed in CML. Our data suggest that alteration of CDC42 activity, in addition to CD44 expression, in the absence of FLOT2 may be responsible for this phenotype in CML.
Materials and methods
BM transduction and transplantation
Generation of MSCV-IRES-GFP-, MSCV-IRES-GFP-BCR-ABL1-, MSCV-IRES-GFP MLL-AF9-, and MSCV-IRES-CD44-BCR-ABL1-expressing retrovirus3 and transplantations were performed as described previously.23 In brief, donor BM cells from 5-fluorouracil (5-FU)-pretreated mice were transduced twice with retrovirus and IV-transplanted into sublethally irradiated (900 cGy) wild-type (WT) recipient mice at a dose of 2.5 × 10⁵ or 5 × 10⁵ cells to induce CML or AML, respectively.
B-ALL was induced by retroviral transduction of non-5–FU-pretreated BM cells with MSCV-IRES-GFP-BCR-ABL1-expressing retrovirus and transplantation of 1 × 10⁶ cells into sublethally irradiated (900 cGy) WT recipient mice.
The intrafemoral transplantation was performed as described,3 with 2.5 × 10⁵ MSCV-IRES-GFP-BCR-ABL1-transduced BM cells being resuspended in 50 μL phosphate-buffered saline and injected intrafemorally into sublethally irradiated (900 cGy) recipient mice.
All murine studies were approved by the local animal care committee (Regierungspräsidium Darmstadt) in Hessen, Germany.
Human samples
The collection and use of human leukemia cells by the Biological Resource Center of Léon Bérard (no. BB-0033-00050) was declared to the Ministry of Research, France (DC-2008-99 and AC-2019-3426). The study was conducted in accordance with the Declaration of Helsinki and approved by the ethical review board of Centre Léon Bérard. The use of normal human HSCs was approved by the Ethics Committee of the University Clinic of the Goethe University Frankfurt (approval number 329/10 for anonymized rest material).
Statistical analysis
Survival analysis was performed by Kaplan–Meier-style curves and log-rank (Mantel-Cox) or Gehan-Breslow-Wilcoxon tests. Differences were assessed by Student t test, by 1-way or 2-way ANOVA. Tukey tests were used as posthoc tests. The data were presented as mean ± standard deviation; P ≤ .05 was considered significant.
Results
Deficiency of FLOT2 is associated with particular changes in peripheral blood (PB) and BM
Investigating the hematological profile of Flot1 vs Flot2 KO mice, which are known to be viable and fertile,24 we observed no abnormalities in Flot1 KO mice (data not shown). In Flot2 KO mice, we found a significant decrease in leukocyte counts (supplemental Figure 1A) and an increase in the percentage of B cells (B220+) in the PB compared with WT mice (P = .0204) (Figure 1A; supplemental Table 1). No differences in these cell types were observed in BM or spleen (supplemental Figure 1B-C). A significantly higher percentage of Lin− c-Kit+ Sca1+ (LKS), but not CD150+ CD48- LKS (LKS SLAM) HSCs were found in the PB of Flot2 KO mice (P = .0006) (Figure 1B). There were, however, no differences in LKS or LKS SLAM cells in BM or spleen of Flot2 KO compared with WT mice (supplemental Figure 1D-E). As the results in PB may have been due to increased mobilization given the known role of flotillins for adhesion of hematopoietic cells, we tested granulocyte-colony stimulating factor (G-CSF)-mediated mobilization given at a lower dose to augment possible differences.25 This led to a significant increase in the percentage of LKS cells in the PB of Flot2 KO compared with WT mice (P = .04) (Figure 1C; supplemental Figure 1F), but no significant changes in BM or spleen (supplemental Figure 1G-J).
![Deficiency of FLOT2 is associated with particular changes in PB and BM. (A) Percentage of CD11b+ myeloid cells, B220+ B cells, CD3+ T cells, and Ter119+ erythrocytes of total cells in the PB of WT (red) vs Flot2 KO (Flot2) (blue) mice (P = .0204; ANOVA; Tukey test; n = 10-11). (B) Percentage of Lin− c-Kit+ Sca1+ (LKS) or LKS CD150+ CD48- (LKS SLAM) cells of total leukocytes in PB of WT (red) vs Flot2 KO (blue) mice (P = .0006; ANOVA; Tukey test; n = 3). (C) Percentage of LKS cells of total leukocytes in the PB of WT (red) or Flot2 KO (blue) mice treated with either vehicle or G-CSF (4 µg/dose for 4 consecutive days) (P = .0409 ANOVA; Tukey test; n = 5). (D) Cell cycle analysis of LKS cells, derived from BM of WT or Flot2 KO mice, stained with anti-ki67 and DAPI. The cells are gated on LKS cells (P = .0144; ANOVA; Tukey test; n = 4). (E) Immunofluorescence staining showing the localization of myosin IIa in uropods of WT or Flot2 KO Lin- cells treated with vehicle or CXCL12 (1 ng/µL) for 30 minutes. The same effect was observed after a CXCL12 exposure of 4 hours (data not shown). The images are representative of 3 independent experiments. The scale bar represents 10 µm. (F) Quantification of the percentage of myosin IIa staining in uropods in WT (red) or Flot2 KO (blue) Lin- cells per image as in (E) (P =.0008 [WT]; n.s. [Flot2 KO]; ANOVA; Tukey test; n = 10-15).](https://ash.silverchair-cdn.com/ash/content_public/journal/bloodadvances/6/12/10.1182_bloodadvances.2021005992/6/m_advancesadv2021005992f1.png?Expires=1769901359&Signature=2za2KGXQho5O6hpYkL3KimQrTbs8zn~vuowcgfqqAU72~THd3fl1IT~Xx2g8gBbqg16WpNDuHsNa-bABEQBmvUSWFfi9HSDC2QdSs7-nhk3JT3RCTIieY1QiuzUulkLwDsN5ghM3LQ1hwEFPACTu6EYpdGdGPMN5-hx9sJnLTOEZWU8vYs8Mb8-nMAGnTKueLSa3ik6WtSRsjenq0KGvEgoZMNxh0OGB0ZiKoEPU00~Pr2enql08niTwlbylYycxeLo5XJdfYwHJ6nTwAmy4kcVLAo7XaqCQsrNqX83qcKOt8CuywAk1TonYGWVPkAbsVq2SDxFPoWnal0VYd8HHEw__&Key-Pair-Id=APKAIE5G5CRDK6RD3PGA)
Deficiency of FLOT2 is associated with particular changes in PB and BM. (A) Percentage of CD11b+ myeloid cells, B220+ B cells, CD3+ T cells, and Ter119+ erythrocytes of total cells in the PB of WT (red) vs Flot2 KO (Flot2) (blue) mice (P = .0204; ANOVA; Tukey test; n = 10-11). (B) Percentage of Lin− c-Kit+ Sca1+ (LKS) or LKS CD150+ CD48- (LKS SLAM) cells of total leukocytes in PB of WT (red) vs Flot2 KO (blue) mice (P = .0006; ANOVA; Tukey test; n = 3). (C) Percentage of LKS cells of total leukocytes in the PB of WT (red) or Flot2 KO (blue) mice treated with either vehicle or G-CSF (4 µg/dose for 4 consecutive days) (P = .0409 ANOVA; Tukey test; n = 5). (D) Cell cycle analysis of LKS cells, derived from BM of WT or Flot2 KO mice, stained with anti-ki67 and DAPI. The cells are gated on LKS cells (P = .0144; ANOVA; Tukey test; n = 4). (E) Immunofluorescence staining showing the localization of myosin IIa in uropods of WT or Flot2 KO Lin- cells treated with vehicle or CXCL12 (1 ng/µL) for 30 minutes. The same effect was observed after a CXCL12 exposure of 4 hours (data not shown). The images are representative of 3 independent experiments. The scale bar represents 10 µm. (F) Quantification of the percentage of myosin IIa staining in uropods in WT (red) or Flot2 KO (blue) Lin- cells per image as in (E) (P =.0008 [WT]; n.s. [Flot2 KO]; ANOVA; Tukey test; n = 10-15).
Deficiency of FLOT2 is associated with particular changes in PB and BM. (A) Percentage of CD11b+ myeloid cells, B220+ B cells, CD3+ T cells, and Ter119+ erythrocytes of total cells in the PB of WT (red) vs Flot2 KO (Flot2) (blue) mice (P = .0204; ANOVA; Tukey test; n = 10-11). (B) Percentage of Lin− c-Kit+ Sca1+ (LKS) or LKS CD150+ CD48- (LKS SLAM) cells of total leukocytes in PB of WT (red) vs Flot2 KO (blue) mice (P = .0006; ANOVA; Tukey test; n = 3). (C) Percentage of LKS cells of total leukocytes in the PB of WT (red) or Flot2 KO (blue) mice treated with either vehicle or G-CSF (4 µg/dose for 4 consecutive days) (P = .0409 ANOVA; Tukey test; n = 5). (D) Cell cycle analysis of LKS cells, derived from BM of WT or Flot2 KO mice, stained with anti-ki67 and DAPI. The cells are gated on LKS cells (P = .0144; ANOVA; Tukey test; n = 4). (E) Immunofluorescence staining showing the localization of myosin IIa in uropods of WT or Flot2 KO Lin- cells treated with vehicle or CXCL12 (1 ng/µL) for 30 minutes. The same effect was observed after a CXCL12 exposure of 4 hours (data not shown). The images are representative of 3 independent experiments. The scale bar represents 10 µm. (F) Quantification of the percentage of myosin IIa staining in uropods in WT (red) or Flot2 KO (blue) Lin- cells per image as in (E) (P =.0008 [WT]; n.s. [Flot2 KO]; ANOVA; Tukey test; n = 10-15).
Testing the homing capacity of normal HSCs in a short-term homing assay, we revealed that the homing capacity of WT vs Flot2 KO LKS cells transduced with a GFP-expressing (but otherwise empty) vector to the BM or spleen did not differ (supplemental Figure 1K-N). Cell cycle analysis revealed a lower percentage of LKS cells from Flot2 KO BM to be in the G1 phase compared with WT mice (P = .0144) (Figure 1D). Finally, hypothesizing that the described alteration of uropod formation in Flot1 KO neutrophils11 may also be found in Flot2 KO cells, we found impaired uropod formation in Flot2 KO compared with WT Lin− cells after treatment with C-X-C Motif Chemokine Ligand 12 (CXCL12) (Figure 1E-F). Lipid raft integrity of Flot2 KO myeloid cells, as tested by membrane fractionation in Gr1+ CD11b+ cells, probing with an antibody to caveolin, an integral membrane and lipid raft-associated protein,26 did not result in obvious differences in caveolin localization in FLOT2-deficient compared with WT myeloid cells (supplemental Figure 1O). In summary, these data show that the percentage of B, as well as LKS cells, was increased in the PB of Flot2 KO mice at baseline. Treatment with G-CSF significantly increased LKS cell mobilization to PB in Flot2 KO mice.
Deficiency of FLOT2 in LICs prolongs survival in CML
To investigate the role of FLOT2 during CML pathogenesis, we transplanted Flot2 KO murine donor BM, transduced with a retrovirus expressing the oncoprotein BCR-ABL1, into WT recipient mice using the retroviral transduction/transplantation model of CML-like myeloproliferative neoplasia (MPN).3,23 This led to a significant reduction of the leukocyte count in PB (P = .0193) (Figure 2A), as well as to a significant prolongation of survival of mice transplanted with BCR–ABL1-transduced FLOT2-deficient (P < .0001) (Figure 2B) compared with WT BM. Further, the homing ability of FLOT2-deficient LIC, which are found in the BCR-ABL1+ (GFP+) Lin− c-Kit+ Sca1+ fraction,27 to BM, but not the spleen of WT recipient mice, was significantly reduced (P = .0275; P = .0462) (Figure 2C-D; supplemental Figure 2A-B). In order to test long-term engraftment of FLOT2-deficient LIC and disease clonality,3,23 we performed long-distance reverse polymerase chain reaction.28 This revealed a significant reduction of the number of proviral integration sites representing engraftment and disease clonality in the spleens of mice transplanted with FLOT2-deficient compared with WT LIC (P = .0007) (Figure 2E; supplemental Figure 2C). To validate that the prolonged survival of recipients of FLOT2-deficient CML LIC is a result of impaired homing, we transplanted WT vs FLOT2-deficient CML LIC both via IV and intrafemoral injection routes. While we, reproducibly, observed a significant survival prolongation in recipients of FLOT2-deficient CML LIC when cells were injected IV (P = .0035) (Figure 2F), this survival prolongation was “rescued” or reversed if the FLOT2-deficient CML LIC were transplanted intrafemorally. In contrast, overall survival in BCR-ABL1+ B-ALL was unaffected using Flot2 KO LIC compared with WT LIC (supplemental Figure 2D). Taken together, these results suggest that the development of FLOT2-deficient CML-like MPN is impaired, likely due to reduced homing and engraftment of LIC in the BM.
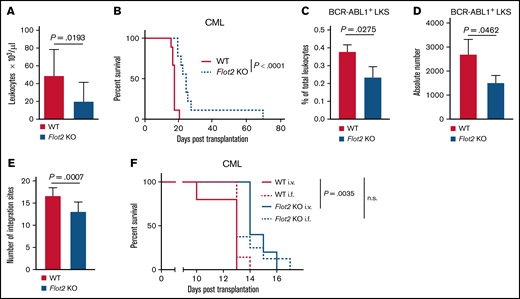
Deficiency of FLOT2 in LICs prolongs survival in CML. (A-B) Leukocyte counts × 103/μL in PB (P = .0193; t test; n = 11-13) 14 days after transplantation (A) and Kaplan-Meier-style survival curve (B) of C57BL/6 recipient mice transplanted with BM from C57BL/6 (WT; solid line, red) or Flot2 KO (dotted line, blue) mice, transduced with BCR–ABL1-expressing retrovirus (P < .0001; log-rank test; n = 9). (C-D) Percentage of total leukocytes (P = .0275; t test; n = 3) (C) and absolute number per femur of GFP+ (BCR-ABL1+) WT (red) or Flot2 KO (blue) LKS cells (P = .0462; t test; n = 3) (D), which homed to the BM of WT mice 18 hours after transplantation. (E) Quantification of proviral integration sites, as tested by long-distance inverse (LDI) PCR on DNA derived from spleens of WT mice which had been transplanted with WT (red) or Flot2 KO (blue) BCR–ABL1-transduced BM in the CML model (P = .0007; t test; n = 12). (F) Kaplan–Meier-style survival curve of WT recipient mice transplanted with BM from WT (red) or Flot2 KO (blue) mice, transduced with BCR–ABL1-expressing retrovirus. An equal number of cells (2.5 × 10⁵) was injected either IV (i.v.) or intrafemorally (i.f.) (P = .0035; log-rank test; n = 5-8).
Deficiency of FLOT2 in LICs prolongs survival in CML. (A-B) Leukocyte counts × 103/μL in PB (P = .0193; t test; n = 11-13) 14 days after transplantation (A) and Kaplan-Meier-style survival curve (B) of C57BL/6 recipient mice transplanted with BM from C57BL/6 (WT; solid line, red) or Flot2 KO (dotted line, blue) mice, transduced with BCR–ABL1-expressing retrovirus (P < .0001; log-rank test; n = 9). (C-D) Percentage of total leukocytes (P = .0275; t test; n = 3) (C) and absolute number per femur of GFP+ (BCR-ABL1+) WT (red) or Flot2 KO (blue) LKS cells (P = .0462; t test; n = 3) (D), which homed to the BM of WT mice 18 hours after transplantation. (E) Quantification of proviral integration sites, as tested by long-distance inverse (LDI) PCR on DNA derived from spleens of WT mice which had been transplanted with WT (red) or Flot2 KO (blue) BCR–ABL1-transduced BM in the CML model (P = .0007; t test; n = 12). (F) Kaplan–Meier-style survival curve of WT recipient mice transplanted with BM from WT (red) or Flot2 KO (blue) mice, transduced with BCR–ABL1-expressing retrovirus. An equal number of cells (2.5 × 10⁵) was injected either IV (i.v.) or intrafemorally (i.f.) (P = .0035; log-rank test; n = 5-8).
Deficiency of FLOT2 in LIC does not alter the disease course in MLL–AF9-driven AML
To test if FLOT2 deficiency may also alter AML progression, we transduced WT or FLOT2-deficient donor BM with retrovirus expressing the oncoprotein MLL-AF923,29 and transplanted this BM into WT recipient mice. Unlike CML, no differences were observed in the leukocyte count (Figure 3A) or overall survival (Figure 3B) of recipient mice transplanted with WT vs FLOT2 KO AML-initiating cells. Furthermore, no differences were observed in the short-term homing ability of WT vs FLOT2-deficient GFP+ (MLL-AF9+) Lin− c-Kit+ Sca1+ LIC to BM (Figure 3C-D) or spleen (supplemental Figure 3A-B). Similarly, the number of proviral integration sites in spleens of recipients of WT vs FLOT2-deficient LIC did not differ (Figure 3E; supplemental Figure 3C). Transcriptional expression of Flot2, however, was highest in Lin− AML compared with Lin− CML and BP1+ (pre-B cell) B-ALL LIC (supplemental Figure 3D). These results indicate that FLOT2 is not essential for the induction of MLL–AF9-driven AML and that it may play differential roles in CML vs AML.
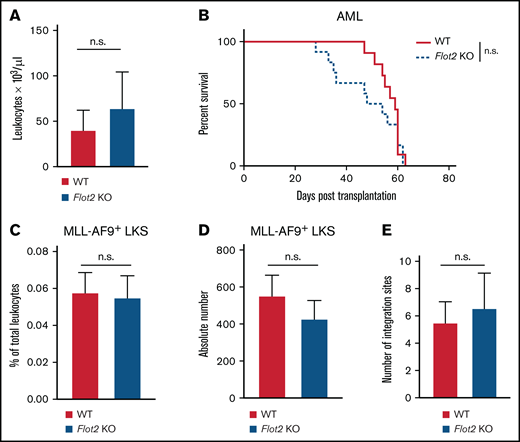
Deficiency of FLOT2 in LIC does not alter disease course in MLL–AF9-driven AML. (A) Leukocyte counts × 103/μL, (n.s.; t test; n = 11) in PB of WT mice transplanted with MLL-AF9+ BM from WT (red) or Flot2 KO (blue) mice 34 days after transplantation. (B) Kaplan-Meier-style survival curve of WT recipient mice transplanted with BM from WT (solid line, red) or Flot2 KO (dashed line, blue) mice, transduced with MLL–AF9-expressing retrovirus (n.s.; log-rank test; n = 11-12). (C-D) Percentage of total leukocytes (n. s.; t test; n = 5) (C) and absolute number per femur of GFP+ (MLL-AF9+) WT (black) or Flot2 KO (blue) LKS cells (n.s.; t test; n = 5) (D), which homed to the BM of WT mice 18 hours after transplantation. (E) Quantification of proviral integration sites by LDI PCR on DNA derived from spleens of WT mice which had been transplanted with WT (red) or Flot2 KO (blue) MLL-AF9-transduced BM in the AML model (n.s.; t test; n = 9-10).
Deficiency of FLOT2 in LIC does not alter disease course in MLL–AF9-driven AML. (A) Leukocyte counts × 103/μL, (n.s.; t test; n = 11) in PB of WT mice transplanted with MLL-AF9+ BM from WT (red) or Flot2 KO (blue) mice 34 days after transplantation. (B) Kaplan-Meier-style survival curve of WT recipient mice transplanted with BM from WT (solid line, red) or Flot2 KO (dashed line, blue) mice, transduced with MLL–AF9-expressing retrovirus (n.s.; log-rank test; n = 11-12). (C-D) Percentage of total leukocytes (n. s.; t test; n = 5) (C) and absolute number per femur of GFP+ (MLL-AF9+) WT (black) or Flot2 KO (blue) LKS cells (n.s.; t test; n = 5) (D), which homed to the BM of WT mice 18 hours after transplantation. (E) Quantification of proviral integration sites by LDI PCR on DNA derived from spleens of WT mice which had been transplanted with WT (red) or Flot2 KO (blue) MLL-AF9-transduced BM in the AML model (n.s.; t test; n = 9-10).
FLOT2 deficiency impairs the cytoskeleton in BCR-ABL1+, but not MLL-AF9+ cells
We hypothesized that FLOT2 deficiency might distinctly impact the cellular and molecular phenotype of LIC, but no significant differences were observed with regards to apoptosis (Figure 4A-B) or the cell cycle (Figure 4C-D) of WT vs FLOT2-deficient GFP+ (BCR-ABL1+) Lin− or GFP+ (MLL-AF9+) Lin− cells. Uropod formation11 was decreased in FLOT2-deficient compared with WT BCR-ABL1+ Lin− cells (P = .0156) (Figure 4E-F), but not in MLL-AF9+ Lin− cells (Figure 4G-H). Exposure to the chemokine CXCL12 increased cell polarity in WT BCR-ABL1+ (P = .0001) (Figure 4E-F) and as a trend in MLL-AF9+ Lin− cells (P = .06) (Figure 4G-H), but not in FLOT2-deficient Lin− cells in either leukemic model. We also used BA/F3 cells transduced with BCR-ABL1 or MLL-AF9, a frequently used model system for leukemia cells,5,30 to characterize the effect of FLOT2 deficiency on CML vs AML cell physiology. Using short hairpin (sh) RNA-mediated knockdown (P < .0001 [BCR-ABL1]; P = .0242 [MLL-AF9]) (supplemental Figure 4A-B; supplemental Table 2), we observed a significant reduction in adhesion to E-selectin (P = .0017 [BCR-ABL1]; P = .0012 [MLL-AF9]) (supplemental Figure 4C-D) and in migration toward MS-5 stromal cells (P = .0002 [BCR-ABL1]; P = .0002 [MLL-AF9]) (supplemental Figure 4E-F) by BCR-ABL1+ and MLL-AF9+ BA/F3 cells, transduced with sh Flot2- compared with sh Scrambled-expressing lentivirus. Cofilin, an actin-binding protein involved in regulating filament dynamics and depolymerization, was more highly expressed in sh Flot2+ compared with sh Scrambled+ BCR-ABL1+ 3T3 cells, but had lower expression in sh Flot2+ compared with sh Scrambled+ MLL-AF9+ 3T3 cells (P = .003 [BCR-ABL1]) (supplemental Figure 4G-H). Immunofluorescence staining of 3T3 fibroblasts, stably cotransduced with BCR–ABL1- or MLL–AF9-expressing retrovirus (as a model to study the cytoskeleton)30 and sh Flot2- vs sh Scrambled-expressing lentivirus, revealed an impaired cytoskeleton, as measured by an increase of phalloidin+ aggregates, in sh Flot2+ BCR-ABL1+ compared with sh Scrambled+ BCR-ABL1+ cells (P < .0001 [BCR-ABL1]; n.s. [MLL-AF9]) (Figure 4I-J). Collectively, our data suggest that FLOT2 deficiency leads to an alteration of adhesion and migration, irrespective of the oncogene, but impairment of uropod formation and possible disarrangement of the cytoskeleton was more pronounced in FLOT2-deficient BCR-ABL1+ compared with FLOT2-deficient MLL-AF9+ cells and the respective controls.
![Deficiency of FLOT2 impairs the cytoskeleton in BCR-ABL1+, but not MLL-AF9+ cells. (A-B) Percentage of oncogene-positive (GFP+) lineage-negative (Lin−) apoptotic cells of all GFP+ Lin− cells from the BM of WT mice transplanted with WT or Flot2 KO BCR-ABL1- (n.s.; t test; n = 7-8) (A) or MLL–AF9-positive BM (n.s.; t test; n = 7) (B), detected by annexin V staining. (C-D) Cell cycle analysis of oncogene-positive (GFP+) lineage (Lin) negative cells of all GFP+ Lin− cells from the BM of WT mice transplanted with WT or Flot2 KO BCR–ABL1- (n.s.; ANOVA; Tukey test; n = 8) (C) or MLL–AF9-positive BM (n.s.; ANOVA; Tukey test; n = 13) (D). (E) Immunofluorescence staining showing the localization of myosin IIa in uropods of WT or Flot2 KO BCR-ABL1+ Lin- cells treated with vehicle or CXCL12 (1 ng/μL) for 4 hours. The images are representative of 3 independent experiments. The scale bar represents 25 µm. (F) Quantification of the percentage of myosin IIa staining in uropods in WT (red) or Flot2 KO (blue) Lin- cells per image as in (E) (P = .0001 [WT]; n.s. [Flot2 KO]; P = .0156 [WT vs Flot2 KO]; ANOVA; Tukey test; n = 7-12). (G) Immunofluorescence staining showing the localization of myosin IIa in uropods of WT or Flot2 KO MLL-AF9+ Lin- cells treated with vehicle or CXCL12 (1 ng/μL) for 4 hours. The images are representative of 3 independent experiments. The scale bar represents 25 µm. (H) Quantification of the percentage of myosin IIa staining in uropods in WT (red) or Flot2 KO (blue) Lin- cells per image as in (G) (P = .0611 [WT]; n.s. [Flot2 KO]; ANOVA; Tukey test; n = 8-12). (I) Immunofluorescence studies on 3T3 fibroblasts transduced with BCR–ABL1- or MLL–AF9-expressing retrovirus and either Scrambled- or Flot2 shRNA-expressing lentivirus, grown on coverslips and stained with phalloidin. The white arrows point to examples of the impaired cytoskeleton. Note that the cytoskeleton is known to be impaired in BCR-ABL1+ cells.30 The images are representative of 3 independent experiments. The scale bar represents 25 µm. (J) Quantification of the immunofluorescence staining in (I). The average number of phalloidin+ aggregates representing an impaired cytoskeleton per cell was quantified (P < .0001 [BCR-ABL1]; ANOVA; Tukey test; n = 12-15).](https://ash.silverchair-cdn.com/ash/content_public/journal/bloodadvances/6/12/10.1182_bloodadvances.2021005992/6/m_advancesadv2021005992f4.png?Expires=1769901359&Signature=l9-Kefai~1xbI~bxaQpPSgGFvl2mEUH-XiuU3n1D-NdrgRYLFieL0ipoDNraD~Y9YTHUTpSud20ZO7DcHNns4CtTW0S9O0SO-MYguRCiTHlXsu6Ny01CPLwPaiY1k-ksq4Jj2JraQBOb8ZA88L5Wp3jyO-oikIsHl7ibCqClReWTsQ3GgHiAc0ijp8EA0Uqf33ZHyeoqwCp7ChMmlrpFV6oYW9yu5e-kflpuPuUXu-zQGuzvoUCoFrc4WlBjNPrU02U4FCMyJdexM1EDhnUOFcMwZ-g-5cD5TSfrCgEmVI7gdJWPnlEca1TEjRv708sj23FDdDlfBG5MExubzRE5-w__&Key-Pair-Id=APKAIE5G5CRDK6RD3PGA)
Deficiency of FLOT2 impairs the cytoskeleton in BCR-ABL1+, but not MLL-AF9+ cells. (A-B) Percentage of oncogene-positive (GFP+) lineage-negative (Lin−) apoptotic cells of all GFP+ Lin− cells from the BM of WT mice transplanted with WT or Flot2 KO BCR-ABL1- (n.s.; t test; n = 7-8) (A) or MLL–AF9-positive BM (n.s.; t test; n = 7) (B), detected by annexin V staining. (C-D) Cell cycle analysis of oncogene-positive (GFP+) lineage (Lin) negative cells of all GFP+ Lin− cells from the BM of WT mice transplanted with WT or Flot2 KO BCR–ABL1- (n.s.; ANOVA; Tukey test; n = 8) (C) or MLL–AF9-positive BM (n.s.; ANOVA; Tukey test; n = 13) (D). (E) Immunofluorescence staining showing the localization of myosin IIa in uropods of WT or Flot2 KO BCR-ABL1+ Lin- cells treated with vehicle or CXCL12 (1 ng/μL) for 4 hours. The images are representative of 3 independent experiments. The scale bar represents 25 µm. (F) Quantification of the percentage of myosin IIa staining in uropods in WT (red) or Flot2 KO (blue) Lin- cells per image as in (E) (P = .0001 [WT]; n.s. [Flot2 KO]; P = .0156 [WT vs Flot2 KO]; ANOVA; Tukey test; n = 7-12). (G) Immunofluorescence staining showing the localization of myosin IIa in uropods of WT or Flot2 KO MLL-AF9+ Lin- cells treated with vehicle or CXCL12 (1 ng/μL) for 4 hours. The images are representative of 3 independent experiments. The scale bar represents 25 µm. (H) Quantification of the percentage of myosin IIa staining in uropods in WT (red) or Flot2 KO (blue) Lin- cells per image as in (G) (P = .0611 [WT]; n.s. [Flot2 KO]; ANOVA; Tukey test; n = 8-12). (I) Immunofluorescence studies on 3T3 fibroblasts transduced with BCR–ABL1- or MLL–AF9-expressing retrovirus and either Scrambled- or Flot2 shRNA-expressing lentivirus, grown on coverslips and stained with phalloidin. The white arrows point to examples of the impaired cytoskeleton. Note that the cytoskeleton is known to be impaired in BCR-ABL1+ cells.30 The images are representative of 3 independent experiments. The scale bar represents 25 µm. (J) Quantification of the immunofluorescence staining in (I). The average number of phalloidin+ aggregates representing an impaired cytoskeleton per cell was quantified (P < .0001 [BCR-ABL1]; ANOVA; Tukey test; n = 12-15).
Deficiency of FLOT2 impairs the cytoskeleton in BCR-ABL1+, but not MLL-AF9+ cells. (A-B) Percentage of oncogene-positive (GFP+) lineage-negative (Lin−) apoptotic cells of all GFP+ Lin− cells from the BM of WT mice transplanted with WT or Flot2 KO BCR-ABL1- (n.s.; t test; n = 7-8) (A) or MLL–AF9-positive BM (n.s.; t test; n = 7) (B), detected by annexin V staining. (C-D) Cell cycle analysis of oncogene-positive (GFP+) lineage (Lin) negative cells of all GFP+ Lin− cells from the BM of WT mice transplanted with WT or Flot2 KO BCR–ABL1- (n.s.; ANOVA; Tukey test; n = 8) (C) or MLL–AF9-positive BM (n.s.; ANOVA; Tukey test; n = 13) (D). (E) Immunofluorescence staining showing the localization of myosin IIa in uropods of WT or Flot2 KO BCR-ABL1+ Lin- cells treated with vehicle or CXCL12 (1 ng/μL) for 4 hours. The images are representative of 3 independent experiments. The scale bar represents 25 µm. (F) Quantification of the percentage of myosin IIa staining in uropods in WT (red) or Flot2 KO (blue) Lin- cells per image as in (E) (P = .0001 [WT]; n.s. [Flot2 KO]; P = .0156 [WT vs Flot2 KO]; ANOVA; Tukey test; n = 7-12). (G) Immunofluorescence staining showing the localization of myosin IIa in uropods of WT or Flot2 KO MLL-AF9+ Lin- cells treated with vehicle or CXCL12 (1 ng/μL) for 4 hours. The images are representative of 3 independent experiments. The scale bar represents 25 µm. (H) Quantification of the percentage of myosin IIa staining in uropods in WT (red) or Flot2 KO (blue) Lin- cells per image as in (G) (P = .0611 [WT]; n.s. [Flot2 KO]; ANOVA; Tukey test; n = 8-12). (I) Immunofluorescence studies on 3T3 fibroblasts transduced with BCR–ABL1- or MLL–AF9-expressing retrovirus and either Scrambled- or Flot2 shRNA-expressing lentivirus, grown on coverslips and stained with phalloidin. The white arrows point to examples of the impaired cytoskeleton. Note that the cytoskeleton is known to be impaired in BCR-ABL1+ cells.30 The images are representative of 3 independent experiments. The scale bar represents 25 µm. (J) Quantification of the immunofluorescence staining in (I). The average number of phalloidin+ aggregates representing an impaired cytoskeleton per cell was quantified (P < .0001 [BCR-ABL1]; ANOVA; Tukey test; n = 12-15).
FLOT2 influences the expression of CD44 in CML and AML cells
Given the pivotal role of the membrane molecule CD44 for the homing of leukemia cells3,4 and its localization in lipid rafts,31 where flotillins support adhesion molecules,32,33 we hypothesized that FLOT2 might interact with CD44 and influence leukemia progression. Indeed, primary FLOT2-deficient leukemia cells from mice with CML and AML showed a reduced percentage of CD44+ myeloid cells (P < .0001 [CML]; P = .031 [AML]) (Figure 5A-B), as well as reduced expression of CD44 on Lin− cells (P = .0049 [CML]; P = .0465 [AML]) (Figure 5C-D). Transcriptional expression of CD44 in CML, AML, or B-ALL LIC did not differ significantly (supplemental Figure 5A). Immunofluorescence studies confirmed the colocalization of CD44 and FLOT2 on WT, but not FLOT2 KO Lin− cells from mice with CML and AML (Figure 5E-G). Other adhesion molecules were not affected by FLOT2 deficiency (supplemental Figure 5B-M).
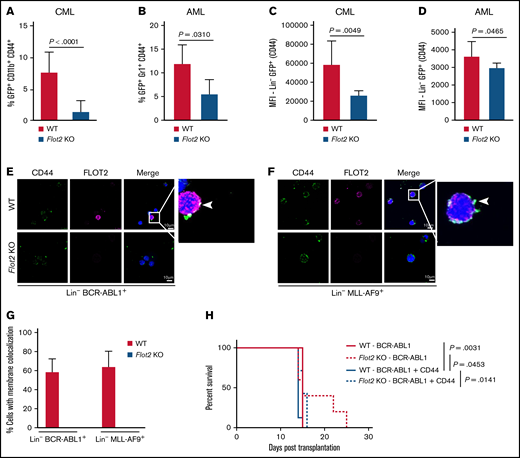
FLOT2 influences the expression of CD44 in CML and AML cells. (A) Percentage of GFP+ (BCR-ABL1+) CD11b+ CD44+ cells of all GFP+ CD11b+ cells in the PB of mice transplanted with WT (red) or Flot2 KO (blue) BM, transduced with BCR–ABL1-expressing retrovirus (P < .0001; t test; n = 4). (B) Percentage of GFP+ (MLL-AF9+) Gr1+ CD44+ cells of all GFP+ Gr1+ cells in the PB of mice transplanted with WT (red) or Flot2 KO (blue) BM, transduced with MLL–AF9-expressing retrovirus (P = .031; t test; n = 4-5). (C-D) Mean fluorescence intensity of CD44 on oncogene positive (GFP+) lineage negative cells from mice transplanted with WT (red) or Flot2 KO (blue) BM, transduced with BCR–ABL1- (P = .0049; t test; n = 3-4) (C) or MLL–AF9-expressing retrovirus (P = .0465; t test; n = 4-5) (D). (E-F) Immunofluorescence staining for CD44 and FLOT2 on lineage negative BCR-ABL1+ (E) or MLL-AF9+ (F) cells from the BM of WT mice with CML (E) or AML (F) showing the colocalization of both proteins. The nuclei are counterstained with DAPI. The scale bar represents 10 µm. (G) Quantification of the immunofluorescence staining in (E-F). The percentage of white CD44 and FLOT2 colocalization signals per cell was quantified in WT (red) vs Flot2 KO (blue) BCR-ABL1+ vs MLL-AF9+ Lin− cells. (H) Kaplan–Meier-style survival curve of WT recipient mice transplanted with WT (solid line) or Flot2 KO (dotted line) BM, transduced with BCR–ABL1- (red line) or BCR–ABL1–CD44-overexpressing retrovirus (blue line) (Log-rank test; n = 5-7).
FLOT2 influences the expression of CD44 in CML and AML cells. (A) Percentage of GFP+ (BCR-ABL1+) CD11b+ CD44+ cells of all GFP+ CD11b+ cells in the PB of mice transplanted with WT (red) or Flot2 KO (blue) BM, transduced with BCR–ABL1-expressing retrovirus (P < .0001; t test; n = 4). (B) Percentage of GFP+ (MLL-AF9+) Gr1+ CD44+ cells of all GFP+ Gr1+ cells in the PB of mice transplanted with WT (red) or Flot2 KO (blue) BM, transduced with MLL–AF9-expressing retrovirus (P = .031; t test; n = 4-5). (C-D) Mean fluorescence intensity of CD44 on oncogene positive (GFP+) lineage negative cells from mice transplanted with WT (red) or Flot2 KO (blue) BM, transduced with BCR–ABL1- (P = .0049; t test; n = 3-4) (C) or MLL–AF9-expressing retrovirus (P = .0465; t test; n = 4-5) (D). (E-F) Immunofluorescence staining for CD44 and FLOT2 on lineage negative BCR-ABL1+ (E) or MLL-AF9+ (F) cells from the BM of WT mice with CML (E) or AML (F) showing the colocalization of both proteins. The nuclei are counterstained with DAPI. The scale bar represents 10 µm. (G) Quantification of the immunofluorescence staining in (E-F). The percentage of white CD44 and FLOT2 colocalization signals per cell was quantified in WT (red) vs Flot2 KO (blue) BCR-ABL1+ vs MLL-AF9+ Lin− cells. (H) Kaplan–Meier-style survival curve of WT recipient mice transplanted with WT (solid line) or Flot2 KO (dotted line) BM, transduced with BCR–ABL1- (red line) or BCR–ABL1–CD44-overexpressing retrovirus (blue line) (Log-rank test; n = 5-7).
As we had observed a homing defect of FLOT2-deficient CML LIC (Figure 2C-D) and CD44 blockade had prolonged survival in murine CML,3 we hypothesized that the reduced CD44 expression might be contributory to the reduced homing ability of FLOT2-deficient CML LIC.3 Therefore, we transduced WT vs FLOT2-deficient BM with BCR–ABL1- and CD44-expressing retrovirus. This led to a similar survival of murine recipients of WT vs FLOT2-deficient CML LIC overexpressing CD44 and WT cells without overexpression of CD44, but these differences were not significant, and the rescue was only partial (Figure 5H). These findings suggest that FLOT2 may affect the surface expression of CD44 on leukemia cells and, thereby, influence the homing ability of CML LIC.
Knockdown of FLOT2 in human leukemia cell lines impacts leukemia cell physiology and function
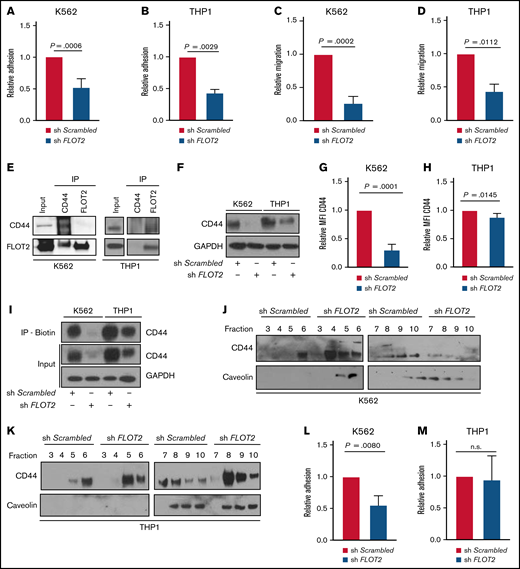
Testing the relevance of our findings for the human setting, we analyzed a publicly available dataset, the Bloodspot Portal.34 We found lower expression of FLOT2 in total BM cells of MLL-rearranged cases of human AML compared with CML, but no differences between CML or AML to healthy BM (supplemental Figure 6A). In CD34+ normal human, CML and AML cells in our study, we found similar expression of FLOT2, but highest CD44 expression in CD34+ normal human and AML cells (supplemental Figure 6B; supplemental Table 3). In addition, downstream of CD44, RAC1 expression was highest in CD34+ normal human and AML cells but did not differ for other genes (supplemental Figure 6C). Knockdown of FLOT2 in the human leukemia cell lines K562 and THP1 cells, which harbor the BCR-ABL1 and the MLL-AF9 oncogenes, respectively (supplemental Figure 6D-E), reduced relative adhesion of sh FLOT2+ K562 and THP1 cells to E-selectin, a binding partner of CD44,5,35 compared with control cells (P = .0006 [K562]; P = .0029 [THP1]) (Figure 6A-B). Transwell migration of sh FLOT2+ K562 and THP1 cells toward HS-5 stromal cells was significantly reduced compared with sh Scrambled+ cells (P = .0002 [K562], P = .0112 [THP1]) (Figure 6C-D). Coimmunoprecipitation using lysates from K562 and THP1 cells revealed physical interactions between FLOT2 and CD44 in both cell lines (Figure 6E), with differences between anti-CD44 vs anti-FLOT2 antibodies. Immunoblotting (Figure 6F; supplemental Figure 6F) and flow cytometry (P = .0001 [K562], P = .0145 [THP1]) (Figure 6G-H) confirmed reduced CD44 expression in sh FLOT2+ K562 and THP1 cells.
Knockdown of FLOT2 in human leukemia cell lines impacts leukemia cell physiology and function. (A-B) Relative adhesion of K562 (P = .0006; t test; n = 4) (A) or THP1 cells (P = .0029; t test; n = 4) (B), transduced with Scrambled shRNA (red)- or FLOT2 shRNA (blue)-expressing lentivirus to E–selectin-coated plates; 7 × 10⁴ cells had been plated and allowed to adhere for 6 hours. (C-D) Transwell migration of K562 (P = .0002; t test; n = 3) (C) or THP1 (P = .0112.; t test; n = 3) (D) cells transduced with Scrambled shRNA (red)- or FLOT2 shRNA (blue)-expressing lentivirus toward HS-5 stromal cells. Leukemia cells (1.5 × 10⁵) had been plated and allowed to migrate for 16 hours through an 8 µm pore size transwell. (E) Coimmunoprecipitation of lysates of K562 (left) vs THP1 (right) cells with anti-CD44 and anti-FLOT2 antibodies. The subsequent Western blot was performed with an antibody to CD44 (82 kDa) and FLOT2 (49 kDa). The blots are representative of 3 independent replicates. (F) Immunoblot showing the expression of CD44 (82 kDa) and GAPDH (37 kDa) as loading control in lysates of K562 and THP1 cells transduced with Scrambled shRNA- or FLOT2 shRNA-expressing lentivirus. The blot is representative of 5 independent experiments. (G-H) Relative mean fluorescence intensity of CD44 on K562 (P = .0001; t test; n = 5) (G) and THP1 (P = .0145; t test; n = 5) (H) cells, transduced with Scrambled shRNA- or FLOT2 shRNA-expressing lentivirus. (I) Immunoblot of cell lysates from a cell surface biotinylation assay on K562 or THP1 cells, transduced with Scrambled shRNA- or FLOT2 shRNA-expressing lentivirus. Total protein samples (input) and samples containing biotinylated cell surface proteins and immunoprecipitated with streptavidin-binding beads (IP-Biotin) were probed with an antibody to CD44 (82 kDa) and GAPDH (37 kDa). The images are representative of 2 independent experiments. (J-K) Membrane fractions of K562 (J) and THP1 (K) cells transduced with Scrambled shRNA- or FLOT2 shRNA-expressing lentivirus. The lipid raft protein caveolin (46 kDa) and CD44 (82 kDa) were detected by immunoblotting. The numbers represent the different membrane fractions obtained via a sucrose gradient. (L-M) Relative adhesion of K562 (P = .008; t test; n = 3) (L) or THP1 cells (n.s.; t test; n = 3) (M), transduced with Scrambled shRNA (red)- or FLOT2 shRNA (blue)-expressing lentivirus, to HS-5 stromal cells; 7 × 10⁴ cells had been plated and allowed to adhere for 6 hours.
Knockdown of FLOT2 in human leukemia cell lines impacts leukemia cell physiology and function. (A-B) Relative adhesion of K562 (P = .0006; t test; n = 4) (A) or THP1 cells (P = .0029; t test; n = 4) (B), transduced with Scrambled shRNA (red)- or FLOT2 shRNA (blue)-expressing lentivirus to E–selectin-coated plates; 7 × 10⁴ cells had been plated and allowed to adhere for 6 hours. (C-D) Transwell migration of K562 (P = .0002; t test; n = 3) (C) or THP1 (P = .0112.; t test; n = 3) (D) cells transduced with Scrambled shRNA (red)- or FLOT2 shRNA (blue)-expressing lentivirus toward HS-5 stromal cells. Leukemia cells (1.5 × 10⁵) had been plated and allowed to migrate for 16 hours through an 8 µm pore size transwell. (E) Coimmunoprecipitation of lysates of K562 (left) vs THP1 (right) cells with anti-CD44 and anti-FLOT2 antibodies. The subsequent Western blot was performed with an antibody to CD44 (82 kDa) and FLOT2 (49 kDa). The blots are representative of 3 independent replicates. (F) Immunoblot showing the expression of CD44 (82 kDa) and GAPDH (37 kDa) as loading control in lysates of K562 and THP1 cells transduced with Scrambled shRNA- or FLOT2 shRNA-expressing lentivirus. The blot is representative of 5 independent experiments. (G-H) Relative mean fluorescence intensity of CD44 on K562 (P = .0001; t test; n = 5) (G) and THP1 (P = .0145; t test; n = 5) (H) cells, transduced with Scrambled shRNA- or FLOT2 shRNA-expressing lentivirus. (I) Immunoblot of cell lysates from a cell surface biotinylation assay on K562 or THP1 cells, transduced with Scrambled shRNA- or FLOT2 shRNA-expressing lentivirus. Total protein samples (input) and samples containing biotinylated cell surface proteins and immunoprecipitated with streptavidin-binding beads (IP-Biotin) were probed with an antibody to CD44 (82 kDa) and GAPDH (37 kDa). The images are representative of 2 independent experiments. (J-K) Membrane fractions of K562 (J) and THP1 (K) cells transduced with Scrambled shRNA- or FLOT2 shRNA-expressing lentivirus. The lipid raft protein caveolin (46 kDa) and CD44 (82 kDa) were detected by immunoblotting. The numbers represent the different membrane fractions obtained via a sucrose gradient. (L-M) Relative adhesion of K562 (P = .008; t test; n = 3) (L) or THP1 cells (n.s.; t test; n = 3) (M), transduced with Scrambled shRNA (red)- or FLOT2 shRNA (blue)-expressing lentivirus, to HS-5 stromal cells; 7 × 10⁴ cells had been plated and allowed to adhere for 6 hours.
To confirm the loss of surface expression of CD44 on sh FLOT2+ cells, we performed a surface biotinylation assay, in which cellular surface proteins are biotinylated and, subsequently, precipitated. This revealed reduced membrane levels of CD44 on K562 cells, transduced with sh FLOT2- compared with sh Scrambled-expressing lentivirus, but this effect was less evident for sh FLOT2+ THP1 cells (Figure 6I; supplemental Figure 6G). Consistently, membrane fractions in K562 and THP1 cells showed differences in the distribution of CD44 and caveolin between sh Scrambled+ and sh FLOT2+ K562, but not THP1 cells (Figure 6J-K). In contrast to adhesion to E-selectin (Figure 6A-B), relative adhesion of sh FLOT2+ K562, but not sh FLOT2+ THP1 cells to the stromal cell line HS-5, which expresses the CD44 ligands E-selectin,5 osteopontin,35 and hyaluronan synthase (hyaluronan is another CD44 ligand35 ) at only low levels (supplemental Figure 6H), was significantly reduced compared with sh Scrambled+ control cells (P = .008 [K562]) (Figure 6L-M). Lastly, the cytoskeleton in sh FLOT2+ K562 and, to a lesser extent, in sh FLOT2+ THP1 cells, was significantly less polarized in response to CXCL12 than in the respective controls (supplemental Figure 7). These findings suggest that while FLOT2 deficiency may lead to a similar reduction in CD44 expression in BCR-ABL1+ vs MLL-AF9+ cells, lipid raft integrity, membrane localization of CD44, and/or signaling molecules downstream of CD44 may differ between these 2 cell types.
CDC42 is differentially expressed, regulated, and localized in FLOT2-deficient CML cells
CDC42, a member of the Rho GTPase family of small G proteins, becomes activated by raft-associated structures36 and engagement of CD44,37 leading to regulation of signaling pathways involved in cellular functions such as cell morphology, cell cycle progression, cytoskeletal function, and migration in health and disease,37,38 including myeloid leukemia.39 Transcriptional CDC42 expression was similar in human CD34+ AML, CML, and control cells (supplemental Figure 8A). CDC42 staining, even after CXCL12 exposure, was less polarized in CML CD34+ cells than AML and normal controls (supplemental Figure 8B-D).
In murine LIC transcriptional Cdc42 expression was higher in AML than CML (supplemental Figure 9A). After treatment with CXCL12 polar localization of CDC42 was more pronounced in WT compared with Flot2 KO Lin− cells, whereby this was most obvious in CML LIC (supplemental Figure 9B-D). Hypothesizing that CDC42 may be differentially involved in the signaling of sh FLOT2+ BCR-ABL1+ vs sh FLOT2+ MLL-AF9+ cells, we found CDC42 expression to be increased in sh FLOT2+ compared with sh Scrambled+ K562 cells, while no difference was observed between sh FLOT2+ vs sh Scrambled+ THP1 cells (Figure 7A; supplemental Figure 10A). The higher expression of CDC42 in sh Flot2+ compared with sh Scrambled+ K562 cells was unaffected by the tyrosine kinase inhibitor dasatinib (supplemental Figure 10B), suggesting that increased expression of CDC42 in sh FLOT2+ K562 cells was BCR-ABL1 kinase-independent. Polarization of the actin cytoskeleton in sh Scrambled+ compared with sh FLOT2+ K562 cells was also unaffected by dasatinib (supplemental Figure 10C). CDC42 was localized in the membrane of sh Scrambled+ K562 cells, while its localization was more dispersed in K562 cells lacking FLOT2 (Figure 7B; supplemental Figure 10D), but these differences were not observed in the THP1 counterparts (Figure 7C; supplemental Figure 10E). In a CDC42 activation assay, in which active CDC42 was immunoprecipitated, we found increased levels of active CDC42 in sh FLOT2+ compared with sh Scrambled+ K562 cells. Levels of active CDC42, however, were unchanged in FLOT2+ vs sh Scrambled+ THP1 cells (Figure 7D). P21 (RAC1)-activated kinase 1 (PAK1), a serine/threonine kinase downstream of CDC42, regulates cell morphology and motility.39,40 In line with its phosphorylation by increased CDC42 activity, we observed increased phosphorylation of PAK1 in sh FLOT2+ vs sh Scrambled+ K562 cells, while total PAK1 levels remained unchanged. This difference, however, was not observed in THP1 cells (Figure 7E-F; supplemental Figure 10F).
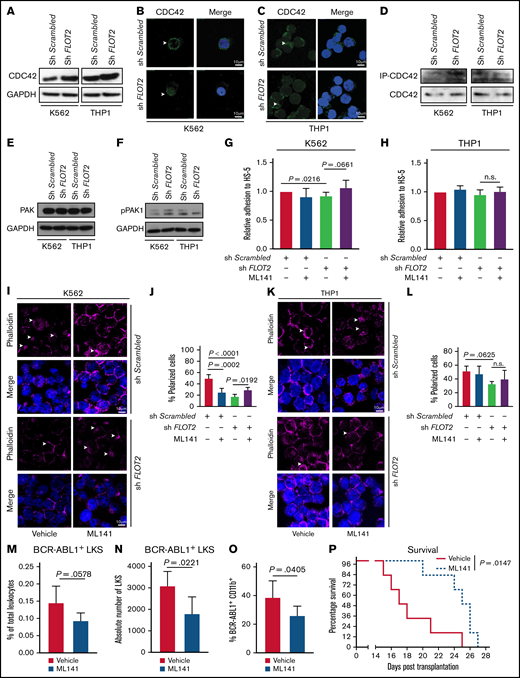
CDC42 is differentially expressed, regulated, and localized in FLOT2-deficient CML cells. (A) Immunoblot of lysates from K562 (left) vs THP1 (right) cells, transduced with either Scrambled shRNA- or FLOT2 shRNA-expressing lentivirus, probed with antibodies to CDC42 (42 kDa) or GAPDH (37 kDa). The images are representative of 4 independent experiments. (B-C) Immunofluorescence staining for CDC42 in K562 (B) or THP1 (C) cells, transduced with either Scrambled shRNA- or FLOT2 shRNA-expressing lentivirus. The images are representative of 3 independent experiments. The scale bar represents 10 µm. (D) Coimmunoprecipitation of lysates of K562 (left) and THP1 (right) with PAK1-protein binding beads (PAK1 PDB) as part of a CDC42 activation assay. PAK1 was used as a downstream effector of CDC42 to isolate the active GTP-bound form of CDC42. The Western blot was performed using an anti-CDC42 antibody (42 kDa). (E-F) Immunoblot of lysates from K562 (left) vs THP1 (right) cells, transduced with either Scrambled shRNA- or FLOT2 shRNA-expressing lentivirus, probed with antibodies to PAK1 (68 kDa) (E), pPAK1 (70 kDa) (F), and GAPDH (37 kDa). The images are representative of 5 independent experiments. (G-H) Relative adhesion of K562 (ANOVA; Tukey test; n = 4) (G) or THP1 (ANOVA; Tukey test; n = 6) (H) cells, transduced with sh Scrambled- or FLOT2 shRNA-expressing lentivirus and treated with vehicle or the CDC42 inhibitor ML141 (5 nM) to HS-5 stromal cells. The cells were allowed to adhere for 6 hours. (I-J) Immunofluorescence staining (I) and quantification (J) of F-actin using phalloidin in K562 cells, transduced with Scrambled shRNA- or FLOT2 shRNA-expressing lentivirus and treated with vehicle or the CDC42 inhibitor ML141 (100 nM for 6 h). (K-L) Immunofluorescence staining (K) and quantification (L) of F-actin using phalloidin in THP1 cells, transduced with Scrambled shRNA- or FLOT2 shRNA-expressing lentivirus and treated with vehicle or the CDC42 inhibitor ML141 (100 nM for 6 h). (M-N) Percentage of total leukocytes (P = .0578; t test; n = 5) (M) and absolute number per femur of GFP+ (BCR-ABL1+) WT LKS cells (P = .0221; t test; n = 5) (N), which had been pretreated ex vivo with vehicle (red) or the CDC42 inhibitor ML141 (5 µM for 4 hours) (blue) and homed to the BM of WT mice 18 hours after transplantation. (O) Percentage of BCR-ABL1+ (GFP+) CD11b+ myeloid cells of total leukocytes in the PB (day 13 after transplantation) of mice transplanted with WT BM transduced with BCR–ABL1-expressing retrovirus and ex vivo pretreated with vehicle (red) or the CDC42 inhibitor ML141 (blue) (5 µM for 4 hours) before transplantation, (P = .0405; t test; n = 5). (P) Kaplan–Meier-style survival curve of WT recipient mice transplanted with WT BM transduced with BCR–ABL1-expressing retrovirus and ex vivo pretreated with vehicle (solid line, red) or the CDC42 inhibitor ML141 (dotted line, blue) (5 µM for 4 hours) before transplantation (P = .0147; log-rank test; n = 6).
CDC42 is differentially expressed, regulated, and localized in FLOT2-deficient CML cells. (A) Immunoblot of lysates from K562 (left) vs THP1 (right) cells, transduced with either Scrambled shRNA- or FLOT2 shRNA-expressing lentivirus, probed with antibodies to CDC42 (42 kDa) or GAPDH (37 kDa). The images are representative of 4 independent experiments. (B-C) Immunofluorescence staining for CDC42 in K562 (B) or THP1 (C) cells, transduced with either Scrambled shRNA- or FLOT2 shRNA-expressing lentivirus. The images are representative of 3 independent experiments. The scale bar represents 10 µm. (D) Coimmunoprecipitation of lysates of K562 (left) and THP1 (right) with PAK1-protein binding beads (PAK1 PDB) as part of a CDC42 activation assay. PAK1 was used as a downstream effector of CDC42 to isolate the active GTP-bound form of CDC42. The Western blot was performed using an anti-CDC42 antibody (42 kDa). (E-F) Immunoblot of lysates from K562 (left) vs THP1 (right) cells, transduced with either Scrambled shRNA- or FLOT2 shRNA-expressing lentivirus, probed with antibodies to PAK1 (68 kDa) (E), pPAK1 (70 kDa) (F), and GAPDH (37 kDa). The images are representative of 5 independent experiments. (G-H) Relative adhesion of K562 (ANOVA; Tukey test; n = 4) (G) or THP1 (ANOVA; Tukey test; n = 6) (H) cells, transduced with sh Scrambled- or FLOT2 shRNA-expressing lentivirus and treated with vehicle or the CDC42 inhibitor ML141 (5 nM) to HS-5 stromal cells. The cells were allowed to adhere for 6 hours. (I-J) Immunofluorescence staining (I) and quantification (J) of F-actin using phalloidin in K562 cells, transduced with Scrambled shRNA- or FLOT2 shRNA-expressing lentivirus and treated with vehicle or the CDC42 inhibitor ML141 (100 nM for 6 h). (K-L) Immunofluorescence staining (K) and quantification (L) of F-actin using phalloidin in THP1 cells, transduced with Scrambled shRNA- or FLOT2 shRNA-expressing lentivirus and treated with vehicle or the CDC42 inhibitor ML141 (100 nM for 6 h). (M-N) Percentage of total leukocytes (P = .0578; t test; n = 5) (M) and absolute number per femur of GFP+ (BCR-ABL1+) WT LKS cells (P = .0221; t test; n = 5) (N), which had been pretreated ex vivo with vehicle (red) or the CDC42 inhibitor ML141 (5 µM for 4 hours) (blue) and homed to the BM of WT mice 18 hours after transplantation. (O) Percentage of BCR-ABL1+ (GFP+) CD11b+ myeloid cells of total leukocytes in the PB (day 13 after transplantation) of mice transplanted with WT BM transduced with BCR–ABL1-expressing retrovirus and ex vivo pretreated with vehicle (red) or the CDC42 inhibitor ML141 (blue) (5 µM for 4 hours) before transplantation, (P = .0405; t test; n = 5). (P) Kaplan–Meier-style survival curve of WT recipient mice transplanted with WT BM transduced with BCR–ABL1-expressing retrovirus and ex vivo pretreated with vehicle (solid line, red) or the CDC42 inhibitor ML141 (dotted line, blue) (5 µM for 4 hours) before transplantation (P = .0147; log-rank test; n = 6).
Hypothesizing that CDC42 activity may differentially affect the function of WT or FLOT2-deficient K562 vs THP1 cells, we treated leukemia cells with an inhibitor of CDC42 activity, ML141. While deficiency of FLOT2 led to a significant reduction of adhesion to HS-5 stromal cells, there was a strong trend toward restoration of adhesion when sh FLOT2+ K562 cells were treated with ML141 (P = .0216) (Figure 7G). However, adhesion of sh Scrambled+ or sh FLOT2+ THP1 cells remained unaffected, regardless of treatment with ML141 (Figure 7H). The cytoskeleton in sh Scrambled+ K562 cells was impaired by knockdown of FLOT2 or treatment with ML141, and treatment of sh FLOT2+ K562 cells with ML141 restored that impairment (Figure 7I-J). In contrast, there was a trend toward cytoskeletal disarrangement in THP1 cells in the absence of FLOT2, but no cytoskeletal changes in sh Scrambled+ THP1 cells after ML141 treatment (Figure 7K-L). CD44 and CDC42 did not physically interact (data not shown). Ex vivo pretreatment of CML LIC with ML141 before transplantation reduced the number (and as a trend, the percentage) of BCR-ABL1+ LKS cells which homed to the BM and spleen of recipients (P = .02) (Figure 7M-N; supplemental Figure 10G-H), led to a reduction of BCR-ABL1+ CD11b+ myeloid cells in PB (P = .04) (Figure 7O), and significantly prolonged survival of recipients (P = .01) (Figure 7P). Taken together, these results suggest that in the absence of FLOT2, CDC42 may differ in expression and function between K562 compared with THP1 cells. In K562, but not in THP1 cells, CDC42 localization and cell polarity in the absence of FLOT2 were altered independently of BCR-ABL1 kinase function. Inhibition of CDC42 in CML LIC impairs homing and leukemia development.
Discussion
Here we show that FLOT2, a lipid raft-associated protein, supports the expression of the adhesion molecule CD44, thereby influencing the course of CML. Despite similarly reduced expression of CD44 in FLOT2-deficient AML LIC, AML homing and progression were not impaired, which may be due to differences in the cytoskeleton, cellular polarization, and downstream signaling between WT and FLOT2-deficient BCR-ABL1+ and MLL-AF9+ cells. In BCR-ABL1+ cells, these effects may, additionally, be modulated by CDC42. Therefore, these data establish a Flot2-CD44-CDC42 signaling network which differentially impacts myeloid leukemia progression (graphical abstract).
No survival differences were observed in WT vs FLOT2-deficient BCR-ABL1+ B-ALL (ie, lymphoid leukemia), suggesting that CD44 is not essential for the engraftment of B–ALL-initiating cells, consistent with previous reports.3 While we were not successful at convincingly rescuing the induction of CML-like disease by FLOT2-deficient LIC overexpressing CD44, we believe that this may have been due to the impact of other molecules, such as CDC42, or the particularly rapid disease progression in this experiment. In addition, our data are restricted to the role of FLOT2 in leukemia, but we cannot rule out that the observed phenotype may also be due to simultaneously decreased (ie, epistatic) expression of FLOT1.41
Multiple reports have described that an upregulation of flotillins is associated with increased aggressivity of invasive carcinomas, such as intrahepatic cholangiocarcinoma,42 nasopharyngeal carcinomas,43 and sarcomas, whereby various signaling pathways influencing cell migration, proliferation, cell cycle, invasion, and metastasis have been implicated,44,45 similar to our studies.
Lipid rafts can modulate the activity of Rho-GTPases such as CDC42 in cells of hematopoietic origin, influencing their polarity.46 Increased levels of CDC42 have, in fact, been reported for aged HSCs,39 while in tumors, overexpression or hyperactivation of CDC42 have been associated with disease progression, rendering CDC42 an attractive therapeutic target using various agents.47,48
While our observations regarding CDC42 may have been due to the known activation of the Rho family GTPases RhoA, Rac1, and CDC42 by BCR-ABL1,49 our results suggest that these effects occur independently of the BCR-ABL1 kinase. In contrast, higher levels of CDC42 in BCR-ABL1+ cells at baseline could be reduced by kinase inhibition in another study.50 This was associated with the restoration of migratory properties toward CXCL12. In how far this discrepancy may be attributable to deficiency of FLOT2 in our study and to what extent FLOT2 deficiency may be affecting chemoattraction to CXCL12 in the BMM, beyond adhesion to E-selectin (and other proteins) via CD44, will need to be addressed in future studies. In addition, compared with another report employing CDC42-deficient murine LIC,39 the observed decrease of cellular polarity after inhibition of CDC42 in our study or, in general, the role of CDC42 was more prominent in FLOT2-deficient CML compared with AML. Our results underline differences in the nature of CML vs AML LIC, particularly regarding the cytoskeleton.
Whether our findings may influence outcomes after chemotherapies or may be of therapeutic relevance will need to be addressed in future studies. However, it is believed that such effects, if they existed, may be dependent on the cancer stem cell marker CD44, whose targeting has been shown to prolong survival in CML.3 While specific targeting of flotillins may not be feasible due to their ubiquitous expression on normal and malignant cells18 and the association of autoantibodies to flotillin 1/2 with demyelinating disease,51 a strategy targeting the interaction of CD44-FLOT2 may be a possible therapeutic alternative.
In sum, our data connect FLOT2 with the expression of CD44, leading to differences in survival between mice with CML vs AML, likely due to distinctive aberrations in membrane integrity and CDC42-mediated signaling.
Acknowledgments
This work was supported by institutional funds of the Georg-Speyer-Haus to D.S.K. The Georg-Speyer-Haus is funded jointly by the German Federal Ministry of Health (BMG) and the Ministry of Higher Education, Research, and the Arts of the State of Hessen (HMWK). The LOEWE Center for Cell and Gene Therapy Frankfurt is funded by HMWK, reference number: III L 4-518/17.004 (2010).
Authorship
Contribution: R.K., R.S.P., and D.S.K. designed the experiments; R.K. and R.S.P. performed the in vitro and in vivo experiments; J.N., A.I.A., C.Z., C.K., M.M., P.S.G., W.M., and V.R.M. assisted with experiments and critically discussed data; E.K. and R.M. performed the LDI-PCR experiments; S.L., V.M.-S. (leukemia samples), E.W., and H.B. (normal CD34+ cells) provided human samples; R.K., R.S.P., J.N., and A.I.A. analyzed the data; R.K. wrote a first draft of the manuscript; D.S.K. supervised the research, analyzed data, and wrote the manuscript; and all authors critically read and approved the manuscript.
Conflict-of-interest disclosure: The authors declare no competing financial interests.
Correspondence: Daniela S. Krause, Georg-Speyer-Haus, Institute for Tumor Biology and Experimental Therapy, Paul-Ehrlich-Str. 42-44, 60596 Frankfurt am Main, Germany; e-mail: Krause@gsh.uni-frankfurt.de.

