

Key Points
Baseline data (but not genetics) added to CLL-IPI variables improve predictive performance of ML models in CLL.
Risk factors predictive of death within a 5-year outlook are mostly similar to risk factors predictive of infection within a 2-year outlook.

Abstract
A highly variable clinical course, immune dysfunction, and a complex genetic blueprint pose challenges for treatment decisions and the management of risk of infection in patients with chronic lymphocytic leukemia (CLL). In recent years, the use of machine learning (ML) technologies has made it possible to attempt to untangle such heterogeneous disease entities. In this study, using 3 classes of variables (international prognostic index for CLL [CLL-IPI] variables, baseline [para]clinical data, and data on recurrent gene mutations), we built ML predictive models to identify the individual risk of 4 clinical outcomes: death, treatment, infection, and the combined outcome of treatment or infection. Using the predictive models, we assessed to what extent the different classes of variables are predictive of the 4 different outcomes, within both a short-term 2-year outlook and a long-term 5-year outlook after CLL diagnosis. By adding the baseline (para)clinical data to CLL-IPI variables, predictive performance was improved, whereas no further improvement was observed when including the data on recurrent genetic mutations. We discovered 2 main clusters of variables predictive of treatment and infection. Further emphasizing the high mortality resulting from infection in CLL, we found a close similarity between variables predictive of infection in the short-term outlook and those predictive of death in the long-term outlook. We conclude that at the time of CLL diagnosis, routine (para)clinical data are more predictive of patient outcome than recurrent mutations. Future studies on modeling genetics and clinical outcome should always consider the inclusion of several (para)clinical data to improve performance.
Introduction
Survival in patients with chronic lymphocytic leukemia (CLL) has improved significantly with the introduction of chemoimmunotherapy and later targeted therapies.1-5 Although both survival from diagnosis and survival after treatment have improved,1-3 infection is still the primary cause of mortality before and during treatment across all age groups.6,7 Because CLL treatments may suppress immune function, it is necessary to identify patients at high risk of infection, death, or treatment at diagnosis and before a specific treatment modality is initiated. The international prognostic index for CLL (CLL-IPI) was proposed to stratify patients with CLL according to risk of treatment and mortality using a small set of variables.8 Likewise, various Cox regression models have been able to identify certain risk factors; however, real-world data with varying degrees of missingness at different time points call for the use of machine learning (ML) models.9 Eventually, the goal of complex modeling in CLL would be to predict the risks of infection and other complications as well as the chance of efficacy of different treatment modalities for a specific patient. Furthermore, by predicting overall survival, we may identify the most vulnerable patients in need of specialized supportive care.
In recent years, there has been growing interest in fusing different data types and sources of information to improve the performance of ML predictive models.10-14 Multimodal modeling has been applied to a range of medical data, including electronic medical records,15 medical imaging,16 laboratory tests,17 microbiology culture results,18 and genetic data.19 We recently developed CLL-TIM (CLL Treatment Infection Model), an ML algorithm aimed to identify patients at high risk of infection and/or treatment based on CLL-IPI variables and routine (para)clinical data.20 Furthermore, we and others have assessed the prognostic impact of recurrent mutations in CLL.21-26 The addition of both genetic data and routine (para)clinical data along with CLL-IPI variables has demonstrated improved prognostic indices.20,21,27 Recently, Gruber et al28 demonstrated that specific genetic patterns correlate with lymphocyte kinetics (ie, development of lymphocytosis) in patients with CLL. This study may be seen as a first step toward mapping the correlation between genetic and routine laboratory changes over time.
In this study, we focus on using multimodal learning principles to create data-driven models that can test the importance of different classes of data in terms of genetic, (para)clinical, and CLL-IPI variables for prediction of different clinical outcomes on different timescales. More specifically, we built a supervised ML algorithm to predict death, treatment, infection, and a combined event of treatment and/or infection within 2 and 5 years postdiagnosis. We aim to build decision support systems that can guide clinicians toward individual patient care for prospective testing in clinical trials and eventual clinical implementation.
Methods
Data set
We used a single-center retrospective cohort of patients with CLL who were diagnosed between 2008 and 2016. Our data consisted of CLL-IPI variables (Table 1), recurrent mutations, and routine laboratory tests obtained before CLL diagnosis. CLL-IPI variables were retrieved form the Danish National CLL Register (DCLLR)8 and were modified as previously described using a B2M level of 4.0 mg/L as a cutoff and del(17p) as the only TP53 aberration.3,21 Data on recurrent mutations (56 genes) were collected at time of diagnosis using targeted next-generation sequencing as previously described.21 In total, 515 mutations were found in 219 patients, ranging from 1 to 10, with a median of 2. Excluding IGLL5 mutations, which are considered passenger mutations from IGHV hypermutation, the total number was 413 mutations in 197 patients. A list of recurrent mutations is provided in the data supplement (supplemental Data). Of noncoding mutations, we included only splice site mutations (with +2-bp intronic overlap) in the listed genes and the common 3′ untranslated region deletion in NOTCH1. The features extracted from the recurrent mutations included binary features indicating the presence or absence (1-hot encoding) of each recurrent mutation, the total number of recurrent mutations, the number of driver mutations, and the number of altered signaling pathways.22 We extracted a range of baseline features from the DCLLR, such as age, sex, family history of CLL, Eastern Cooperative Oncology Group performance status, CD38 positivity, 70 kDa ζ-associated protein (ZAP70) positivity, and FISH status for del(13q), tri(12), del(11q), and del(17p). Furthermore, biochemical and microbial data from routine blood tests, such as hemoglobin levels, complete blood counts, and C-reactive protein levels, as well as information on blood cultures were retrieved from the PERSIMUNE data warehouse.29 In contrast to baseline data, routine blood tests were collected longitudinally before and after CLL diagnosis. Lastly, we computed the number of previous infections each patient had before diagnosis.20
CLL-IPI characteristics of newly diagnosed patients with CLL (n = 314)
| Variable | N (%) |
|---|---|
| Age, y | |
| ≤65 | 125 (39.8) |
| >65 | 189 (60.2) |
| Binet stage | |
| A | 273 (86.9) |
| B/C | 41 (13.1) |
| B2M, mg/L | |
| ≤4.0 | 263 (85.9) |
| >4.0 | 43 (14.1) |
| Missing | 8 |
| IGHV status | |
| Mutated | 211 (67.4) |
| Unmutated | 102 (32.6) |
| Missing | 1 |
| del(17p) | |
| Absent | 284 (95.3) |
| Present | 14 (4.7) |
| Missing | 16 |
| TP53 | |
| Mutated | 21 (6.7) |
| Wild type | 293 (93.3) |
| CLL-IPI risk | |
| Low | 167 (57.4) |
| Intermediate | 87 (29.9) |
| High | 31 (10.7) |
| Very high | 6 (2.1) |
| Missing | 23 |
B2M, β2-microglobulin.
Models
By using different combinations of feature sets, we defined 4 models: CLL-IPI features only (IPI), CLL-IPI features plus recurrent mutations (+MUT), CLL-IPI features plus baseline (para)clinical features (+BL), and all features combined (ALL).
We used these 4 models to test (1) whether adding recurrent mutations to CLL-IPI features improves the performance of the predictive model further (IPI vs +MUT), (2) whether adding baseline (para)clinical features to CLL-IPI features improves the performance of the predictive model further (IPI vs +BL), (3) whether adding baseline (para)clinical features to CLL-IPI features improves the performance more than adding recurrent mutations to CLL-IPI features (+MUT vs +BL), and (4) whether using all the feature sets improves the performance more than using CLL-IPI and baseline (para)clinical features (+BL vs ALL).
Algorithms
To predict the clinical outcomes, we used a range of boosting algorithms, including AdaBoost,30 XGBoost,31 LighGBM,32 and CatBoost,33 and 3 bagging algorithms: RandomForest,34 ExtraTrees,35 and an ensemble of LinearSVM36 with bagging. The missing values were imputed by applying the mean strategy. Before training RandomForest and ExtraTrees, a subset of features was selected using a feature-selection step based on LinearSVM with lL regularization. In bagging- and boosting-based models (including AdaBoost, XGBoost, and LightGBM), the training algorithm performed the feature-selection step intrinsically by selecting features that minimized the prediction error. Thus, all the features were used in the training of bagging and boosting models without any external feature selection before the learning phase. We combined the predictions of the algorithms using majority voting. To address the imbalance in the number of samples in the classes, we adjusted the class weights inversely proportionally to the class frequencies in the training set. We implemented all the algorithms in Python using the Scikit-learn package.37 The code to test the predictive model is available at https://gitlab.com/mparviz/cll-baseline. To use the code for prediction, patient data containing clinical variables must be provided in the form of a csv file with 76 columns and n rows (n is the number of patients).
Evaluation metrics
True (TPs) and false positives (FPs) refer to the numbers of predicted high-risk patients that were correct and incorrect, respectively. Similarly, true (TNs) and false negatives (FNs) refer to the numbers of predicted low-risk patients that were correct and incorrect, respectively.
Prediction point and outlooks
Aiming to identify both high- and low-risk patients, we performed predictions in both a 2-year and a 5-year outlook after CLL diagnosis. We included all the test results obtained 3 months after diagnosis to allow for modeling of all the diagnostic tests in the training set. Thus, no predictions were performed during the first 3 months of the outlooks. For a given patient and outcome, depending on the length of the outlook, the target values used in the supervised learning might change. For instance, the target value corresponding to a patient treated 3 years postdiagnosis would be 0 in the 2-year outlook, whereas in the 5-year outlook, the target value would be 1.
Outcomes
Primary outcomes were death, treatment, infection, and a composite event of infection or treatment within the predictive time window postdiagnosis as previously described.20 The modeling of treatment and infection was done separately (ie, the event of infection before treatment was not included in the treatment outcome and vice versa). We used the event of having a blood culture drawn as a proxy for infection because it is a clinical standard practice to draw a blood culture only when a patient has a clinical infection.20,38 This is true whether the blood culture result is negative, indicating contamination, or positive.39-41
Data set split
To investigate the variability of the algorithm performances across the features sets and outcomes, we used both a fixed holdout data set and K-fold cross-validation (supplemental Figure 1). To do this, we first divided the cohort into 3 disjoint sets, set A, set B, and set C, for a given outcome and outlook where the splits were stratified with respect to the class labels.
K-fold cross-validation
To assess the generalizability of the ML algorithm predictions on the unseen samples for a given feature set and algorithm, we used a K-fold cross-validation algorithm42 to perform training and testing on set A. To reduce the variability caused by the partitioning, multiple rounds of cross-validation were performed. By running multiple rounds, we estimated the performance of the algorithms more robustly and later tested the significant performance differences among the models. However, to compare the MCCs obtained for each round/split across the models, we used the same random initialization for data splitting across the algorithms and the models. Here we set the number of folds to 5 and the number of rounds to 40 and optimized the algorithm hyperparameters by running a fivefold grid search. This procedure was repeated for all the algorithms on all 4 models and 2 outlooks.
Holdout validation
To further assess the generalizability and robustness of the trained models, we performed a holdout validation42 using combined sets A and B as the training set and set C as the test set. Like the evaluation process on set A, we performed a fivefold grid search to optimize the algorithm hyperparameters.
Statistical analysis
Because the random seed used to generate data splits in fivefold cross-validation in each round was the same across the models, the obtained MCC values were matched. Therefore, we used the Wilcoxon signed-rank test43 to assess the significance of the model performances and test the hypotheses. Kaplan-Meier estimates of overall survival, treatment-free survival, infection-free survival, and treatment and infection–free survival were used to estimate the survival function of the models. P values were calculated by the log-rank test, and hazard ratios were calculated using Cox regression analysis. We performed the statistical analyses in Python using the lifelines package.44
Explainability
Recently developed models in the field of explainable artificial intelligence can be used to explain the predictions of ML algorithms by quantifying the importance of each feature. Using these models, risk factors predictive of clinical outcomes can be identified. Here, we used Shapley Additive Explanations (SHAP)45 values to measure the contribution of each feature to the algorithm prediction. More specifically, we calculated the average of absolute SHAP values for each feature and retained only those with an average SHAP value >0.01.
The recurrent mutation identified in the cohort was provided in the supplementary data of a previously published paper.21
Results
Patient characteristics
Modeling was based on data and diagnostic samples from 314 consecutive patients with CLL.21 The patient composition was similar to that of prior published cohorts, at 60% male, 87% with Binet stage A, 67% with unmutated IGHV, and 6.7% with TP53 aberrations, as detailed in Table 1. With a median follow-up of 6.5 years (95% confidence interval, 5.9-7.1), all patients were included in the full 2-year follow-up, whereas some were right censored in the 5-year follow-up (supplemental Table 1). In total, 49 patients were excluded because of an occurring event (ie, death, treatment, or infection) before the prediction time point. In addition to the previously published data on recurrent mutations (+MUT) in 56 genes based on the diagnostic samples,21 76 (para)clinical baseline variables (+BL), similar to those included in the modeling of the previously published20 CLL-TIM algorithm (supplemental Data), along with data on CLL-IPI variables formed the basis for modeling, as outlined in Figure 1. The study was approved by the Danish Data Protection Agency, health authorities, and National Committee on Health Research Ethics. Because of its retrospective biobank use, the study did not require written informed permission under Danish legislation.
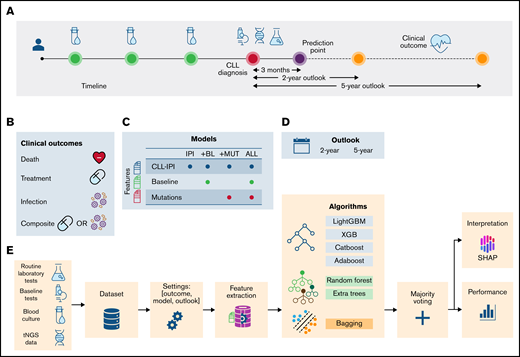
Schematic representation of the data collection and analysis. (A) Data from different data sources, including baseline tests ( ), routine laboratory tests (
 ), and recurrent mutations (
 ), were combined to construct a heterogeneous data set. Prediction point was set at 3 months postdiagnosis, and clinical outcomes (
 ) were predicted. (B) The clinical outcomes were death (
 ), treatment (
 ), the combined event of treatment or infection (composite), and infection (
 ). (C) Based on the combination of feature sets, 4 models were defined: (1) IPI, which included CLL-IPI score and the CLL-IPI features only; (2) +BL, which included CLL-IPI features, baseline tests, and routine laboratory tests; (3) +MUT, which included CLL-IPI features and recurrent mutations; and (4) ALL, which included all features. (D) Clinical outcomes were predicted in 2- and 5-year outlooks postdiagnosis (except for the first 3 months). (E) The data from different sources were merged to create one data set (
 ). Then, for a specific outcome and outlook, the target values were created and later used in the training/test (
 ). Based on the model, feature extraction was performed (
 ). A stacked ML model consisting of 7 algorithms and a fusion stage based on majority voting was trained and tested. The performance of the models (
 ) and the contribution of the features (
 ) were estimated to identify the risk factors predictive of each combination of outcome, model, and outlook. tNGS, targeted next-generation sequencing.
Schematic representation of the data collection and analysis. (A) Data from different data sources, including baseline tests (), routine laboratory tests (), and recurrent mutations (), were combined to construct a heterogeneous data set. Prediction point was set at 3 months postdiagnosis, and clinical outcomes () were predicted. (B) The clinical outcomes were death (), treatment (), the combined event of treatment or infection (composite), and infection (). (C) Based on the combination of feature sets, 4 models were defined: (1) IPI, which included CLL-IPI score and the CLL-IPI features only; (2) +BL, which included CLL-IPI features, baseline tests, and routine laboratory tests; (3) +MUT, which included CLL-IPI features and recurrent mutations; and (4) ALL, which included all features. (D) Clinical outcomes were predicted in 2- and 5-year outlooks postdiagnosis (except for the first 3 months). (E) The data from different sources were merged to create one data set (). Then, for a specific outcome and outlook, the target values were created and later used in the training/test (). Based on the model, feature extraction was performed (). A stacked ML model consisting of 7 algorithms and a fusion stage based on majority voting was trained and tested. The performance of the models () and the contribution of the features () were estimated to identify the risk factors predictive of each combination of outcome, model, and outlook. tNGS, targeted next-generation sequencing.
Including baseline (para)clinical features improves performance significantly, whereas adding recurrent mutations shows no significant effect
Overall, starting out with modeling based on CLL-IPI variables, adding (para)clinical features improved the performance significantly (P < .001 using Wilcoxon signed-rank test), whereas adding recurrent mutations showed no significant effect (P > .05). The results of the K-fold cross-validation in predicting clinical outcomes across the outlooks showed that adding baseline (para)clinical features (+BL) to CLL-IPI features (IPI) improved the performance of the predictive models further (Figure 2). Although the improvements were significant across all outcomes and both outlooks, the difference between +BL and IPI increased for infection and the composite outcome compared with death and treatment.
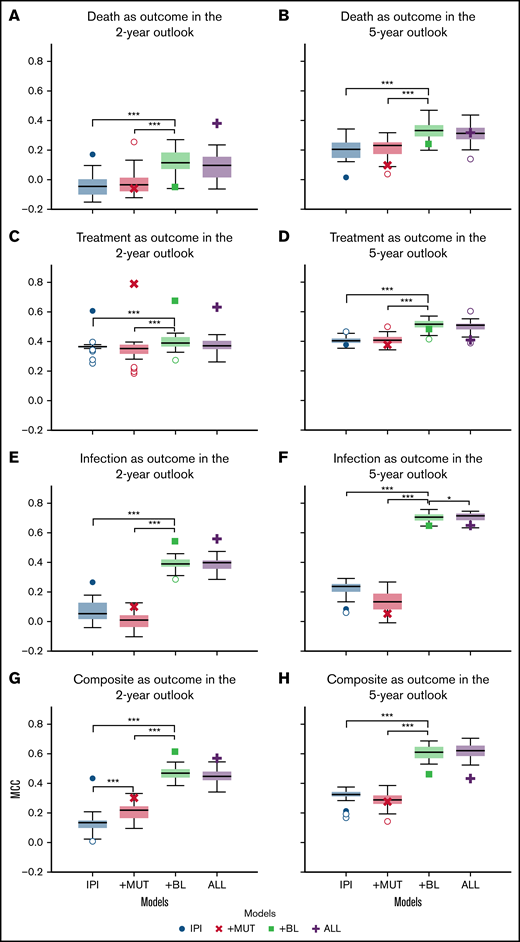
Comparison of the performance of the models in predicting clinical outcomes. Box plots depicting the performance of the 4 models in predicting death, treatment, infection, and the combined outcome of infection or treatment within 2-year (A,C,E,G) and 5-year (B,D,F,H) outlooks postdiagnosis. In each subplot, the box plots show the quartiles, the median, and the outliers of MCC values obtained using fivefold cross-validation on set A. The scatter plots (single marker for each model) demonstrate the MCC value of the holdout validation on set C. Death (A-B), treatment (C-D), treatment or infection (composite) (E-F), and infection (G-H). *P =.05, ***P =.001.
Comparison of the performance of the models in predicting clinical outcomes. Box plots depicting the performance of the 4 models in predicting death, treatment, infection, and the combined outcome of infection or treatment within 2-year (A,C,E,G) and 5-year (B,D,F,H) outlooks postdiagnosis. In each subplot, the box plots show the quartiles, the median, and the outliers of MCC values obtained using fivefold cross-validation on set A. The scatter plots (single marker for each model) demonstrate the MCC value of the holdout validation on set C. Death (A-B), treatment (C-D), treatment or infection (composite) (E-F), and infection (G-H). *P =.05, ***P =.001.
In contrast, adding recurrent mutations showed no improvement in predicting different clinical outcomes as assessed by MCCs. More specifically, comparing the performances of the +MUT and IPI models, adding recurrent mutations to CLL-IPI features (+MUT) had little effect on model performance. In comparison with CLL-IPI (IPI) and the baseline (para)clinical features (+BL), using all feature sets (ALL) did not improve performance further. However, for modeling the composite outcome of infection or treatment, recurrent mutations improved performance when added to CLL-IPI variables for the 2-year outlook (Figure 2G). For infection as an outcome, adding recurrent mutations on top of baseline (para)clinical features (ALL) improved predictive performance for the 5-year outlook (Figure 2F).
Compared with the 2-year outlook (Figure 2A,C,E,G), the 5-year outlook (Figure 2B,D,F,H) showed that performance improved across all models and across all outcomes. Furthermore, the improvements were larger for the models that included baseline (para)clinical features (+BL and ALL) compared with the models that were restricted to CLL-IPI (IPI) and recurrent mutations (+MUT).
We investigated the generalizability of the models further by performing holdout validation. The scatter plots (single marker for each model) in Figure 2 show the MCC value of the holdout validation on set C. Overall, the models achieved MCCs on set C comparable to the values obtained on set A, which indicates the robustness of the proposed ML framework and the effectiveness of the baseline (para)clinical features.
Identifying patterns of risk factors predictive of clinical outcomes and how they change with outlook
To identify the risk factors predictive of different outcomes, we computed the contribution of (para)clinical and CLL-IPI features across all samples included in the model. We discovered 2 clusters of features, the first mostly predictive of treatment and the other predictive of infection (Figure 3). Similarly, hierarchic clustering of the risk factor patterns yielded 2 main groups of outcome-outlook. One group contained treatment, and the other consisted of infection and the composite outcome (Figure 4). Interestingly, in the 2-year outlook, death was merged with treatment, whereas in the 5-year outlook, death was merged with infection and the composite outcome. The treatment-predictive cluster included IGHV germ line identity percentage, IGHV mutational status, CLL-IPI score, platelet count, absolute lymphocyte count, haptoglobin, and presence of del(11q) (Figure 3B,F). The infection-predictive cluster included number of prior infections, age (continuous), age >65 years (categorical), IgA, del(13q), and a range of laboratory tests (ie, B2M, hemoglobin, glucose, bilirubin, reticulocytes, and lactate dehydrogenase; Figure 3D,H). Because the composite outcome was the combined event of infection or treatment within the specified outlook, we expected to see features from both clusters to appear as risk factors. For the 5-year outlook, the identified risk factors predictive of the composite outcome were distributed almost equally between treatment-predictive and infection-predictive clusters (Figure 3G). For the 2-year outlook, they were skewed toward the infection-predictive cluster (Figure 3C). In addition, we observed a cluster of risk factors that were mostly predictive of the composite outcome for the 2-year outlook. This included Eastern Cooperative Oncology Group performance status, familial CLL, albumin level, IgM level, and neutrophil count.
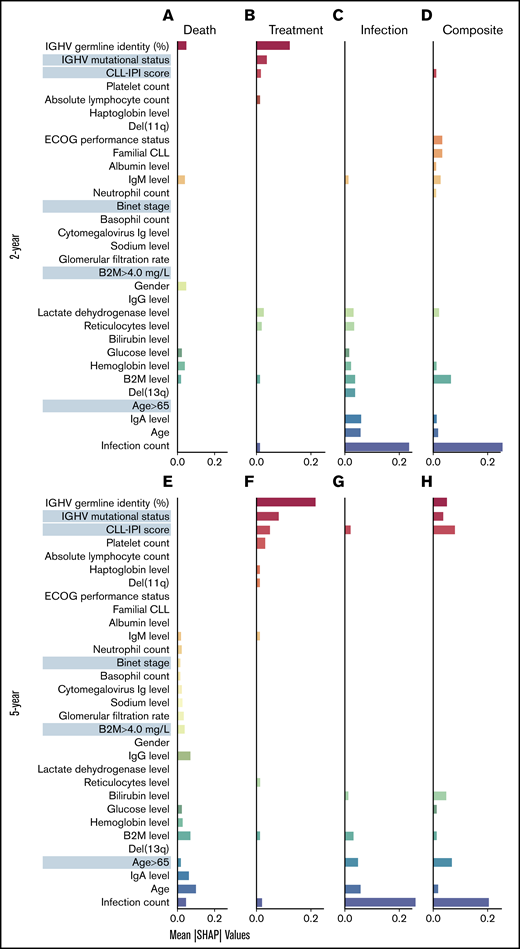
Identified risk factors predictive of the outcomes. SHAP plots on the full cohort illustrate the contribution of the most important features in predicting the clinical (mean absolute SHAP values >0.01) in 2-year outlook (A-D) and 5-year outlook (E-H). Death (A,E), treatment (B,F), treatment or infection (C,G), and infection (D,H). The cluster of features predictive of different outcomes was detected after sorting the features so that the most important features predictive of treatment appear at the top (red) and the most important features predictive of infection appear at the bottom (blue). The features more predictive of death or the composite outcome and not treatment or infection appear in the middle. ECOG, Eastern Cooperative Oncology Group; Ig, immunoglobulin.
Identified risk factors predictive of the outcomes. SHAP plots on the full cohort illustrate the contribution of the most important features in predicting the clinical (mean absolute SHAP values >0.01) in 2-year outlook (A-D) and 5-year outlook (E-H). Death (A,E), treatment (B,F), treatment or infection (C,G), and infection (D,H). The cluster of features predictive of different outcomes was detected after sorting the features so that the most important features predictive of treatment appear at the top (red) and the most important features predictive of infection appear at the bottom (blue). The features more predictive of death or the composite outcome and not treatment or infection appear in the middle. ECOG, Eastern Cooperative Oncology Group; Ig, immunoglobulin.
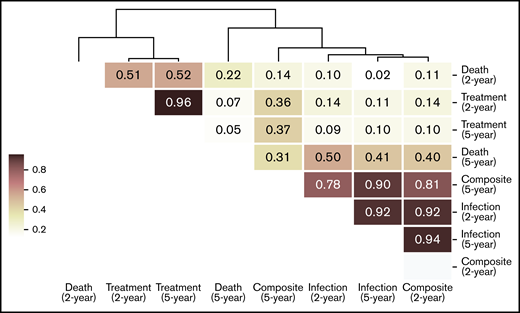
Hierarchic clustering of risk factors predictive of clinical outcomes in the 2 outlooks. The similarity between each pair of risk factor patterns was calculated using cosine similarity, which is the cosine of the angle between 2 n-dimensional vectors. Then, the risk factor patterns were grouped by performing hierarchic clustering on the computed similarity matrix.
Hierarchic clustering of risk factors predictive of clinical outcomes in the 2 outlooks. The similarity between each pair of risk factor patterns was calculated using cosine similarity, which is the cosine of the angle between 2 n-dimensional vectors. Then, the risk factor patterns were grouped by performing hierarchic clustering on the computed similarity matrix.
In the case of modeling death, the risk factors for the 2-year outlook were divided between the 2 clusters, using the IGHV germ line identity as the numeric value from the treatment-predictive cluster and 3 routine laboratory tests (B2M, hemoglobin, and glucose levels) from the infection-predictive cluster (Figure 3A). Apart from Binet stage, B2M, and a series of laboratory tests (ie, estimated glomerular filtration rate, cytomegalovirus immunoglobulin level, neutrophil and basophil counts, and sodium, IgG, and IgM levels), which were largely related to death in the 5-year outlook, the remaining risk factors were from the infection-predictive cluster (Figure 3E).
To visualize the discriminative performance of the model, Kaplan-Meier curves were generated for the 2- and 5-year outlooks (Figures 5 and 6). In line with the assessment of the discriminative performance by MCCs, this showed that +BL outperformed IPI for all 4 outcomes for both the 2- and 5-year outlooks, except for treatment in the 2-year outlook (Figure 5C).
![Event-free survival plots for 2-year outlook on the full cohort. Patients were stratified by the classifier using CLL-IPI variables (TP53 aberrations, IGHV mutational status, B2M level, clinical stage, and age [IPI]) (A,C,E,G) and addition of (para)clinical variables to the CLL-IPI variables (+BL) (B,D,F,H). Overall survival (A-B), treatment-free survival (C-D), treatment and infection–free survival (E-F), and infection-free survival (G-H). HR, hazard ratio.](https://ash.silverchair-cdn.com/ash/content_public/journal/bloodadvances/6/12/10.1182_bloodadvances.2021006351/3/m_advancesadv2021006351f5.png?Expires=1769207480&Signature=EqYQRxE4GToijqk5erzzm7KB790Bo6VHpADmjHL61qh7Fg9uratISS3eq5CIZejRHkzeh3ov~9Qpif3txudTQZhFpk31grb80PuQ9Hd20CX62G0raT8B9EUYBBMDkUqNDIBGUgdIhVjw6xctNIhMoW6J6SpqaBMwMhzrthXLzyF4J63F3~R-fErZdMAT2C4zWuLAQ9vhYeWSMz12aEUYvxwinXjS6AII85YT520EnaZuMOe0XMDSkL~q0AbTnAOWw9EQt9MY9VeiBnFY7G2fMHulEUdp8BWgK9jUo0vLeOwSPwLH9eSNbQgACR6ZL3z7mA4bqPaE4gs4605cvsEI5w__&Key-Pair-Id=APKAIE5G5CRDK6RD3PGA)
Event-free survival plots for 2-year outlook on the full cohort. Patients were stratified by the classifier using CLL-IPI variables (TP53 aberrations, IGHV mutational status, B2M level, clinical stage, and age [IPI]) (A,C,E,G) and addition of (para)clinical variables to the CLL-IPI variables (+BL) (B,D,F,H). Overall survival (A-B), treatment-free survival (C-D), treatment and infection–free survival (E-F), and infection-free survival (G-H). HR, hazard ratio.
Event-free survival plots for 2-year outlook on the full cohort. Patients were stratified by the classifier using CLL-IPI variables (TP53 aberrations, IGHV mutational status, B2M level, clinical stage, and age [IPI]) (A,C,E,G) and addition of (para)clinical variables to the CLL-IPI variables (+BL) (B,D,F,H). Overall survival (A-B), treatment-free survival (C-D), treatment and infection–free survival (E-F), and infection-free survival (G-H). HR, hazard ratio.
![Event-free survival plots for 5-year outlook on the full cohort. Patients were stratified by the classifier using CLL-IPI variables (TP53 aberrations, IGHV mutational status, B2M level, clinical stage, and age [IPI]) (A,C,E,G) and addition of (para)clinical variables to the CLL-IPI variables (+BL) (B,D,F,H). Overall survival (A-B), treatment-free survival (C-D), treatment and infection–free survival (E-F), and infection-free survival (G-H). HR, hazard ratio.](https://ash.silverchair-cdn.com/ash/content_public/journal/bloodadvances/6/12/10.1182_bloodadvances.2021006351/3/m_advancesadv2021006351f6.png?Expires=1769207480&Signature=CeyjuDnO4TXPRYUMaynY6XnDM8QrLvUmFGmBlyXSOPnQege6lShUlvdjhBUxaSBIE3UdNnSOzz2BZdqoiCsGChswrrvs6plpoB5XkCoMd9ZpUsx1vL4m4Wz1WEWhbYj3ZA2qDEvn9vGrbye2mx~addklKMfzjXVbsdYtp01mkWCE2CIBKlvNtDhotO2dO3GxXdE0YWCX~PORtJ9JMyIgIanAtPCzjw8RMkWIwn4BlQz3izNzdPOoEMWcygxCn2HiQBbrftxKqRap-6pkcGDYI5CAMpjrc-Z-ggbhE5Gf-bj6DJ7hvEoTPfhI7G1Xs9McJ9u062RsQDDapbw12hm-Hg__&Key-Pair-Id=APKAIE5G5CRDK6RD3PGA)
Event-free survival plots for 5-year outlook on the full cohort. Patients were stratified by the classifier using CLL-IPI variables (TP53 aberrations, IGHV mutational status, B2M level, clinical stage, and age [IPI]) (A,C,E,G) and addition of (para)clinical variables to the CLL-IPI variables (+BL) (B,D,F,H). Overall survival (A-B), treatment-free survival (C-D), treatment and infection–free survival (E-F), and infection-free survival (G-H). HR, hazard ratio.
Event-free survival plots for 5-year outlook on the full cohort. Patients were stratified by the classifier using CLL-IPI variables (TP53 aberrations, IGHV mutational status, B2M level, clinical stage, and age [IPI]) (A,C,E,G) and addition of (para)clinical variables to the CLL-IPI variables (+BL) (B,D,F,H). Overall survival (A-B), treatment-free survival (C-D), treatment and infection–free survival (E-F), and infection-free survival (G-H). HR, hazard ratio.
Discussion
In this study, we developed a predictive ML model of death, treatment, infection, and a composite event of treatment and infection. Besides (para)clinical features, we extracted features from recurrent genetic mutations and compared the performance of these 2 feature sets separately and combined. Finally, by building predictive models for 2- and 5-year outlooks, we studied how the length of the prediction time window influenced the pattern of identified risk factors.
To identify newly diagnosed patients with CLL with high risk of infection or treatment, we had previously developed CLL-TIM. This ML model is currently being applied in the selection of patients for a randomized clinical trial of upfront acalabrutinib for patients without International Workshop on Chronic Lymphocytic Leukemia criteria but at high risk of treatment and/or infection (PreVent-ACaLL; registered at www.clinicaltrials.gov as #NCT03868722). CLL-TIM was designed to predict a composite outcome within 2 years postdiagnosis on a relatively large cohort.20 This work showed that (para)clinical features were among the most important factors selected by the algorithm.
We demonstrated that for ML-based predictive modeling of death, treatment, and infection, adding (para)clinical features to CLL-IPI variables significantly improved predictions, whereas adding data on recurrent genetic mutations did not improve prediction of clinical outcomes on a medium-sized cohort of newly diagnosed patients with CLL. Recent evidence suggests that mutational profiling might be more challenging than previously thought. For example, the prognostic impact of recurrent mutations differed in patients with different IGHV-mutated and -unmutated status.46 In another study, it was shown that recurrent mutations in CLL were correlated with the development of lymphocytosis, which implies that biochemical baseline tests basically retain similar and probably more information regarding disease progression.28 As key International Workshop on Chronic Lymphocytic Leukemia47 criteria, lymphocyte doubling time, anemia, and thrombocytopenia may be predicted by genetic aberrations and may confound one another. Therefore, such (para)clinical features in our model seem to diminish the effect of recurrent genetic mutations. Another explanation for the lack of predictivity of recurrent genetic mutation data, which is in contrast to some previous studies,48 may be attributed to the difference in the multivariate models used to identify risk factors in previous work compared with ours. Previous work on mutational data has been based on association studies using Cox proportional hazards as a multivariate method.9 Conversely, the risk factors proposed in this work were derived using several and different multivariate models, as evidenced by the different ML algorithms used. Cox proportional hazards models are used to detect significant associative relationships between independent factors and the dependent variable, whereas ML algorithms are designed to predict the dependent variable given the independent factors. Understandably, the evaluation procedures of these models are also different. For standard statistical models, all samples from a cohort are usually used to perform a significance test, whereas an ML-based approach necessitates a model that is predictive on a blind test set. In this way, ML-based risk factors are predictive of an outcome and not just associative. It may also be the case that because many recurrent mutations are quite rare, partitioning the data makes it much harder for ML models to learn any meaningful relationships between these features and the clinical outcomes. Likewise, many genetic studies have investigated the tumor mutational load, such as the number of driver mutations, to make clinical sense of rare occurring events.21,22,25,27,49 This, in turn, has an impact on the identified risk factors. An obvious solution to this limitation is to investigate larger cohorts with recurrent mutational data and use an ML-based approach to study the possibility of discovering risk factors based on genetic information, although such data sets often include a limited set of sequenced genes. The presented findings do not rule out that genetic aberrations can improve modeling of clinical outcome; however, they emphasize the need for joint modeling of multidimensional data for improved predictive performance.
We identified a cluster of risk factors (IGHV germ line identity percentage, actual IGHV mutational status, CLL-IPI score, platelet count, absolute lymphocyte count, haptoglobin level, and presence of del (11q) strongly predictive of treatment but showing little predictivity toward infection. We also found a set of risk factors that are strongly predictive of infection but not so much of treatment. The cluster includes the infection count, age (as continuous variable), age > 65 years (categorical), del(13q), and a range of laboratory tests, such as reticulocyte count as well as hemoglobin, B2M, IgA, lactate dehydrogenase, bilirubin, and glucose levels. Therefore, features predictive of treatment may be harmful/unreliable for the prediction of infection. This may be the reason that some treatment features do not show up for prediction of the composite outcome, whereas the algorithm identified other features that were predictive of treatment (and infection) but not harmful for prediction of infection. Interestingly, most of these infection-only factors were also predictive of death in the 5-year outlook, which confirms the recent studies suggesting that infection is the primary cause of death among patients with CLL.3,6,7
From an ML perspective, our findings showed that including continuous variables such as age, IGHV germ line identity percentage, and B2M improved performance of the ML algorithms drastically. This indicates that alongside the binary version of certain variables, we can trust ML approaches to identify better cutoffs for improved predictive performance.
Using the proposed ML-based approach to discriminate high-risk and low-risk patients, we showed that including (para)clinical features improved risk stratification across all the outcomes and both outlooks, except for treatment outcome in the 2-year outlook. It is noteworthy that although generally higher MCC value correlates with higher hazard ratio, the relation between MCC metric and hazard ratio is not necessarily monotonically increasing, which explains the differences in our findings based on MCC values. We believe that moving toward ML models that are designed specifically for survival analysis could close the gap between Cox proportional hazards regression and supervised ML algorithms.9
When compared with the results of K-fold cross-validation, internal validation revealed that our model performed similarly. Considering the small sample size and the complexity and heterogeneity of the feature space, this is a promising finding that shows that good regularization can allow complex models to generalize well outside of the training data. Close similarity between the risk factors predictive of infection in the short term and death in the long term seem to reflect the high mortality resulting from infection in CLL. We emphasize that more predictive information can be modeled based on routine (para)clinical data than by data on recurrent mutations in CLL at time of diagnosis.
Using (para)clinical data to improve the predictive performance of ML models can help us improve our understanding of the relatedness between different clinical outcomes and propose more accurate prognostic scores that can identify high-risk patients with CLL. Future studies on modeling genetics and clinical outcome should thus always consider the inclusion of (para) clinical data other than IPI variables to improve performance.
Acknowledgments
This work is in part supported by funding from the Novo Nordisk Foundation (grant NNF16OC0019302), the Danish Cancer Society, and the Danish National Research Foundation (grant 126). This project was supported within the CLL-CLUE project by Innovation Fund Denmark, under the frame of ERA PerMed.
Authorship
Contribution: All authors designed the study; C.U.N. conceived and supervised the project; C.B. sequenced all samples and prepared baseline data; R.A. prepared all para(clinical) and microbial data; and M.P. performed data analysis and prepared the manuscript together with C.U.N., with input from all authors, who reviewed and approved the final manuscript.
Conflict-of-interest disclosure: C.B. received honoraria from AstraZeneca outside this study. C.U.N. received research funding and/or consultancy fees outside this work from AbbVie, AstraZeneca, Janssen, Roche, CSL Behring, Roche, Octapharma, and Takeda.
Correspondence: Carsten U. Niemann, Rigshospitalet, Copenhagen University Hospital, Blegdamsvej 9, Copenhagen 2100, Denmark; e-mail: carsten.utoft.niemann@regionh.dk.

