

Key Points
Proteomic profiling identifies downregulated CLU expression as potential driver of myeloid hyperproliferation in PV.
We detect LGALS9 and SOCS2 protein expression in HSC/MPPs as possible markers for progressed PV.

Abstract
Polycythemia vera (PV) is a stem cell disorder characterized by hyperproliferation of the myeloid lineages and the presence of an activating JAK2 mutation. To elucidate mechanisms controlling PV stem and progenitor cell biology, we applied a recently developed highly sensitive data-independent acquisition mass spectrometry workflow to purified hematopoietic stem and progenitor cell (HSPC) subpopulations of patients with chronic and progressed PV. We integrated proteomic data with genomic, transcriptomic, flow cytometry, and in vitro colony formation data. Comparative analyses revealed added information gained by proteomic compared with transcriptomic data in 30% of proteins with changed expression in PV patients. Upregulated biological pathways in hematopoietic stem and multipotent progenitor cells (HSC/MPPs) of PV included mammalian target of rapamycin (MTOR), STAT, and interferon signaling. We further identified a prominent reduction of clusterin (CLU) protein expression and a corresponding activation of nuclear factor-κB (NF-κB) signaling in HSC/MPPs of untreated PV patients compared with controls. Reversing the reduction of CLU and inhibiting NF-κB signaling decreased proliferation and differentiation of PV HSC/MPPs in vitro. Upon progression of PV, we identified upregulation of LGALS9 and SOCS2 protein expression in HSC/MPPs. Treatment of patients with hydroxyurea normalized the expression of CLU and NF-κB2 but not of LGALS9 and SOCS2. These findings expand the current understanding of the molecular pathophysiology underlying PV and provide new potential targets (CLU and NF-κB) for antiproliferative therapy in patients with PV.
Introduction
Polycythemia vera (PV) is a myeloproliferative neoplasm (MPN) characterized by hyperproliferation of all myeloid cell lineages1,2 and driven at least in part by an activating JAK2 mutation.3-6 Disease-driving pathogenic changes in MPNs are thought to originate in MPN stem cells that form the diseased clonal progeny.7,8 In healthy individuals, hematopoietic stem/multipotent progenitor cells (HSC/MPPs) can differentiate into committed progenitor cells including common myeloid progenitors (CMPs), megakaryocyte-erythrocyte progenitors (MEPs), or granulocyte-macrophage progenitors (GMPs).9,10 When the HSC differentiation process is altered, abnormal stem cell subpopulations may form, leading to clonal hematopoiesis and the onset of myeloid disease.11,12 To elucidate the molecular and biochemical changes underlying stem or progenitor cell proliferation in chronic and progressed PV,1,7 highly refined molecular analyses of human hematopoietic stem and progenitor cells (HSPCs) in PV are required. Although human PV HSPCs have been investigated previously on the transcriptome level,13,14 corresponding analyses on the proteome level and in PV HSPC subpopulations have become possible only recently.15 In this study, we aimed to detect molecular patterns that distinguish HSC/MPPs and more committed CMP/MEPs from patients with untreated PV, patients with PV treated with hydroxyurea (HU), and controls on the protein and RNA level, deciphering molecular mechanisms underlying PV etiology and progression.
Until recently, proteomic analysis of fluorescence-activated cell sorter (FACS)-isolated cells had in general been described only in technical studies focused on optimization of specific parts of the workflow.16-19 Others used 400 000 cells as starting material.20 This restricted the scope of the analyses to abundant or large pools of cells. To overcome these limitations, we developed a new data-independent acquisition (DIA) mass spectrometry (MS) workflow for rare human HSPC subpopulations that occur at a frequency of less than 1 candidate cell per 1000 peripheral blood mononuclear cells and can be isolated by FACS.15 With this new DIA-MS technology, it became possible to identify states of biological networks in normal human HSC/MPPs that could not be detected using solely transcriptomics.15
We applied the new DIA-MS proteomic methodology to rare human HSPC subpopulations from patients with chronic and progressed PV and integrated the results with genomic, transcriptomic, flow cytometry, and in vitro colony formation data. We identified new potential drivers of myeloid hyperproliferation in PV and detected new potential markers of progressed PV.
Methods
Human hematopoietic stem/progenitor cell samples
Human peripheral blood samples were collected from patients with chronic and progressed PV (ie, post-PV myelofibrosis or post-PV acute myeloid leukemia) and from controls with phlebotomy-requiring hemochromatosis during clinical routine phlebotomy appointments (Department of Medical Oncology and Hematology, University Hospital Zurich, Zurich, Switzerland). Buffy coat samples from healthy controls were collected from the blood donation center SRK in Schlieren, Zurich, Switzerland. All samples were collected with informed consent, and the local ethics committee approved the study (KEK-ZH-Nr 2015-0564, BASEC-Nr PB_2019-00135, Kanton Zurich, Switzerland).
As indicated in supplemental Table 1, there were 4 different subgroups of subjects: (1) patients with chronic (chron) PV without cytoreductive treatment (PVchron.UT), (2) patients with chronic PV treated with HU (PVchron.HU), (3) patients with progressed (prog) PV (PVprog.UT and PVprog.HU), and (4) controls (hemochromatosis and buffy coats from healthy controls).
Cell preparation, flow cytometric analysis, cell sorting, and sample processing for MS
HSPC subpopulations were isolated using FACS as previously described.15 For flow cytometric analysis of intracellular clusterin (CLU) and LGALS9 expression, the IntraPrep Leukocytic Permeabilization Reagent Kit (Beckman Coulter) was used. Dead cells were excluded in the analysis using Zombie Aqua Fixable Viability Stain (BioLegend). A list of all antibodies is provided in supplemental Table 2.
For MS analysis, 25 000 HSC/MPPs and CMP/MEPs were sorted into protein low-binding micro-centrifuge tubes (Eppendorf) and prepared for MS analysis. Details on sample preparation are provided in the supplemental Material. For RNA sequencing (RNA-seq) analysis, up to 10 000 HSC/MPPs, CMP/MEPs, CMPs, GMPs, and MEPs were sorted into RNeasy lysis buffer (Qiagen) containing β-mercaptoethanol. For the probes labelled PV1/8/12, CON1, CON2, and CON3, samples from different individuals had to be pooled to guarantee adequate HSC/MPP numbers for downstream MS and RNA-seq measurements (supplemental Table 1).
MS analysis
To create the spectral library necessary for subsequent DIA-MS analyses of proteins from FACS-isolated clinical cell samples, a data-dependent acquisition (DDA) mode of operation was applied. For MS analysis of human HSC/MPPs and CMP/MEPs from patients with PV and controls, a data-independent acquisition (DIA) mode of operation was used. Liquid chromatography-MS/MS measurements were performed on an EASY-nLC 1200 system (Thermo Scientific) connected to an Orbitrap Fusion Lumos Tribrid mass spectrometer (Thermo Scientific) with a Nanospray Flex ion source.15 Details on sample separation, MS instrument settings, and library generation are provided in the supplemental Material.
Proteomic data analysis
DDA data were searched by Mascot21 (Matrix Science, version 2.5.1) and Comet22 version 2016.01 rev. 2 against the Swissprot reviewed subset of the human UniProt database with decoy sequences generated by sequence reversal (keeping C-terminal K and R residues). Spectral libraries from DDA data were generated as previously described.23 DIA data were evaluated by Spectronaut 1124 (Biognosys), querying the library built from DDA runs.
Peptide intensities were log2 transformed and normalized with a modified robust z-score transformation. For downstream analysis, data were filtered for proteins with proteotypic peptides, and a multilevel model was fitted to calculate differences among conditions per protein.25,26 Empirical Bayes moderated t statistics and their associated moderated P values were used to assess the significance of the observed expression changes.27 To adjust for multiple testing and to estimate false discovery rates (FDR), we used the Benjamini-Hochberg procedure. No imputation was allowed for statistical analyses or graphs except for the PV signature heatmap plot, where values of −6 were imputed for NAs. Details on proteomic data analysis are provided in the supplemental Material.
RNA isolation and sequencing
Total RNA was purified with the RNeasy Plus Micro Kit (Qiagen) following the manufacturer’s instructions. RNA-seq was performed as specified in Picelli et al28 using the NovaSeq sequencing platform (Illumina).
RNA-seq data analysis
RNA-seq data were analyzed as previously described.29 In brief, adapters and low-quality tails were trimmed from reads before mapping to the transcriptome. We used STAR aligner (v2.6.1.c)30 to align the RNA-seq data to Ensembl release 91 reference genome build GRCh38.p10. Gene expression values were quantified using featureCounts from the Bioconductor package Rsubread (v1.32.4).31 Differential gene expression was analyzed with the DESeq2 package (v1.22.2).32
Buffy coat samples were excluded from transcriptome analysis because they clustered away from other samples in RNA-seq but not in proteomic data, and pathway analysis showed RNA decay, but not protein decay, to be significantly upregulated in buffy coat samples (see supplemental Material).
Mutational analysis from RNA-seq data
We followed the GATK Best Practices Workflow.33 Mapped RNA reads were duplicates marked, split, and base quality recalibrated. Variants were called by HaplotypeCaller from GATK (v4.0.8.1)33 and annotated with Ensembl VEP.34 We tested the genes identified as frequently mutated in MPNs by Grinfeld et al.35 Listed are all mutations present in the catalogue of somatic mutations in cancer database and found in the analyzed patient and control HSPC populations after exclusion of (1) single nucleotide polymorphisms, (2) mutations described only in organs other than the hematopoietic/lymphatic system and mono-allelic, (3) mutations described only in organs other than the hematopoietic/lymphatic system and observed in only 1 subpopulation, and (4) mutations occurring in >80% of all samples including controls. The mutations were then classified as pathogenic or neutral based on functional analysis through hidden Markov models.36
Gene set enrichment analysis
Gene set enrichment analysis (GSEA) was performed on pre-ranked gene lists using the GSEA software (v4.1.0, http://www.broadinstitute.org/gsea) with default settings and the hallmark gene sets (h.all.v7.2.symbols.gmt) and gene sets retrieved from Fisher et al37 (nuclear factor-κB [NF-κB] signaling). Ranked gene lists were built from the normalized and filtered proteome and transcriptome data using log2 (fold change) as ranking criterion. Enrichments were deemed significant when FDR was <0.25 as suggested by Subramanian et al.38
Variant allele frequency determination in differentiated granulocytes using droplet digital PCR
Differentiated granulocytes were obtained from samples from patients with PV using centrifugation and treatment with 150 mM NH4Cl/10 mM KHCO3/0.1 mM NA2EDTA to remove contaminating erythrocytes. Genomic DNA (gDNA) was extracted using the QIAamp DNA Mini Kit (Qiagen) following the manufacturer’s instructions. Droplet digital polymerase chain reaction (ddPCR) for JAK2-V617F variant allele frequency determination was performed using the BioRad QX200 ddPCR system, the assay dHsaMDV2010061 (BioRad), and the manufacturer’s protocol.
Methylcellulose colony assay
FACS-isolated HSC/MPPs from 4 patients with untreated chronic PV were plated in cytokine-supplemented methylcellulose medium (StemCell Technologies) as described previously39 in the presence or absence of 20 µg/mL recombinant CLU protein (Biolegend), 4 µM NF-κB inhibitor IKK-16 (IKK inhibitor VII, Selleckchem),37 or both CLU and IKK-16. Cells were preincubated with CLU, IKK-16, or both for 30 minutes before FACS isolation and plating. Colony growth was evaluated after 12 days of incubation at 37°C and 5% CO2. Colony types were defined as previously described.9,40
Additional statistical analyses
Statistical significance of protein and RNA expression between HSC/MPPs and CMP/MEPs for CD34, CD38, myeloperoxidase, and transferrin receptor was determined using multiple t tests and the Holm-Sidak method for correction of multiple comparisons. Statistical significance of protein/RNA expression and colony growth in different conditions (patient groups, cell subpopulations, inhibitor treatments) was assessed by 1-way and 2-way analysis of variance (no missing values present) or mixed-effects analyses (missing values present), correcting for multiple comparisons with Tukey’s (1-way) and Dunnett’s (2-way) test. Regression analyses were performed with ordinary least squares estimation, testing for significance of the estimated correlation by assuming an underlying F distribution.
Results
Protein and RNA landscape of hematopoietic stem and progenitor cells in patients with PV
DIA-MS proteomic analysis was performed on HSC/MPPs and CMP/MEPs isolated and purified by FACS from 18 patients with PV and 21 controls (Figure 1A; supplemental Table 1). HSCs and MPPs, or CMPs and MEPs, respectively, were combined for individual patients and controls into HSC/MPPs and CMP/MEPs to reach required cell numbers (25 000 cells) for proteomics. The proteomic dataset was supplemented with RNA-seq data of the same patient and control samples. An average of 4285 proteins and 14 272 RNAs were identified per individual sample (supplemental Figures 1 and 2).
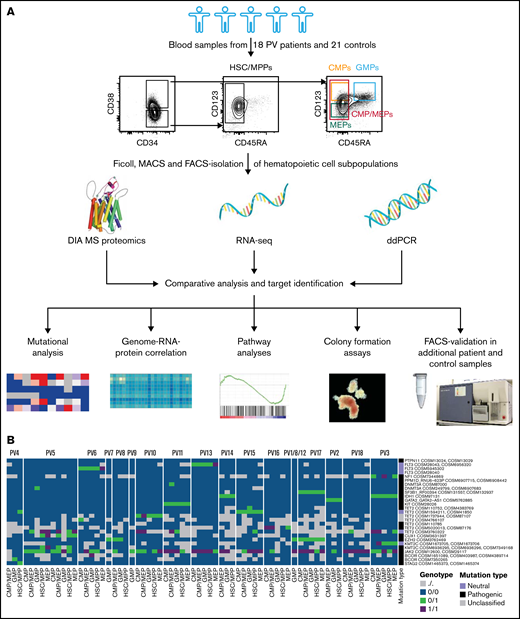
Integrative multi-omics analysis of hematopoietic stem and progenitor cell subpopulations in patients with PV. (A) Study outline. Protein image taken from reference 69 . (B) Mutational analysis based on RNA-seq data in patients with PV showing specific point mutations (rows) identified in the various cell subpopulations of the PV patients tested (columns). Point mutations predicted by functional analysis through hidden Markov models as pathogenic are labeled in black, mutations classified as neutral are labeled in violet, and unclassified mutations are labeled in gray.36 See also supplemental Figure 4. For PV1/8/12, samples from different individuals had to be pooled to guarantee adequate HSC/MPP numbers for downstream MS and RNA-seq measurements.
Integrative multi-omics analysis of hematopoietic stem and progenitor cell subpopulations in patients with PV. (A) Study outline. Protein image taken from reference 69 . (B) Mutational analysis based on RNA-seq data in patients with PV showing specific point mutations (rows) identified in the various cell subpopulations of the PV patients tested (columns). Point mutations predicted by functional analysis through hidden Markov models as pathogenic are labeled in black, mutations classified as neutral are labeled in violet, and unclassified mutations are labeled in gray.36 See also supplemental Figure 4. For PV1/8/12, samples from different individuals had to be pooled to guarantee adequate HSC/MPP numbers for downstream MS and RNA-seq measurements.
To verify proteomic and RNA-seq data quality, we tested expression of surface proteins used to isolate the various HSPC subpopulations and lineage markers with known expression in myeloid progenitors. CD34, CD38, the granulocytic marker myeloperoxidase,42 and the erythroid precursor marker transferrin receptor (aka CD71)43 were detected at expected intensities in specific HSPC subpopulations on the protein and RNA level (supplemental Figure 3).
For better characterization of the study cohort and for insights into clonal evolution of malignant HSPC subpopulations, RNA-seq data in HSC/MPPs, CMP/MEPs, CMPs, MEPs, and GMPs of patients with PV and controls were investigated for genetic mutations. This demonstrated JAK2-V617F mutations in 94% of patients with PV but in no control samples, with allele burdens in PV patients ranging from <10% to close to 100% (Table 1; Figure 1B; supplemental Figure 4). ddPCR results for JAK2-V617F, performed in differentiated granulocytes of the same patients, closely matched the RNA-seq based mutational data with 1 exception: For PV4, no JAK2-V617F mutation was detected in RNA-seq, but ddPCR showed a variant allele frequency of 4% in granulocytes (Table 1; Figure 1B; supplemental Figure 4). This suggests a detection limit > 4% for RNA-seq–based mutational analysis or different allele burdens in HSPCs and differentiated granulocytes in this patient. We next assessed for mutations other than JAK2-V617F. Many of the patients with PV in the chronic phase and all patients with progressed PV carried mutations additional to JAK2-V617F (Table 1; Figure 1B). As described previously,35 additional mutations were found most often in TET2 (50% of PV patients studied). Whereas the allele burden of JAK2-V617F was similar for HSC/MPPs and more committed CMP and MEP subpopulations, other mutations were often observed with higher allele burdens in the more committed progenitor subpopulations, mainly in CMPs and MEPs, compared with HSC/MPPs (supplemental Figure 4).
Mutational analysis in PV patients
| ID | Subgroup | JAK2-V617F allele burden (ddPCR) | Mutational analysis (low burden, medium-high burden; RNA-seq based) |
|---|---|---|---|
| PV1/8/12 | PVchron.UT | JAK2-V617F, EZH2 | |
| PV8 | PVchron.UT | JAK2-V617F, EZH2 | |
| PV16 | PVchron.UT | 43% | JAK2-V617F, TET2 |
| PV13 | PVchron.UT | 78% | JAK2-V617F, FLT3 |
| PV6 | PVchron.UT | 93% | JAK2-V617F, FLT3, TET2, BCOR |
| PV14 | PVchron.UT | 97% | JAK2-V617F, IDH1 |
| PV9 | PVchron.UT | 92% | JAK2-V617F |
| PV4 | PVchron.HU | 4% | TET2, BCOR, STAG2 |
| PV5 | PVchron.UT and PVchron.HU* | 43% | JAK2-V617F, DNMT3A, TET2, CUX1, KMT2C |
| PV3 | PVchron.HU | 95% | JAK2-V617F, NF1, IDH1, TET2, KMT2C |
| PV2 | PVchron.HU | JAK2-V617F, GATA2 | |
| PV7† | PVchron.HU | EZH2 | |
| PV18 | PVprog.UT | 98% | JAK2-V617F, TET2 |
| PV17 | PVprog.UT | JAK2-V617F, SF3B1, EZH2 | |
| PV11 | PVprog.HU | 99% | JAK2-V617F, PPM1D, DNMT3A, KIT, TET2 |
| PV15 | PVprog.HU | JAK2-V617F, TET2 | |
| PV10 | PVprog.HU | JAK2-V617F, FLT3, TET2 |
Specific point mutations identified in the various cell subpopulations of the PV patients tested. Low burden, only seen in one cell subpopulation (given that more than one cell subpopulation was measured) at allele burden less than 40%; medium-high burden, everything that is more than low burden. Mutations occurring at medium-high burden are marked in bold. See also supplemental Figure 4.
Chron, chronic; HU, under treatment with hydroxyurea; prog, progressed; UT, untreated.
Two sets of samples collected.
Not enough material for full mutational analysis.
To gain an overview of the protein and RNA expression landscapes of HSC/MPPs and CMP/MEPs in PV, we applied unsupervised hierarchical clustering and principal component analyses. The proteomic and RNA-seq datasets from patients with PV showed clustering by cell subpopulation (Figure 2A-B) and to a lesser extent by disease stage or treatment (supplemental Figure 5A-B), which was confirmed by principal component and multidimensional scaling analysis (Figure 2C-D). Because buffy coat samples showed signs of RNA decay (supplemental Figures 5C and 6), they were excluded from downstream transcriptomics analyses.
![Protein and RNA landscape of PV stem and progenitor cells. (A) Heatmap (unsupervised complete hierarchical clustering of Euclidean distances) for the 3769 proteins uniquely identified across HSC/MPPs and CMP/MEPs isolated from 18 patients with PV and 21 controls. z-Score log2(I) refers to the z-score of log2 transformed protein intensities. Clustering was observed mainly according to cell type. Within cell subpopulations, patients with progressed PV (marked in green and orange) clustered away from patients with chronic PV (marked in blue and purple), which in turn clustered away from control subjects (marked in red). For graphs with separate clustering analyses in HSC/MPPs and CMP/MEPs, see supplemental Figure 5A-B. (B) Heatmap of the 2000 most variant mRNAs in HSC/MPPs, CMP/MEPs, CMPs, MEPs, and GMPs isolated from patients with PV and controls, confirming clustering mainly according to cell type. Class (patient with PV or control), tx (treatment with HU or untreated [UT]), and progression status (chronic [chron] or progressed [prog]) is marked in color. (C) Corresponding principal component analysis of protein intensities. (D) Multidimensional scaling plot of RNA-seq data. (E) Correlation between protein and RNA expression. Gray lines mark the minimum, maximum, and the first and third quartile, and the green line represents the median. Most correlations were positive, but negative correlations were also observed. See supplemental Figure 7 for representative plots of specific candidates with positive and negative correlations and supplemental Figure 8 for an analysis of protein intensity vs RNA intensity. norm, normalized.](https://ash.silverchair-cdn.com/ash/content_public/journal/bloodadvances/6/11/10.1182_bloodadvances.2021005344/2/m_advancesadv2021005344f2.png?Expires=1767712513&Signature=Ap-m6oNhHdF9c8QPyrDXAPGk7WtXrAffhNxB5nuSAaGIJn5NAZ~mfE3Hge2gOOgeSDITWYjRsUdQZ6iAf2pCPgU-QBdEhYFcUtNphIN1yolNeqd00-AakTdkCtBn2O7uqBJOhC7TckluudrdVu62VwrNTL5Vs845kLvcbrDSssZw~G40PuMx6G-PLzRd87ATlZvi-~c7T9GLKeP0fcE6w17rGS0Qh41He05g1~QLy3xUKyNlM0Kqnx0OTVJbjBavk7-JodJjMjXQvaKwUS9g285d7ngSLhibnfmhA5EIvlsUhGZRCCwjp5Vyfi6cVbMk~8IIZfUF6IlZ1ZU-~0PU1g__&Key-Pair-Id=APKAIE5G5CRDK6RD3PGA)
Protein and RNA landscape of PV stem and progenitor cells. (A) Heatmap (unsupervised complete hierarchical clustering of Euclidean distances) for the 3769 proteins uniquely identified across HSC/MPPs and CMP/MEPs isolated from 18 patients with PV and 21 controls. z-Score log2(I) refers to the z-score of log2 transformed protein intensities. Clustering was observed mainly according to cell type. Within cell subpopulations, patients with progressed PV (marked in green and orange) clustered away from patients with chronic PV (marked in blue and purple), which in turn clustered away from control subjects (marked in red). For graphs with separate clustering analyses in HSC/MPPs and CMP/MEPs, see supplemental Figure 5A-B. (B) Heatmap of the 2000 most variant mRNAs in HSC/MPPs, CMP/MEPs, CMPs, MEPs, and GMPs isolated from patients with PV and controls, confirming clustering mainly according to cell type. Class (patient with PV or control), tx (treatment with HU or untreated [UT]), and progression status (chronic [chron] or progressed [prog]) is marked in color. (C) Corresponding principal component analysis of protein intensities. (D) Multidimensional scaling plot of RNA-seq data. (E) Correlation between protein and RNA expression. Gray lines mark the minimum, maximum, and the first and third quartile, and the green line represents the median. Most correlations were positive, but negative correlations were also observed. See supplemental Figure 7 for representative plots of specific candidates with positive and negative correlations and supplemental Figure 8 for an analysis of protein intensity vs RNA intensity. norm, normalized.
Protein and RNA landscape of PV stem and progenitor cells. (A) Heatmap (unsupervised complete hierarchical clustering of Euclidean distances) for the 3769 proteins uniquely identified across HSC/MPPs and CMP/MEPs isolated from 18 patients with PV and 21 controls. z-Score log2(I) refers to the z-score of log2 transformed protein intensities. Clustering was observed mainly according to cell type. Within cell subpopulations, patients with progressed PV (marked in green and orange) clustered away from patients with chronic PV (marked in blue and purple), which in turn clustered away from control subjects (marked in red). For graphs with separate clustering analyses in HSC/MPPs and CMP/MEPs, see supplemental Figure 5A-B. (B) Heatmap of the 2000 most variant mRNAs in HSC/MPPs, CMP/MEPs, CMPs, MEPs, and GMPs isolated from patients with PV and controls, confirming clustering mainly according to cell type. Class (patient with PV or control), tx (treatment with HU or untreated [UT]), and progression status (chronic [chron] or progressed [prog]) is marked in color. (C) Corresponding principal component analysis of protein intensities. (D) Multidimensional scaling plot of RNA-seq data. (E) Correlation between protein and RNA expression. Gray lines mark the minimum, maximum, and the first and third quartile, and the green line represents the median. Most correlations were positive, but negative correlations were also observed. See supplemental Figure 7 for representative plots of specific candidates with positive and negative correlations and supplemental Figure 8 for an analysis of protein intensity vs RNA intensity. norm, normalized.
A comparison of the proteomic and RNA-seq datasets in corresponding patient and control samples showed positive correlations for 70% and negative correlations for 30% of the proteins with changed expression, with a median correlation coefficient of 0.13 (Figure 2E; supplemental Figure 7). The proportion of genes with protein-RNA expression discrepancies is consistent with previous observations in the hematopoietic field.15 An evaluation of RNA vs protein intensity showed a correlation of 0.38 (supplemental Figure 8). These findings underscore the added information gained by proteomic compared with transcriptomic data.
Discrepant stem cell polarity and metabolic pathway enrichments on the protein and RNA level in PV HSPCs
To characterize the biological pathways perturbed in PV HSPCs on the protein and RNA level and to examine protein-RNA discrepancies in more detail, we performed GSEA for hallmark pathways.44 Most pathways were enriched similarly on the protein and RNA level (Figure 3A). Discrepant pathway regulation on the protein and RNA level in HSC/MPPs of untreated PV patients compared with controls was observed for the stem cell polarity pathway of epithelial-mesenchymal transition45 and the inflammatory response pathway (Figure 3A). Detailed analysis of the epithelial-mesenchymal transition pathway demonstrated differential RNA and protein expression for key pathway members (eg, THBS1) as the basis of such differences (Figure 3B-C). Upon treatment of patients with HU, discrepant pathway regulation was observed for the metabolic pathways of oxidative phosphorylation and fatty acid metabolism with positive enrichments seen at the protein level and negative enrichments observed at the RNA level (Figure 3A). Comparing multipotent HSC/MPPs to committed CMP/MEPs in patients with untreated PV showed discrepant pathway regulation for the epithelial-mesenchymal transition and metabolic pathway glycolysis, with otherwise mainly congruent pathway regulation on the protein and RNA level (Figure 3A).
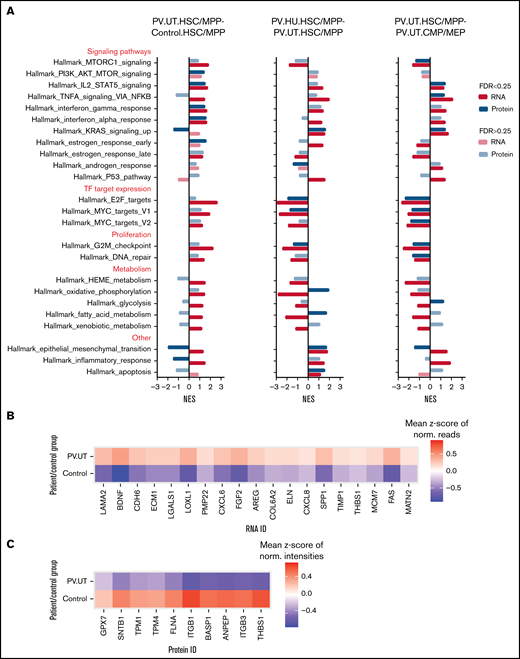
Pathway enrichments in HSC/MPPs and CMP/MEPs of patients with PV and controls on the protein and RNA level. (A) GSEA comparing untreated patients with PV against controls (PV.UT.HSC/MPP vs Control.HSC/MPP) and assessing for the effects of treatment with HU (PV.HU.HSC/MPP vs PV.UT.HSC/MPP) and differentiation (PV.UT.HSC/MPP vs PV.UT.CMP/MEP). Shown are normalized enrichment scores for perturbed gene sets, whereby FDR < 0.25 denotes significantly enriched gene sets (marked by intense colors).38 (B) Heatmap of core-enriched RNAs in HSC/MPPs of patient and control groups for the cell polarity pathway epithelial-mesenchymal transition. (C) Heatmap of core-enriched proteins in HSC/MPPs of patient and control groups for the cell polarity pathway epithelial-mesenchymal transition.
Pathway enrichments in HSC/MPPs and CMP/MEPs of patients with PV and controls on the protein and RNA level. (A) GSEA comparing untreated patients with PV against controls (PV.UT.HSC/MPP vs Control.HSC/MPP) and assessing for the effects of treatment with HU (PV.HU.HSC/MPP vs PV.UT.HSC/MPP) and differentiation (PV.UT.HSC/MPP vs PV.UT.CMP/MEP). Shown are normalized enrichment scores for perturbed gene sets, whereby FDR < 0.25 denotes significantly enriched gene sets (marked by intense colors).38 (B) Heatmap of core-enriched RNAs in HSC/MPPs of patient and control groups for the cell polarity pathway epithelial-mesenchymal transition. (C) Heatmap of core-enriched proteins in HSC/MPPs of patient and control groups for the cell polarity pathway epithelial-mesenchymal transition.
PV HSC/MPPs demonstrated upregulation of mammalian target of rapamycin (MTOR), STAT5, and interferon signaling, upregulated E2F and MYC target expression, and increased proliferation compared with control HSC/MPPs (Figure 3A). HU treatment of patients reversed MTOR signaling, E2F and MYC target expression, and proliferation pathways but not STAT5 signaling in PV HSC/MPPs (Figure 3A). Compared with more differentiated PV CMP/MEPs, PV HSC/MPPs showed upregulation of STAT5, tumor necrosis factor α, and interferon signaling, decreased expression of E2F and MYC targets, and decreased proliferation activities (Figure 3A).
In summary, GSEA for biological pathways in HSPC subpopulations of patients with PV and controls demonstrated discordant protein and RNA enrichment for stem cell polarity and metabolic pathways while showing concordant enrichment for most other pathways.
Hyperproliferative PV stem/progenitor cell signature with reduced CLU protein expression and activated NF-κB signaling and markers for disease progression
To examine the molecular phenotype underlying PV stem and progenitor cell biology in more detail, we investigated differentially regulated individual proteins in HSC/MPPs of untreated PV patients compared with controls. We observed strong downregulation of NF-κB–inhibiting CLU46,47 protein expression in HSC/MPPs of patients with untreated PV (Figure 4A-B; supplemental Figure 9). Megakaryocytic lineage proteins such as pro-platelet basic protein (PPBP), CXCL4/platelet factor 4 (CXCL4/PF4), and integrin α-2b (ITGA2B) were also downregulated in HSC/MPPs of patients with untreated PV (Figure 4A),48 whereas LGALS9 (aka galectin 9)49 and suppressor of cytokine signaling 2 (SOCS2), a STAT-induced STAT inhibitor,50 were upregulated particularly in patients with progressed PV (Figure 4B; supplemental Figure 9). Intracellular flow cytometry confirmed downregulation of CLU protein in the HSC/MPP subpopulation of patients with untreated chronic phase PV compared with HSC/MPPs of age- and sex-matched controls (Figure 4C-E). For LGALS9, flow cytometry validated upregulation in patients with progressed PV while showing unchanged expression in patients with chronic phase PV (Figure 4D-E). For SOCS2, upregulation in patients with progressed PV in the proteomic analysis was reinforced by RNA-seq analysis (Figure 4F). These data suggest that LGALS9 and SOCS2 may serve as markers for disease progression in PV. Treatment with HU abrogated the downregulation of CLU but had no effect on progression markers (Figure 4B). By applying stringent cutoffs (P < .01 and fold change > 2), a PV stem/progenitor cell protein signature was derived (Figure 5A).
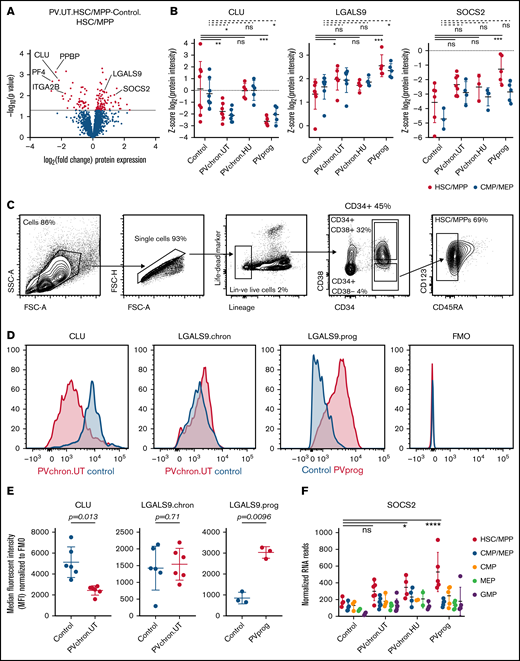
Differentially regulated protein markers in HSC/MPPs of patients with PV and controls. (A) Volcano plot of protein intensity fold changes and P values comparing HSC/MPPs of patients with untreated PV (PV.UT.HSC/MPP) against controls (Control.HSC/MPP). (B) Normalized protein intensities for CLU, LGALS9, and SOCS2 in the subgroups of controls, patients with chronic PV without cytoreductive therapy (PVchron.UT), patients with chronic PV with HU therapy (PVchron.HU), and patients with progressed PV (PVprog). Error bars represent standard deviations. *Adjusted P < .05; **adjusted P < .01; ***adjusted P < .001. Peptide profiles for CLU, LGALS9, and SOCS2 are provided in supplemental Figure 9. (C) FACS strategy. (D) Representative FACS plots for CLU and LGALS9 in a patient with chronic PV without cytoreductive treatment (PVchron.UT), a patient with progressed PV (PVprog), and age- and sex-matched controls. FMO, fluorescence minus 1 reference. (E) Graphical summary of intracellular FACS staining experiments for CLU and LGALS9 in 6 patients with untreated chronic PV, 3 patients with progressed PV, and age- and sex-matched controls. Error bars represent standard deviations. (F) Normalized RNA reads for SOCS2 in the subgroups of controls, patients with chronic PV without cytoreductive therapy (PVchron.UT), patients with chronic PV with HU therapy (PVchron.HU), and patients with progressed PV (PVprog). Error bars represent standard deviations. *Adjusted P < .05; ****adjusted P < .0001.
Differentially regulated protein markers in HSC/MPPs of patients with PV and controls. (A) Volcano plot of protein intensity fold changes and P values comparing HSC/MPPs of patients with untreated PV (PV.UT.HSC/MPP) against controls (Control.HSC/MPP). (B) Normalized protein intensities for CLU, LGALS9, and SOCS2 in the subgroups of controls, patients with chronic PV without cytoreductive therapy (PVchron.UT), patients with chronic PV with HU therapy (PVchron.HU), and patients with progressed PV (PVprog). Error bars represent standard deviations. *Adjusted P < .05; **adjusted P < .01; ***adjusted P < .001. Peptide profiles for CLU, LGALS9, and SOCS2 are provided in supplemental Figure 9. (C) FACS strategy. (D) Representative FACS plots for CLU and LGALS9 in a patient with chronic PV without cytoreductive treatment (PVchron.UT), a patient with progressed PV (PVprog), and age- and sex-matched controls. FMO, fluorescence minus 1 reference. (E) Graphical summary of intracellular FACS staining experiments for CLU and LGALS9 in 6 patients with untreated chronic PV, 3 patients with progressed PV, and age- and sex-matched controls. Error bars represent standard deviations. (F) Normalized RNA reads for SOCS2 in the subgroups of controls, patients with chronic PV without cytoreductive therapy (PVchron.UT), patients with chronic PV with HU therapy (PVchron.HU), and patients with progressed PV (PVprog). Error bars represent standard deviations. *Adjusted P < .05; ****adjusted P < .0001.
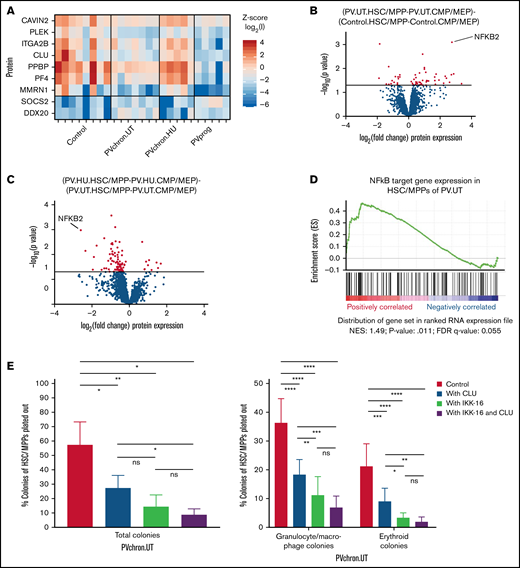
Roles of CLU and the NF-κB pathway for HSC/MPPs of patients with untreated PV. (A) PV stem/progenitor cell protein signature. (B) Volcano plot of protein intensity fold changes and P values comparing HSC/MPP-specific findings of patients with untreated PV (PV.UT.HSC/MPP vs PV.UT.CMP/MEP) against HSC/MPP-specific findings of controls (Control.HSC/MPP vs Control.CMP/MEP), and (C) HSC/MPP-specific findings of PV patients with HU therapy (PV.HU.HSC/MPP vs PV.HU.CMP/MEP) against HSC/MPP-specific findings of patients with untreated PV (PV.UT.HSC/MPP vs PV.UT.CMP/MEP). (D) GSEA plot for NF-κB signaling in HSC/MPPs of patients with untreated PV compared with controls (PV.UT.HSC/MPP vs Control.HSC/MPP). The normalized enrichment score and significance values are provided. (E) Methylcellulose colony assay: Colony growth from FACS-isolated HSC/MPPs of patients with untreated chronic PV (PVchron.UT) was evaluated in the presence or absence of CLU, IKK-16, or their combination. Percentages of colonies relative to the total cell numbers plated are plotted. Error bars represent standard deviations. One-way (total colonies) and 2-way (granulocyte/macrophage and erythroid colonies) analysis of variance testing was applied using Tukey (1-way) and Dunnett (2-way) correction for multiple testing. *Adjusted P < .05; **adjusted P < .01; ***adjusted P < .001; ****adjusted P < .0001.
Roles of CLU and the NF-κB pathway for HSC/MPPs of patients with untreated PV. (A) PV stem/progenitor cell protein signature. (B) Volcano plot of protein intensity fold changes and P values comparing HSC/MPP-specific findings of patients with untreated PV (PV.UT.HSC/MPP vs PV.UT.CMP/MEP) against HSC/MPP-specific findings of controls (Control.HSC/MPP vs Control.CMP/MEP), and (C) HSC/MPP-specific findings of PV patients with HU therapy (PV.HU.HSC/MPP vs PV.HU.CMP/MEP) against HSC/MPP-specific findings of patients with untreated PV (PV.UT.HSC/MPP vs PV.UT.CMP/MEP). (D) GSEA plot for NF-κB signaling in HSC/MPPs of patients with untreated PV compared with controls (PV.UT.HSC/MPP vs Control.HSC/MPP). The normalized enrichment score and significance values are provided. (E) Methylcellulose colony assay: Colony growth from FACS-isolated HSC/MPPs of patients with untreated chronic PV (PVchron.UT) was evaluated in the presence or absence of CLU, IKK-16, or their combination. Percentages of colonies relative to the total cell numbers plated are plotted. Error bars represent standard deviations. One-way (total colonies) and 2-way (granulocyte/macrophage and erythroid colonies) analysis of variance testing was applied using Tukey (1-way) and Dunnett (2-way) correction for multiple testing. *Adjusted P < .05; **adjusted P < .01; ***adjusted P < .001; ****adjusted P < .0001.
To test for potential key molecular switches distinct for PV stem and multipotent progenitor cells, as opposed to committed myeloid progenitors, we next focused our investigations on HSC/MPP-specific findings. Subtracting the comparison of HSC/MPPs vs CMP/MEPs in controls from the same comparison in patients with untreated PV returned NF-κB2 as the most significantly upregulated protein specifically in HSC/MPPs of patients with untreated PV (Figure 5B). The corresponding analysis for HSC/MPP-specific findings in PV patients treated with HU and compared with untreated PV patients showed a downregulation of the previously upregulated NF-κB2 protein (Figure 5C). These findings were supported by GSEA, confirming that NF-κB signaling is activated in HSC/MPPs of patients with untreated PV (Figure 5D).
CLU and the NF-κB inhibitor IKK-16 inhibit colony formation of HSC/MPPs isolated from patients with untreated chronic phase PV
To assess the functional relevance of downregulation of CLU and activation of NF-κB signaling in PV HSC/MPPs and to examine its causal link to HSC/MPP proliferation and differentiation in PV, we cultured HSC/MPPs of patients with untreated chronic PV in the presence or absence of CLU, the NF-κB inhibitor IKK-16, and a combination of both. We observed 52%, 74%, and 84% inhibition of total colony formation, respectively, on treatment with CLU, IKK-16, and a combination of both for FACS-isolated HSC/MPPs from patients with untreated chronic PV (Figure 5E). Interestingly, the combination of CLU and IKK-16 showed no significant additional inhibitory effect compared with IKK-16 alone. This is consistent with the antiproliferative effect of CLU being mediated through downregulation of NF-κB signaling in HSC/MPPs of patients with untreated PV. CLU, IKK-16, and their combination inhibited granulocyte/macrophage colony formation from PV HSC/MPPs by 49%, 69%, and 80%, respectively. Erythroid colony formation was reduced by 57%, 83%, and 90%, respectively (Figure 5E). These results demonstrate that downregulation of CLU and activation of NF-κB signaling is linked to HSC/MPP proliferation and differentiation in PV.
Discussion
In this study, we investigated the proteomic landscape of PV stem and progenitor cells using a recently developed highly sensitive DIA-MS technology for rare human HSPC subpopulations.15 Proteomic data of HSC/MPPs and more committed CMP/MEPs from patients with untreated PV, patients with PV treated with HU, and controls were integrated with clinical, genomic, transcriptomic, flow cytometry, and in vitro colony formation data. We identified a hyperproliferative PV stem/progenitor cell signature with reduced CLU protein expression and activated NF-κB signaling in patients with untreated PV. Furthermore, LGALS9 and SOCS2 were identified as potential markers for disease progression. Treatment of patients with HU reversed both downregulation of CLU and upregulation of NF-κB2 but had no effects on LGALS9 or SOCS2 expression.
Discrepancies in protein and RNA expression were observed for 30% of expressed genes (Figure 2E and Amon et al15 ). Indeed, the main findings of downregulated CLU, megakaryocytic lineage proteins, and upregulated LGALS9 demonstrated significant perturbations on the protein, but not on the RNA level. Furthermore, the stem cell polarity pathway of the epithelial-mesenchymal transition and metabolic pathway enrichments were discrepantly regulated on the protein and RNA level. Possible reasons for discrepantly perturbed protein and RNA data include differences in coverage and thus statistical power between proteomic and transcriptomic analyses, as well as differential rates and temporal delays of protein synthesis and degradation,51-57 posttranslational mechanisms such as ubiquitination,58 protein abundance buffering (the phenomenon of variations in RNA abundance being reduced [buffered] at the level of protein abundance),51,59-61 and stabilization and upregulation of proteins within protein complexes.51,61,62 CLU and LGALS9 both act within protein complexes,63 which can explain mRNA-protein abundance discrepancies, at least in part.51,61 Whereas RNA-seq was more complete and allowed for detection of mutations, the proteomic dataset was closer to cell functions and better suited to describe cellular states.
Among individual proteins, we identified downregulation of CLU as an important differentially regulated factor in PV HSC/MPPs. Its inhibition of colony formation in vitro indicates that CLU has antiproliferative effects on PV HSC/MPPs. CLU is a well-described inhibitor of NF-κB signaling.46,47 To test whether the antiproliferative effect of CLU is consistent with inhibition of NF-κB signaling, we tested the effect of the NF-κB inhibitor IKK-16 on the colony formation capacity of PV HSC/MPPs. Indeed, we found a colony formation–inhibiting effect for IKK-16 in HSC/MPPs of PV (Figure 5E). Previous studies have shown a colony formation–inhibiting effect of IKK-16 in healthy HSPCs of the bone marrow.37 Taken together, this suggests that NF-κB signaling affects proliferation and differentiation of hematopoietic stem/progenitor cells in PV and healthy individuals. The observed activation of NF-κB signaling in PV HSC/MPPs relative to healthy control HSC/MPPs conforms with hyperproliferation in PV and extends previous reports on the role of NF-κB signaling in myelofibrosis to patients with nonfibrotic PV.37,64,65 Combined treatment of PV HSC/MPPs with CLU and IKK-16 did not lead to significant further inhibition of colony formation compared with IKK-16 alone (Figure 5E). This is consistent with CLU exerting its antiproliferative effect through inhibition of NF-κB. Our study thus supports a mechanistic model in which downregulation of CLU contributes to the myeloid hyperproliferation seen in PV by activating NF-κB signaling. Future studies are warranted to delineate the structural and temporal aspects of CLU-mediated NF-κB modulation in PV.
Malignant transformations rarely rely on a single event, and indeed, in addition to reduced CLU expression and activation of NF-κB signaling, we also observed downregulation of megakaryocytic lineage proteins such as CXCL4/PF4, with associated loss of stem cell quiescence.48 In contrast to CLU, CXCL4/PF4 exerts its antiproliferative effects through activation of stem cell quiescence-inducing transforming growth factor β (TGFβ) signaling.48,66,67 Hence, both proteins affect the proliferation and differentiation process of PV HSC/MPPs through distinct signaling pathways. The normalization of both CLU-NF-κB2 and CXCL4/PF4-TGFβ, on treatment of PV patients with HU, supports their involvement in the hyperproliferative phenotype of PV HSC/MPPs. It remains to be shown which factors and associated pathways, CXCL4/PF4-TGFβ or CLU-NF-κB, gain predominance in specific patient populations and under different treatment conditions. Promising results of combined JAK/STAT and NF-κB inhibitors in murine models64,65 led to clinical trials based on dual targeting of JAK/STAT and NF-κB for the treatment of myelofibrosis.65,68 A similar role for additional agents targeting the CXCL4/PF4-TGFβ or CLU-NF-κB axes may arise in patients with high-risk PV, whose disease is not adequately controlled by current approaches.
Upon disease progression of PV to post-PV myelofibrosis and post-PV acute myeloid leukemia, we observed upregulation of LGALS9 and SOCS2 in HSC/MPPs. LGALS9 was previously described as a marker for leukemic stem cells.49 SOCS2 was reported to be upregulated on progression of chronic myeloid leukemia,50 an MPN driven by the BCR-ABL1 translocation. Our findings in patients with progressed PV suggest that LGALS9 and SOCS2 may serve as markers for disease progression in PV. Follow-up studies with higher numbers of patients with progressed PV are required to validate these findings.
In conclusion, applying a recently developed highly sensitive DIA-MS technology to stem and progenitor cell samples from patients with PV, we detected protein-specific pathway enrichment in PV HSC/MPPs, including the stem cell polarity pathway of the epithelial-mesenchymal transition. We further identified reduced CLU protein expression and associated activation of NF-κB signaling in the HSC/MPP subpopulation of patients with untreated PV as a potential driver of myeloid hyperproliferation in PV. Upon progression of PV, we observed upregulation of the protein markers LGALS9 and SOCS2. Our study demonstrates the applicability of the newly developed highly sensitive DIA-MS technology in the characterization of clinically relevant and rare disease subpopulations. It adds a new protein layer to the molecular portrayal of PV stem and progenitor cells, identifies new protein factors important for PV biology, and provides potential new therapeutic targets.
Acknowledgments
The authors thank Tatjana Sajic, Junyan Lu, and Thorsten Zenz for bioinformatic advice; the hematologic diagnostic team of the University Hospital Zurich for the ddPCR analyses; and Patrizia Belleda, Asuka Fry, Ludovic Gillet, Sabine Amon, and the FACS facilities of the ETH Zurich and the University of Zurich for assistance with patient sample processing, proteomic measurements, and FACS sorting.
This research was funded by grants to F.M.-A. from Personalized Health and Related Technologies (PHRT), ETH Zurich, Filling-the-Gap (University of Zurich), Promedica, and Krebsliga Zurich. Work was also supported by the Swiss National Science Foundation (grant 3100A0-688 107679) to R.A. A.P.A.T. is supported by the Professor Dr. Max Cloëtta Foundation.
Authorship
Contribution: F.M.-A., M.G.M., R.A., and A.P.A.T. conceived of the study; F.M.-A., W.E.W., S.K., M.C.H., and G.T. performed experiments and analyzed data; and F.M.-A. wrote the manuscript.
Conflict-of-interest disclosure: R.A. keeps shares of Biognosys AG that operates in the proteomics field. The remaining authors declare no competing financial interests.
Correspondence: Fabienne Meier-Abt, Department of Medical Oncology and Hematology, University Hospital Zurich, Raemistrasse 100, 8091 Zurich, Switzerland; e-mail: fabienne.meier-abt@usz.ch; Institute of Medical Genetics, University of Zurich, Wagistrasse 12, 8952 Schlieren, Switzerland; e-mail: fabienne.meier-abt@medgen.uzh.ch.

