

Key Points
Cell-free DNA mirrors the molecular profile of bone marrow cells in MDS.
The analysis of cfDNA is a promising method to characterize and monitor molecular and cytogenetic abnormalities present in MDS.

Abstract
Molecular and cytogenetic studies are essential for diagnosis and prognosis in patients with myelodysplastic syndromes (MDSs). Cell-free DNA (cfDNA) analysis has been reported to be a reliable noninvasive approach for detecting molecular abnormalities in MDS; however, there is limited information about cytogenetic alterations and monitoring in cfDNA. We assessed the molecular and cytogenetic profile of a cohort of 70 patients with MDS by next-generation sequencing (NGS) of cfDNA and compared the results to sequencing of paired bone marrow (BM) DNA. Sequencing of BM DNA and cfDNA showed a comparable mutational profile (92.1% concordance), and variant allele frequencies (VAFs) strongly correlated between both sample types. Of note, SF3B1 mutations were detected with significantly higher VAFs in cfDNA than in BM DNA. NGS and microarrays were highly concordant in detecting chromosomal alterations although with lower sensitivity than karyotype and fluorescence in situ hybridization. Nevertheless, all cytogenetic aberrations detected by NGS in BM DNA were also detected in cfDNA. In addition, we monitored molecular and cytogenetic alterations and observed an excellent correlation between the VAFs of mutations in BM DNA and cfDNA across multiple matched time points. A decrease in the cfDNA VAFs was detected in patients responding to therapy, but not in nonresponding patients. Of note, cfDNA analysis also showed cytogenetic evolution in 2 nonresponsive cases. In summary, although further studies with larger cohorts are needed, our results support the analysis of cfDNA as a promising strategy for performing molecular characterization, detection of chromosomal aberrations and monitoring of patients with MDS.
Introduction
Myelodysplastic syndromes (MDSs) are hematopoietic stem cell disorders characterized by dysplasia and ineffective hematopoiesis driven by somatically acquired genomic alterations. Molecular studies and conventional cytogenetics are essential in MDS for establishing a correct diagnosis and setting up accurate risk stratification.1 Routinely, these analyses are performed in bone marrow (BM) samples (in particular, cytogenetic analyses), as it is difficult to obtain metaphases from peripheral blood (PB) samples.2
In recent years, it has been demonstrated that molecular profiling can be performed robustly using cell-free DNA (cfDNA) analysis in solid tumors and lymphomas. cfDNA molecules are short DNA fragments present in plasma samples that are mainly released by immature hematopoietic and bone marrow (BM) cells.3-6 As MDSs are characterized by an excessive apoptosis in BM,7,8 so an increased release of cfDNA into plasma is expected in these patients. Indeed, several groups have reported that it is possible to identify the genetic alterations in MDS by analyzing cfDNA.9-12
However, there is limited information regarding the detection of cytogenetic alterations in patients with MDS by cfDNA analysis. To this end, we have designed a targeted gene panel to detect in a single test both molecular and cytogenetic alterations by next-generation sequencing (NGS) and have investigated its potential use with cfDNA in comparison with BM samples in a cohort of patients with MDS.
Patients and methods
Patients
BM aspirates and PB samples were prospectively collected from 70 patients with newly diagnosed MDS or patients who received only erythropoietin with the following diagnoses: MDS with single-lineage dysplasia (SLD; n = 1), MDS with multilineage dysplasia (MLD; n = 35), MDS with ring sideroblasts (RS)-SLD (n = 5), MDS-RS-MLD (n = 17), MDS with isolated del(5q) (n = 2), MDS with excess blasts (EB)-1 (n = 6), MDS-EB-2 (n = 2), and MDS-unclassifiable (MDS-U; n = 2; Table 1). The revised International Prognostic Scoring System (IPSS-R) score was calculated for each patient.13 We analyzed PB samples from an additional 21 healthy control subjects and 18 patients with acute myeloid leukemia (AML; supplemental Table 1). The study was approved by the Parc de Salut Mar Clinical Research Ethics Committee (CEIm, 2016/6768/I) and was conducted according to the biomedical research guidelines of the Declaration of Helsinki.
Clinical and biological features of study patients
| Characteristic | MDS N = 70 |
|---|---|
| Age, median (range), y | 81 (54-94) |
| Male, n (%) | 51 (72.9) |
| Female, n (%) | 19 (27.1) |
| Hemoglobin, median (range), g/dL | 11.75 (7.6-17.8) |
| WBC count, median (range), ×109/L | 4.58 (1.44-12.28) |
| Neutrophil count, median (range), ×109/L | 2.41 (0.31-7.68) |
| Platelet count, median (range), ×109/L | 154 (28-584) |
| Presence PB blasts, n (%) | 2 (2.86) |
| LDH, median (range) | 292 (111-487) |
| BM blasts %, median (range) | 2 (0-19) |
| RSs %, median (range) | 0 (0-90) |
| Altered karyotype, n (%) | 20 (28.6) |
| Very good cytogenetic IPSS-R risk group, n (%) | 6 (8.6) |
| Good cytogenetic IPSS-R risk group, n (%) | 7 (10) |
| Intermediate cytogenetic IPSS-R risk group, n (%) | 4 (5.7) |
| Poor cytogenetic IPSS-R risk group, n (%) | 2 (2.9) |
| Very poor cytogenetic IPSS-R risk group, n (%) | 1 (1.4) |
| IPSS-R risk group | |
| Very low, n (%) | 28 (40) |
| Low, n (%) | 31 (44.3) |
| Intermediate, n (%) | 7 (10) |
| High, n (%) | 2 (2.9) |
| Very high, n (%) | 2 (2.9) |
| MDS subtype (WHO 2017) | |
| MDS-SLD, n (%) | 1 (1.4) |
| MDS-MLD, n (%) | 35 (50) |
| MDS-RS-SLD, n (%) | 5 (7.1) |
| MDS-RS-MLD, n (%) | 17 (24.3) |
| MDS-del(5q), n (%) | 2 (2.9) |
| MDS-EB-1, n (%) | 6 (8.6) |
| MDS-EB-2, n (%) | 2 (2.9) |
| MDS-U, n (%) | 2 (2.9) |
| Number of patients with mutations, n (%) | 66 (94.3) |
| Mutations per patient, median (range) | 3 (0-10) |
| Mutated genes per patient, median (range) | 2 (0-6) |
| cfDNA concentration, median (range), ng/plasma mL | 58.4 (10.6-91.4) |
EB, excess blasts; LDH, lactate dehydrogenase; MLD, multilineage dysplasia; SLD, single lineage dysplasia; U, unclassifiable; WBC, white blood cells; WHO, World Health Organization.
PB and BM processing and DNA isolation
BM aspirates were collected, and BM DNA was extracted with MagAttract DNA Blood Mini M48 Kit (Qiagen, Hilden, Germany). PB samples were collected in K3EDTA tubes and processed in the first 4 hours to isolate plasma (supplemental Figure 1). cfDNA was isolated automatically by using QIAsymphony SP (QIAsymphony DSP Virus/Pathogen Kit; Qiagen) and quantified with Qubit 3.0 (Thermo Fisher Scientific, Eugene, OR). The purity of the cfDNA was assessed by electrophoresis (4200 TapeStation system; Agilent, Santa Clara, CA) to discount the presence of genomic DNA. All the cfDNA samples analyzed in this project were free of genomic DNA contamination.
NGS
Genomic characterization was performed in paired samples of BM DNA and cfDNA by NGS in all patients. Libraries were prepared by using a custom panel that included 48 myeloid-associated genes (ASXL1, ATM, BCOR, BCORL1, CALR, CBL, CEBPA, CHEK2, CSF3R, CSNK1A1, CUX1, DDX41, DLEU7, DNMT3A, EGR1, ETV6, EZH2, FLT3, GATA2, IDH1, IDH2, JAK2, KIT, KMT2A, KRAS, MPL, NF1, NPM1, NRAS, PHF6, PPM1D, PRPF8, PTPN11, RAD21, RUNX1, SETBP1, SF3B1, SH2B3, SRSF2, STAG2, TET2, TNFSF11, TP53, TP53RK, TP53TG5, U2AF1, WT1, and ZRSR2) and genomic regions localized at the most frequently altered chromosomes in MDS (QIAseq Custom DNA Panels; Qiagen). Genomic regions included in the NGS panel are included in supplemental Table 2. Unique molecular identifiers were incorporated before targeted amplification, to tag individual DNA molecules. Libraries were sequenced with a 3000× minimum read depth in MiSeq/NextSeq (Illumina, San Diego, CA).
The GeneGlobe Data Analysis Center (Qiagen) was used for FASTQ trimming, alignment, and variant calling (smCounter2).14 Variants were annotated and classified by Illumina VariantStudio 3.0 software and were visualized with Integrative Genomics Viewer (IGV) v2.11 software. Only pathogenic and likely pathogenic variants with a variant allele frequency (VAF) >2% were considered.
Copy number variant analysis was performed by NGS to detect cytogenetic alterations in both cfDNA and BM DNA. Samples from healthy individuals (n = 2-4) were included in all sequencing runs and used as coverage controls. Gene coverage was compared with each sample by GeneGlobe Data Analysis Center, to identify regions affected by copy number variants, where the normalized coverage is significantly different from the controls.15
Chromosomal microarrays
Cytoscan 750K Cytogenetic Solution (Thermo Fisher Scientific) was used to obtain a genetic gain, loss, and regions of homozygosity profile according to the manufacturer’s recommendations. This chip consists of more than 750 000 markers for copy number analysis with 550 000 unique nonpolymorphic probes and ∼200 000 SNPs that fully genotype with greater than 99% accuracy. Chromosome Analysis Suite v.4.1 (ChAS) software (Thermo Fisher Scientific) and the hg38 genome version (NA36 annotations) was used to analyze the results. Gains with a minimum of 25 altered markers in a 150-kb region, losses with at least 35 altered markers in a 75-kb region, and regions with telomeric copy neutral loss of heterozygosity (CN-LOH) greater than 10 Mb or affecting relevant genes have been collected.
Fluorescence in situ hybridization analyses
Fluorescence in situ hybridization (FISH) was performed according to the standard methods used in our laboratory.16 FISH was performed on BM cells from cytogenetic cultures using the following probes: Vysis CEP8, Vysis EGFR1 FISH probe kit (Abbott Molecular, Abbott Park, IL), and XL 20q12/20qter (Metasystems, Altlussheim, Germany).
Statistical analysis
IBM SPSS software was used for statistical analysis. For categorical data, comparisons of proportions were evaluated by χ2 test or Fisher’s exact test as appropriate. For continuous variables, comparisons were assessed by nonparametric Mann-Whitney or Wilcoxon test when appropriate. We assessed the Spearman’s rank correlation coefficient to evaluate the strength of association between 2 variables. P < .05 was considered statistically significant. Coverage metrics were obtained from the DeCovA library.17 Variant analysis was performed in R version 3.6.2 using the Maftools package.18 The code used in R 3.6.2 to create the figures is displayed in supplemental Methods, and the files necessary to generate the figures and full list of variants identified are shown in supplemental Data 1 to 3.
Results
The amount of cell-free DNA in plasma is higher in patients with MDS than in controls
A total of 70 plasma samples from patients with MDS at diagnosis or in the absence of any therapy were analyzed. The clinical and biological features of patients are shown in Table 1. The amount of total cfDNA obtained in patients with MDS (median, 58.4 ng/mL) was significantly higher than that obtained from healthy controls (median, 32.4 ng/mL; P = .023, Mann-Whitney) (Figure 1). No significant differences were observed in cfDNA concentration among patients with MDS when comparing by disease subtype or by risk category according to the IPSS-R. Nevertheless, even lower risk patients with MDS had a significantly higher cfDNA concentration than the healthy control group (P = .023). On the contrary, a significantly lower cfDNA concentration was observed in the MDS group than that in the cohort of patients with AML (P = .017).
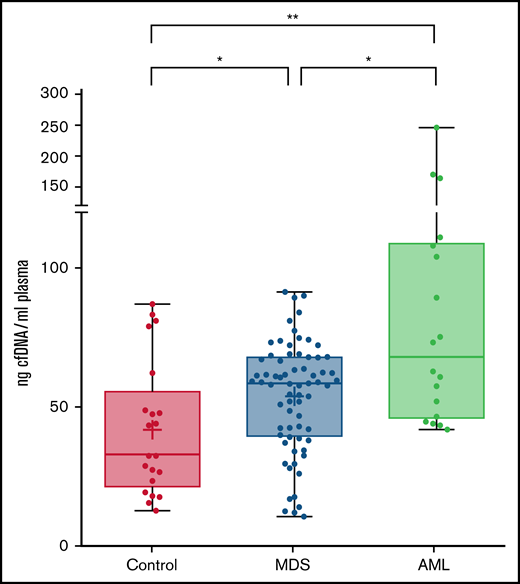
cfDNA concentration in healthy controls, MDS patients and AML patients. Levels are shown (ng cfDNA/mL plasma) in plasma samples from healthy controls and patients with MDS or AML. *P ≤ .05; **P ≤ .01.
cfDNA concentration in healthy controls, MDS patients and AML patients. Levels are shown (ng cfDNA/mL plasma) in plasma samples from healthy controls and patients with MDS or AML. *P ≤ .05; **P ≤ .01.
We analyzed the correlation of the concentration of cfDNA with clinical and biological characteristics. A positive correlation was observed between the amount of cfDNA and the serum lactate dehydrogenase levels (P = .027; rs = 0.273). No statistically significant association was observed with hematological parameters (hemoglobin, leukocytes, monocytes, platelets, or blast percentage).
cfDNA and BM DNA show an equivalent mutational profile
Mutational profiling of BM DNA and cfDNA showed comparable results: 187 mutations were detected in BM DNA and cfDNA, with a 92.1% concordance (Figure 2). The most frequently mutated genes were TET2 (45.7%), SF3B1 (37.1%), ASXL1 (21.4%), DNMT3A (20.0%), SRSF2 (15.7%), ZRSR2 (11.4%), and U2AF1 (11.4%). A strong correlation was observed between the VAFs of BM and cfDNA (rs = 0.797; P < .001, Spearman; Figure 3). There were 16 discordant mutations: 8 were detected only in cfDNA, and 8 were detected only in BM (Figure 4A). These discordant mutations presented a lower VAF (median 5.60%; range, 2.5% to 25.53%) when compared with the VAF observed in the whole cohort (median 28.27%; range 0.74% to 98.28%; P < .001; Figure 4B). These cases showed that the correlation between BM DNA and cfDNA mutations may decrease when studying low-incidence subclones.
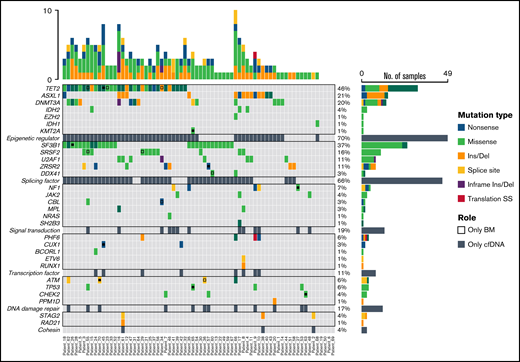
Distribution of mutations identified in BM DNA and cfDNA in 70 patients with MDS. Results of the sequencing are shown in the plot, where each column represents a patient and each row represents a gene. The number of mutations identified per patient is represented as columns above the top row. Genes are grouped by function and are in order from the most to the least frequently mutated. Frequencies for each gene are displayed at the right, as well as the mutation type (nonsense, missense, insertion/deletion, splice site or translation start site). Discordant mutations are represented with a square, as shown in the legend: filled squares show mutations only identified in cfDNA and unfilled squares show mutations only identified in BM DNA. Del, deletion; Ins, insertion; SS, start site.
Distribution of mutations identified in BM DNA and cfDNA in 70 patients with MDS. Results of the sequencing are shown in the plot, where each column represents a patient and each row represents a gene. The number of mutations identified per patient is represented as columns above the top row. Genes are grouped by function and are in order from the most to the least frequently mutated. Frequencies for each gene are displayed at the right, as well as the mutation type (nonsense, missense, insertion/deletion, splice site or translation start site). Discordant mutations are represented with a square, as shown in the legend: filled squares show mutations only identified in cfDNA and unfilled squares show mutations only identified in BM DNA. Del, deletion; Ins, insertion; SS, start site.
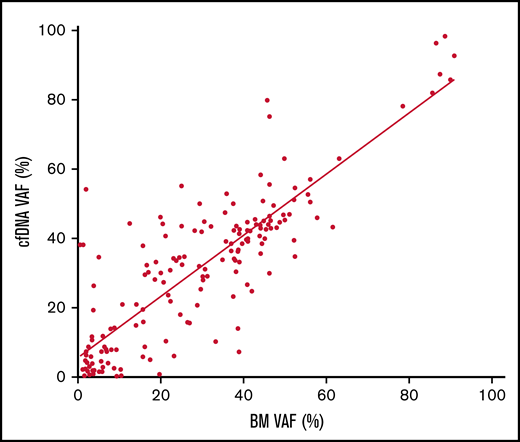
Correlation of the VAF in cfDNA and BM DNA. Scatter plot of the 187 variants detected in cfDNA and BM DNA showing the correlation between the variant allele frequency (VAF) (rs = 0.797, P < .001, Spearman).
Correlation of the VAF in cfDNA and BM DNA. Scatter plot of the 187 variants detected in cfDNA and BM DNA showing the correlation between the variant allele frequency (VAF) (rs = 0.797, P < .001, Spearman).
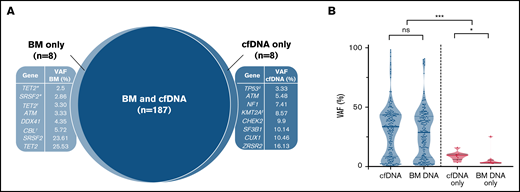
Discordant mutations in BM DNA and cfDNA. (A) Discordant mutations identified in BM DNA and cfDNA. ‡Patient presented 2 mutations detected only in cfDNA; *,†2 patients showing 2 mutations detected only in BM. The 10 remaining discordant alterations were identified in 10 different patients. (B) VAFs identified in concordant (blue) and discordant (pink) mutations in BM DNA and cfDNA. *P ≤ .05; ***P ≤ .001; ns, not significant.
Discordant mutations in BM DNA and cfDNA. (A) Discordant mutations identified in BM DNA and cfDNA. ‡Patient presented 2 mutations detected only in cfDNA; *,†2 patients showing 2 mutations detected only in BM. The 10 remaining discordant alterations were identified in 10 different patients. (B) VAFs identified in concordant (blue) and discordant (pink) mutations in BM DNA and cfDNA. *P ≤ .05; ***P ≤ .001; ns, not significant.
SF3B1 mutations present a higher VAF in cfDNA than in BM DNA
We compared the VAF of the detected mutations in cfDNA and BM DNA grouped by gene and observed that VAFs of SF3B1 mutations were significantly higher in cfDNA than in BM DNA (P = .016, Wilcoxon; Figure 5A). No significant differences were observed in the concentration of total cfDNA between the SF3B1 mutated and the patient with the SF3B1 wild-type gene. Mutations in exon 15 of SF3B1 (K700E; NP_036565.2: p.(Lys700Glu) in all cases) presented a tendency toward a higher VAF cfDNA/BM ratio than mutations in other SF3B1 exons (median ratio, 1.82 vs 1.09; P = .08; Figure 5B). In this context, we assessed the representation of SF3B1 exons in cfDNA, as it has been reported that nucleosome distribution affects DNA fragmentation, and as a consequence, some genomic regions are overrepresented in cfDNA.5 We compared the depth of coverage obtained for the exons, and we observed a higher representation of SF3B1 exon 15 in cfDNA libraries than in BM libraries (Figure 5C). This finding was not observed in other SF3B1 exons, which suggests that exon 15 is better represented in cfDNA from patients with MDS, thus producing a higher VAF in cfDNA of the SF3B1 K700E mutation. In line with previous studies, we observed that the percentage of RSs in BM correlated with the VAF of SF3B1 mutations, in both BM DNA and cfDNA (rs = 0.684, P < .001 in BM DNA and rs = 0.602, P = .002 in cfDNA; supplemental Figure 2).
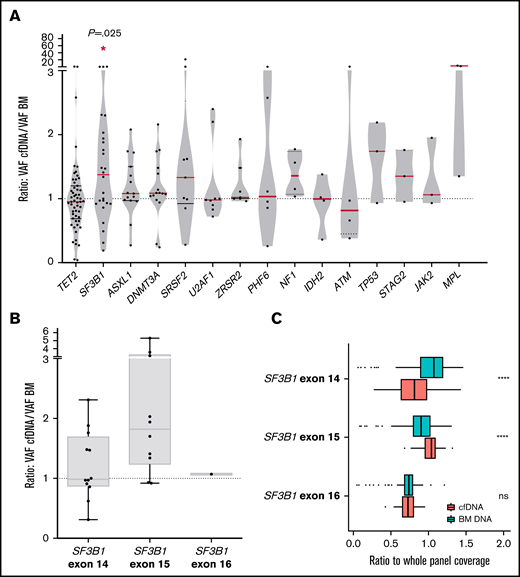
Comparison between VAF in cfDNA and BM DNA for each gene and characterization of SF3B1 mutations. (A) Ratio of the detected variants of the most frequently mutated genes in our cohort. The red lines indicate the median VAF ratio for each gene. Variants situated in the plot above the line had a higher VAF in cfDNA than in BM DNA, and variants below the line had a higher VAF in BM DNA. SF3B1 mutations were detected with a significantly higher VAF in cfDNA. (B) Ratio of the VAFs in SF3B1 mutations in exons 14, 15, and 16. Mutations in exon 15 of SF3B1 (K700E in all cases) presented a higher VAF cfDNA/BM ratio than mutations in SF3B1 exons 14 and 16. (C) SF3B1 read depth in BM and cfDNA. The ratio (read depth for the SF3B1 exon/whole panel read depth for that sample) for exons 14, 15, and 16 of the SF3B1 gene is shown for BM DNA and cfDNA samples. SF3B1 exon 15 was overrepresented in cfDNA libraries when compared with BM libraries. *P ≤ .05; ****P ≤ .0001; ns, not significant.
Comparison between VAF in cfDNA and BM DNA for each gene and characterization of SF3B1 mutations. (A) Ratio of the detected variants of the most frequently mutated genes in our cohort. The red lines indicate the median VAF ratio for each gene. Variants situated in the plot above the line had a higher VAF in cfDNA than in BM DNA, and variants below the line had a higher VAF in BM DNA. SF3B1 mutations were detected with a significantly higher VAF in cfDNA. (B) Ratio of the VAFs in SF3B1 mutations in exons 14, 15, and 16. Mutations in exon 15 of SF3B1 (K700E in all cases) presented a higher VAF cfDNA/BM ratio than mutations in SF3B1 exons 14 and 16. (C) SF3B1 read depth in BM and cfDNA. The ratio (read depth for the SF3B1 exon/whole panel read depth for that sample) for exons 14, 15, and 16 of the SF3B1 gene is shown for BM DNA and cfDNA samples. SF3B1 exon 15 was overrepresented in cfDNA libraries when compared with BM libraries. *P ≤ .05; ****P ≤ .0001; ns, not significant.
Moreover, we identified an SF3B1 K700E mutation detectable only in cfDNA in 1 patient. In this case, the quantification of RSs was not assessable because of the lack of cellularity in the BM aspirate, being the analysis of cfDNA a useful noninvasive alternative to identify the presence of this pathological clone. This SF3B1 mutation was later confirmed by NGS in a subsequent PB sample.
Chromosomal microarray and NGS were highly concordant for detect cytogenetic aberrations
In addition to gene mutations, we assessed the detection of cytogenetic alterations by NGS. Cytogenetic/FISH alterations were detected at the time of diagnosis in 20 of 70 (28.6%) patients with MDS (Figure 6A). Of those, 2 of 20 were infrequent alterations in MDS and were not covered by the design of the NGS panel, and in 6 of 20, chromosome Y loss was the only alteration detected that was also not covered by the NGS panel. So, the cohort included cytogenetic alterations potentially detectable by our gene panel in 12 of 70 patients.
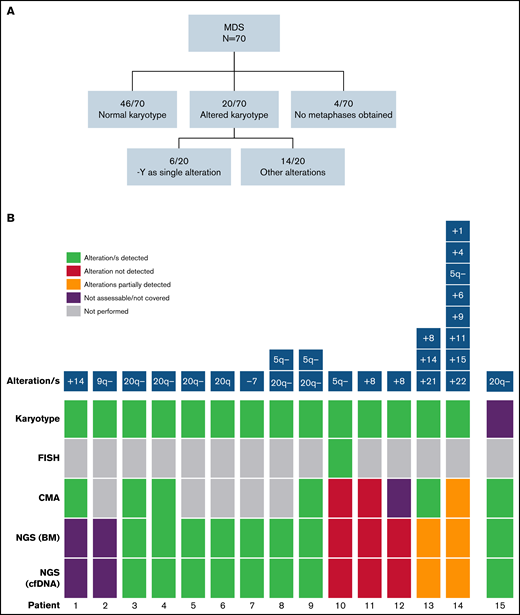
Detection of cytogenetic alterations in MDS patients. (A) Cytogenetic results obtained by karyotype at diagnosis. (B) Detection of cytogenetic alterations by conventional karyotype, FISH, CMA, and NGS. Two cases presented alterations not covered by the NGS panel (patients 1 and 2). 9 of 12 (75%) remaining cases with altered karyotype/FISH (patients 3-14 in the figure) were detected by NGS. Patient 10 presented a 5q− detected in a few metaphases and confirmed by FISH, and patients 11 and 12 presented a +8 detected by karyotype in few metaphases. In patient 13, +8 and +21 alterations were detected by NGS, whereas chromosome 14 was not covered by the design of the NGS panel. In patient 14, 5q− was the only alteration detected by both CMA and NGS because of sensitivity limitations. In a patient without analyzable metaphases (patient 15), 20q− was found by NGS and confirmed by CMA.
Detection of cytogenetic alterations in MDS patients. (A) Cytogenetic results obtained by karyotype at diagnosis. (B) Detection of cytogenetic alterations by conventional karyotype, FISH, CMA, and NGS. Two cases presented alterations not covered by the NGS panel (patients 1 and 2). 9 of 12 (75%) remaining cases with altered karyotype/FISH (patients 3-14 in the figure) were detected by NGS. Patient 10 presented a 5q− detected in a few metaphases and confirmed by FISH, and patients 11 and 12 presented a +8 detected by karyotype in few metaphases. In patient 13, +8 and +21 alterations were detected by NGS, whereas chromosome 14 was not covered by the design of the NGS panel. In patient 14, 5q− was the only alteration detected by both CMA and NGS because of sensitivity limitations. In a patient without analyzable metaphases (patient 15), 20q− was found by NGS and confirmed by CMA.
NGS analysis detected abnormalities in 10 and 70 patients with MDS, in both BM DNA and cfDNA. Interestingly, in a patient without analyzable metaphases in BM karyotype, del(20q) was found by NGS and further confirmed by chromosomal microarray (CMA). Overall, CMA and NGS were highly concordant to detect chromosomal aberrations although they did not reach the sensitivity achieved by conventional cytogenetic analysis (karyotype/FISH; Figure 6B; supplemental Figure 3). Nevertheless, as previously stated, all cytogenetic aberrations detected by NGS in BM DNA were also detected in cfDNA.
cfDNA is useful to predict transformation and monitor response to treatment
Molecular and cytogenetic alterations were monitored in sequential samples from 7 cases (median follow up, 13 months; range, 10-30). We observed an excellent correlation between the VAFs of mutations in BM and cfDNA across multiple matched time points. Both sample types showed similar clonal dynamics irrespective of the treatment and allowed for the monitoring of both mutations and chromosomal aberrations (Figure 7).
![Monitoring of molecular and cytogenetic alterations in 7 patients with MDS. Five patients receiving treatment (3 azacitidine, 1 FLAG-IDA+HCT, and 1 HIF [hypoxia-inducible factor inhibitor]) and 2 untreated cases were included. BM VAF dynamics are shown with dotted lines and cfDNA dynamics are shown with solid lines. CMML, chronic myelomonocytic leukemia; CNA, copy number alteration; HCT, hematopoietic cell transplantation; ND, not detected.](https://ash.silverchair-cdn.com/ash/content_public/journal/bloodadvances/6/10/10.1182_bloodadvances.2021006565/3/m_advancesadv2021006565f7.png?Expires=1769232460&Signature=uCwCTfr1~n7I09AshRp0fiXp7KLLIA5rZL9LX0J2Rc6gOwGMZnURfnJrtadInszFVl68zT~MRT2uWh~~LS7Bui4KOISW~zmsn6hyE~vsL9Qmqa7tusJwOA9Q8N6S~H6ih09PBRuDpXSgUfmbiSjeRNlVVEHE-D11oA4f6uxMZoIKJKQlULIY6wG-WcXMuHCwqWralD0obmcE~Q-ZJhfm1YZm56UC4YLko1jyzWw-2bR4s9EtXalaVUV7xmgEGAWUtj76GXD87~9uX263Sbc5GUIZxEfzywvWwlX2ksl9vv4JuaZfuaE2Q-JLEBXenbqRjrekvFyGkzuPyViP0qrl6Q__&Key-Pair-Id=APKAIE5G5CRDK6RD3PGA)
Monitoring of molecular and cytogenetic alterations in 7 patients with MDS. Five patients receiving treatment (3 azacitidine, 1 FLAG-IDA+HCT, and 1 HIF [hypoxia-inducible factor inhibitor]) and 2 untreated cases were included. BM VAF dynamics are shown with dotted lines and cfDNA dynamics are shown with solid lines. CMML, chronic myelomonocytic leukemia; CNA, copy number alteration; HCT, hematopoietic cell transplantation; ND, not detected.
Monitoring of molecular and cytogenetic alterations in 7 patients with MDS. Five patients receiving treatment (3 azacitidine, 1 FLAG-IDA+HCT, and 1 HIF [hypoxia-inducible factor inhibitor]) and 2 untreated cases were included. BM VAF dynamics are shown with dotted lines and cfDNA dynamics are shown with solid lines. CMML, chronic myelomonocytic leukemia; CNA, copy number alteration; HCT, hematopoietic cell transplantation; ND, not detected.
In those cases treated with hypomethylating agents (ie, azacitidine), a VAF decrease was detected in patients responding to therapy, but not in nonresponding patients. Of note, cfDNA analysis also showed cytogenetic evolution in 2 patients who did not respond to azacitidine (del(12p) and +21) and who had to stop treatment because of lack of response. In the patient treated with FLAG-IDA followed by hematopoietic cell transplantation, the 5 mutations identified at diagnosis were undetectable in cfDNA in a sample collected 7 months after the HCT. One patient treated with hypoxia-inducible factor inhibitor showed a VAF decrease in DNMT3A and SF3B1 mutations and a concomitant increase in the RUNX1 and SETBP1 VAFs during the follow-up and later transformed to chronic myelomonocytic leukemia. In addition, the emergence of a mutation in ASXL1, undetectable at diagnosis, was identified in the latest sample available of both cfDNA and BM DNA.
Two patients who were not receiving treatment were also monitored. One patient, who progressed to AML, showed a clonal expansion of the NF1 mutant clone at the time of AML transformation. The second patient acquired a subclonal del(7q) not detected by NGS and observed only by karyotype in 2 of 20 metaphases. Although our cohort of patients with AML (15 of 18 were de novo AML) presented a higher cfDNA concentration than of MDS at diagnosis, we did not observe an increase in the concentration of cfDNA in the 2 patients with MDS who progressed to AML.
Discussion
In the present study, we assessed the genomic characterization of MDS by targeted NGS of plasma cfDNA compared with BM DNA. This is, to the best of our knowledge, the largest series of cfDNA analyses in patients with MDS. Of note, all samples were taken at diagnosis or before treatment, thus excluding any potentially modifying effect on the results. We designed an NGS gene panel to detect both molecular and cytogenetic alterations with a single test and investigated its potential use in cfDNA, which would be particularly useful in several cases, such as nonfit or fragile elderly patients, patients with fibrotic or hypocellular BM, and patients with contraindication or difficult-to-access BM. Our data demonstrate that the analysis of cfDNA represents a novel strategy that would be useful for routine testing, as cfDNA is obtained fast and easily from blood plasma, when compared with BM aspirates or purified CD34+ cells.19
In patients with solid tumors, cfDNA has been incorporated as a noninvasive strategy to assess molecular alterations in routine clinical practice. It has been reported that most of the cfDNA is released by hematopoietic cells in health and disease.3-6 However, patients with MDS showed a significantly higher amount of cfDNA than healthy controls, indicating a higher release of cfDNA into PB plasma from MDS clonal cells. Of note, even cells in lower risk MDS contained a higher quantity of cfDNA than the control cells. The ineffective hematopoiesis in the stem cell niche and the increased apoptosis of BM cells in MDS8,9 is in line with this higher shedding of cfDNA into PB. A significant correlation was observed between the cfDNA concentration and lactate dehydrogenase values, in accordance with previous studies.12,20 However, contrary to previous findings,12 we did not find a higher concentration of cfDNA in IPSS-R higher risk groups than in lower risk groups. This discordant observation could be explained by the lower risk IPSS-R scores of most patients with MDS included in the study.
In our study, we observed a similar mutational profile in cfDNA and BM DNA (93% concordance) and the VAFs of the mutations identified in both sample types correlated highly. However, some discordant mutations were also identified in a small proportion of patients, in some cases mutations that may have prognostic relevance, such as SF3B1 mutations or mutations in damage DNA repair genes. Cases with mutations detected in cfDNA and not in BM DNA were all those in which plasma and BM samples had been collected at different time points. In addition, some of these discordant cases showed low VAFs that could reflect small clones emerging or slowly expanding or de novo–acquired mutations. Overall, cfDNA and BM DNA showed a high concordance, although they may have had a worse correlation in subclonal alterations, as has been reported for cfDNA in AML.21 Studies of MDS comparing the reliability of cfDNA and total PB cellular DNA analysis for detecting molecular abnormalities by NGS22,23 showed that cfDNA analysis was a better option, as additional mutations were detected in cfDNA and the VAFs in cfDNA were significantly higher than those in PB DNA.22
Interestingly, the VAFs of SF3B1 mutations were significantly higher in cfDNA than in BM DNA, especially for exon 15 SF3B1 mutations (ie, K700E). This observation is clinically relevant, as the analysis of cfDNA could be the best alternative for detecting these mutations, when low-quality BM aspirates are obtained, or for detecting small mutant clones. We identified a SF3B1 mutation in cfDNA and not in BM DNA in a patient in whom the presence of RSs was not assessable because of lack of cellularity in the BM aspirate. We hypothesize that the position of the nucleosomes in exon 15 of SF3B1 could facilitate the detection of the SF3B1 K700E mutation, as we observed that exon 15 of SF3B1 was more represented in cfDNA than in BM DNA.
In view of our results, the sensitive detection of genomic alterations in cfDNA observed in myeloid malignancies suggests that this noninvasive tool could provide useful information in the diagnostic workup of cases with unclear cytopenias, given that the absence of genetic and cytogenetic alterations has demonstrated a high negative predictive value in these cases.24,25 However, the sole presence of genetic alterations should not be interpreted as unequivocal evidence of MDS diagnosis; these alterations could represent clonal hematopoiesis of indeterminate potential that reinforces the need to integrate the molecular information with the patients’ morphological studies and clinical context.26,27
Regarding the detection of cytogenetic alterations in cfDNA of patients with MDS, our results confirm that gains or losses of genetic material are reflected in the cfDNA, and thus we can identify most of them by NGS, including a del(20q) in a patient without analyzable metaphases at diagnosis, which was confirmed by CMA. This is the first study to assess the detection of cytogenetic alterations in cfDNA by NGS in a cohort of patients with MDS. Other studies have used NGS to detect these chromosomal alterations in PB or BM samples,28 and only 1 study used cfDNA to identify the loss of chromosome 9 in cfDNA in a patient with MDS.11
However, it should be noted that the design of the NGS panel covered only a selected part of the genome, so those alterations occurring in uncovered regions will not be detected. The chromosome Y deletion was not included in the NGS panel design, because it has been associated with normal aging29 and is not a defining alteration for MDS.1 As NGS comprehensive molecular profiling with broad NGS-targeted panels or even exome or whole-genome analyses are implemented in clinical practice, these limitations will be overcome. We also observed that subclonal cytogenetic alterations could be detected only in patients by karyotype or FISH, because of the limitations of sensitivity of NGS or CMA. We must recall that, at present, cytogenetic techniques are still, besides morphology, the backbone elements of MDS diagnosis. Further validation of these results including higher risk cytogenetic subgroups would support the value of cfDNA analysis as a useful tool to be implemented in routine clinical practice that could improve the identification of alterations required for accurate risk classification.
One of the plausible applications of cfDNA is disease monitoring. To evaluate this approach, we used NGS to analyze sequential samples from 7 patients with MDS. Previous studies had shown that the clonal dynamics of BM VAFs were mimicked by cfDNA VAFs.11 The most remarkable result when monitoring these patients was the finding that in 2 of them who did not respond to hypomethylating agents, NGS of cfDNA enabled us to detect the occurrence of cytogenetic evolution.
Further studies are needed to confirm the applicability of cfDNA in MDS; however, this less invasive technique could allow for early detection of clinically relevant genomic changes, as it is known that clonal dynamic acquisition during the follow-up has a significant prognostic impact on MDS.30 The incorporation of liquid biopsy analysis in clinical practice would enable frequent and noninvasive assessment of fragile elderly patients and of those with hypocellular or fibrotic BM. Moreover, cfDNA analysis could be of special interest in scheduling reevaluation of BM aspirates in lower risk patients without evidence of disease progression.
In summary, we have shown that cfDNA mirrors the molecular profile of BM in MDS. In our cohort, enriched with lower risk patients, cytogenetic alterations were detectable in most cases by NGS in both BM DNA and cfDNA. Although further studies with larger cohorts are needed to confirm these results, especially for cytogenetic alterations, our data support the analysis of cfDNA as a promising method for characterizing and monitoring the molecular abnormalities present in patients with MDS.
Acknowledgments
This work was supported by Institut de Salud Carlos III-Federación Española de Enfermedades Raras (ISCIII-FEDER) grants PI16/0153, PI19/0005, 2017SGR205, and PT20/00023, and Xarxa de Banc de Tumors de Catalunya.
Authorship
Contribution: N.G.-G. performed the research and the statistical analysis, analyzed and interpreted the results, and wrote the manuscript; C.B. and B.B. designed the research study, analyzed and interpreted the results, and wrote the manuscript; S.G.-A., B.M., M.S., C.F.-R., and J.G. performed the research, collected the data and interpreted the results; L.F.-I., L.C., M.L., R.L., B.E., P.V., R.M.P., and M.A.-C. collected and analyzed the data; L.A., A.S., and X.C. collected the data and analyzed and interpreted the results; and all authors reviewed and approved the final version of the manuscript.
Conflict-of-interest disclosure: A.S. has received research funding from and serves on the speakers bureau of Roche; is a consultant to and serves on the speakers bureau of Janssen Pharmaceuticals and Gilead; and has been a consultant to Celgene. C.B. has received research funding from Gilead. B.B. has served on the speakers bureau, received research funding from, and served as a consultant to Thermo Fisher Scientific; has been a consultant to and served on the speakers bureau of Qiagen, and has received research funding from and served on the speakers bureau of Roche. The remaining authors declare no competing financial interests.
Correspondence: Beatriz Bellosillo, Hospital del Mar, Passelg Maritim 25-29, Barcelona 08003, Spain; e-mail: bbellosillo@parcdesalutmar.cat.

