

Key Points
Allele-specific methylation of the ASNS gene is associated with asparaginase sensitivity and therapeutic outcome in T-ALL.
Pediatric T-ALL patients with poor prognostic SPI1 fusion exclusively exhibited ASNS hypomethylation status.

Abstract
Asparaginase therapy is a key component of chemotherapy for patients with T-cell acute lymphoblastic leukemia (T-ALL). Asparaginase depletes serum asparagine by deamination into aspartic acid. Normal hematopoietic cells can survive due to asparagine synthetase (ASNS) activity, whereas leukemia cells are supposed to undergo apoptosis due to silencing of the ASNS gene. Because the ASNS gene has a typical CpG island in its promoter, its methylation status in T-ALL cells may be associated with asparaginase sensitivity. Thus, we investigated the significance of ASNS methylation status in asparaginase sensitivity of T-ALL cell lines and prognosis of childhood T-ALL. Sequencing of bisulfite polymerase chain reaction products using next-generation sequencing technology in 22 T-ALL cell lines revealed a stepwise allele-specific methylation of the ASNS gene, in association with an aberrant methylation of a 7q21 imprinted gene cluster. T-ALL cell lines with ASNS hypermethylation status showed significantly higher in vitro l-asparaginase sensitivity in association with insufficient asparaginase-induced upregulation of ASNS gene expression and lower basal ASNS protein expression. A comprehensive analysis of diagnostic samples from pediatric patients with T-ALL in Japanese cohorts (N = 77) revealed that methylation of the ASNS gene was associated with an aberrant methylation of the 7q21 imprinted gene cluster. In pediatric T-ALL patients in Japanese cohorts (n = 75), ASNS hypomethylation status was significantly associated with poor therapeutic outcome, and all cases with poor prognostic SPI1 fusion exclusively exhibited ASNS hypomethylation status. These observations show that ASNS hypomethylation status is associated with asparaginase resistance and is a poor prognostic biomarker in childhood T-ALL.
Introduction
T-cell acute lymphoblastic leukemia (T-ALL) is an aggressive hematologic malignancy of T-cell progenitors. In recent trials, the cure rates of childhood T-ALL were ∼80% with intensified multiagent chemotherapy.1-3 Nevertheless, the prognosis of primary refractory or relapsed cases remains unsatisfactory.4-8 In recent treatment regimens for patients with T-ALL, the introduction of high-dose asparaginase into consolidation therapy significantly improved prognosis.9 In asparaginase therapy, serum asparagine is depleted by deamination into aspartic acid.10,11 Normal hematopoietic cells can survive by producing asparagine from aspartic acid, owing to inherent asparagine synthetase (ASNS) activity. In contrast, ALL cells are supposed to depend on an extracellular source of asparagine due to silencing of the ASNS gene.12,13 As a result, asparaginase therapy specifically induces cell death in ALL cells. Because the ASNS gene has a typical CpG island in its promoter, the methylation status of the ASNS gene in T-ALL cells may be associated with asparaginase sensitivity.14,15 Indeed, a recent report on adult T-ALL revealed that the methylation status of the ASNS gene was significantly associated with therapeutic outcome; cases in the lower methylation tertile reported significantly poorer prognoses than those in the middle and higher tertiles.16 Although these observations in adult T-ALL strongly suggest that ASNS gene methylation status may also be associated with the prognosis of childhood T-ALL, it remains to be directly confirmed.
We recently found that the ASNS gene was methylated in an allele-specific manner in B-cell precursor ALL (BCP-ALL) cell lines and in patient samples from childhood BCP-ALL.17 Allele-specific methylation is a hallmark of genomic imprinting, and the ASNS gene is located adjacent to the 7q21 imprinted gene clusters.18,19 Of note, in BCP-ALL, the methylation status of the ASNS gene was associated with an aberrant methylation of the 7q21 imprinted gene cluster.17 These previous observations of BCP-ALL suggested that the ASNS gene in T-ALL cells may also be methylated in an allele-specific manner as a result of aberrant imprinting of the 7q21 imprinted gene cluster, but it remains to be elucidated. Moreover, ASNS methylation status in childhood BCP-ALL was highly associated with cytogenetic abnormalities; highly methylated status was associated with favorable karyotypes, whereas unmethylated status was associated with poor prognostic karyotypes. In childhood T-ALL, the recently identified SPI1 fusion (TCF7-SPI1 and STMN1-SPI1 fusions) is the first cytogenetic abnormality associated with poor prognosis.20 Thus, SPI1 fusion in childhood T-ALL may be associated with an unmethylated status of the ASNS gene, which could result in a poor response to asparaginase therapy.
In the present study, we sought to verify the significance of ASNS methylation status in a panel of T-ALL cell lines and a series of childhood T-ALL samples. We confirmed the allele-specific methylation of the ASNS gene in T-ALL cell lines. ASNS hypermethylation in T-ALL cell lines and childhood T-ALL samples was significantly correlated with hypermethylation in the 7q21 imprinted gene cluster. Of note, ASNS methylation status in T-ALL cell lines was closely associated with in vitro l-asparaginase sensitivity. Moreover, the hypomethylation status of the ASNS gene was significantly associated with poor prognosis in childhood T-ALL. Finally, we confirmed that SPI1 fusion was associated with ASNS hypomethylation status.
Materials and methods
Cell lines
Twenty-two human T-ALL cell lines were used in this study (supplemental Table 1). Most of the cell lines were provided in 2015 (A. T. Look, Dana-Farber Cancer Institute, Boston, MA). L-MAT and L-KAW were sequentially established at Tohoku University and were provided in 2014 (M. Minegishi). KOPT-5 was established in our laboratory. In six T-ALL cell lines (HSB2, RPMI-8402, CCRF-CEM, MOLT-16, PF382, and L-KAW), STIL-TAL1 fusion was detected by whole transcriptome sequencing after filtering SJ.out.tab data generated by STAR software.21 All cell lines were maintained in RPMI 1640 medium supplemented with 10% to 20% fetal calf serum.
Methylation analysis by bisulfate sequencing
Sodium bisulfite modification was performed with an EZ DNA Methylation Lightning kit (Zymo Research, Irvine, CA). Polymerase chain reaction (PCR) primers17 were designed by using MethPrimer (http://www.urogene.org/methprimer/). Amplification was performed with FastStart Taq DNA Polymerase (Roche, Basel, Switzerland) using 1 cycle of 95°C for 4 minutes, 40 cycles of 95°C for 30 seconds, 55°C for 30 seconds, and 72°C for 1 minute, with a final cycle of 72°C for 7 minutes. Amplicon libraries were generated by using an Ion Plus Fragment Library Kit (Thermo Fisher Scientific, Waltham, MA) and Ion Xpress Barcode Adaptors Kit (Thermo Fisher Scientific). Following Agencourt AMPure XP purification (Beckman Coulter, Brea, CA), individual libraries were amplified. The libraries were then processed with an Ion Chef System by using an Ion PG Hi-Q Chef Kit (Thermo Fisher Scientific). Next-generation sequencing (NGS) was performed by using an Ion PGM Hi-Q Sequencing Kit (Thermo Fisher Scientific) and 850 flows on an Ion 318 Chip Kit v2 (Thermo Fisher Scientific). After sequencing, single processing and base calling were performed with Torrent Suite 5.0.2 (Thermo Fisher Scientific). Methylation analysis was performed by using a Methylation Analysis Amplicon plug-in v1.3 (Thermo Fisher Scientific).
Cell viability assay
To determine the 50% inhibitory concentration (IC50) values of l-asparaginase in T-ALL cell lines, an alamarBlue cell viability assay (Bio-Rad Laboratories, Hercules, CA) was performed.22 Briefly, 1.5 to 4.0 × 10⁴ cells/100 µL were plated into each well of a 96-well flat-bottom plate, and assays were performed in triplicate in the absence or presence of 7 different concentrations (from 0.01 IU/mL to 40 IU/mL) of l-asparaginase. For seven T-ALL cell lines in which the IC50 value of l-asparaginase was <0.01 IU/mL, additional assays were performed at lower concentrations (5 different concentrations from 0.000016 IU/mL to 0.01 IU/mL) to determine the accurate IC50 value. The cells were cultured for 66 hours, and then 20 μL/well of alamarBlue was added into each well. After a 6-hour additional incubation with alamarBlue, the absorbance at 570 nm was monitored by a microplate spectrophotometer using 600 nm as a reference wavelength. Cell viability was calculated by expressing the ratio of the optical density of the treated wells to that of the untreated wells as a percentage. The concentration of l-asparaginase required to reduce the viability of the treated cells to 50% of the untreated cells was calculated, and the median of the IC50 values measured by 3 independent assays was determined as the IC50 of l-asparaginase.
Real-time reverse transcription–PCR analysis
Total RNA was extracted by using the TRIzol reagent (Invitrogen, Carlsbad, CA). Reverse transcription (RT) was performed by using random hexamer (Amersham Bioscience, Buckinghamshire, United Kingdom) and Superscript II reverse transcriptase (Invitrogen), and the samples were incubated with RNase (Invitrogen). To quantify the gene expression levels of ASNS, PEG10, PDK4, DLX5, and TAC1, real-time RT-PCR analyses were performed by using a TaqMan probe kit (ASNS, Hs00370265_m1; PEG10, Hs00248288_s1; PDK4, Hs01037712_m1; DLX5, Hs00193291_m1; and TAC1, Hs00243225_m1; Applied Biosystems, Foster City, CA). As an internal control, the ACTB (Hs01060665_g1; Applied Biosystems) gene expression level was also quantified. Each gene expression level was determined by using dilution series of MOLT-16 complementary DNA as a standard curve, and the relative gene expression level was evaluated by using P12/ICHIKAWA as a control cell line except for PEG10. In the case of PEG10 gene expression level, MOLT-13 was used for the standard curve and control cell line for the relative expression.
Western blot analysis of ASNS
Cells were solubilized in NP40-lysis buffer. The cell lysates were separated on a sodium dodecyl sulfate–polyacrylamide gel and transferred to a nitrocellulose membrane. The membrane was incubated with anti-ASNS (HPA029318, Atlas Antibodies, Stockholm, Sweden) and anti-ACTB (MBL, Nagoya, Japan) antibodies. Subsequently, the membrane was incubated with horseradish peroxidase–labeled anti-rabbit immunoglobulin G (Medical & Biological Laboratories Co. LTD) and developed by using an enhanced chemiluminescence detection kit (GE Healthcare, Little Chalfont, United Kingdom). Band intensities of ASNS and ACTB on the film were measured by using ImageJ (National Institutes of Health, Bethesda, MD).
Analysis of patient samples
We analyzed clinical samples at diagnosis that were obtained from 77 pediatric patients with T-ALL (supplemental Table 2). These cases included 2 large cohorts from the Tokyo Children’s Cancer Study Group (TCCSG; n = 57) and the Japan Association of Childhood Leukemia Study Group (JACLS; n = 20).20,23 Bone marrow, peripheral blood, lymph node, or other infiltrated tissue samples were collected from the patients after receiving written, informed consent according to protocols approved by the Human Genome, Gene Analysis Research Ethics Committee of the University of Tokyo, and other participating institutes. To analyze the methylation status of the ASNS CpG island in the samples, we used the database of a previous comprehensive methylation analysis using the Infinium MethylationEPIC BeadChip Kit (Illumina, San Diego, CA).23 Gene expression level of 7q21 imprinted cluster genes including ASNS in the samples was obtained from previous RNA-sequencing data.20 The normalized gene expression level was calculated from the read counts by using DESeq2 software (R package, Bioconductor).
Statistical analysis
The Mann-Whitney U test, Spearman correlation test, Wilcoxon signed-rank test, and χ2 test were performed by using GraphPad Prism 7.03 (GraphPad Software, La Jolla, CA). The log-rank test, Cox proportional hazards model, and Spearman correlation test for analysis of patient samples were performed by using R version 3.5.2 (R Foundation for Statistical Computing, Vienna, Austria).
Results
Allele-specific methylation of the ASNS gene in T-ALL cell lines
The human ASNS gene has a typical CpG island at the boundary of the promoter and initial exons. To analyze the methylation status of this region in 22 human T-ALL cell lines (supplemental Table 1), we performed bisulfite PCR of a 228-bp region located at the boundary of the promoter and exon 1a and investigated the methylation status of 23 CG dinucleotides using NGS technology, as we previously reported.17 The methylation status in each of the 23 CG dinucleotides showed an almost similar pattern in each cell line (Figure 1A). Based on the methylation status of the 23 CG dinucleotides, we categorized 22 cell lines into 3 groups (Figure 1B-C; supplemental Figure 1). Fourteen cell lines were categorized into a weakly methylated group (single large peak of unmethylated reads in histogram), 3 cell lines into an intermediately methylated group (2 peaks of fully methylated and unmethylated reads), and 5 cell lines into a highly methylated group (single large peak of fully methylated reads).
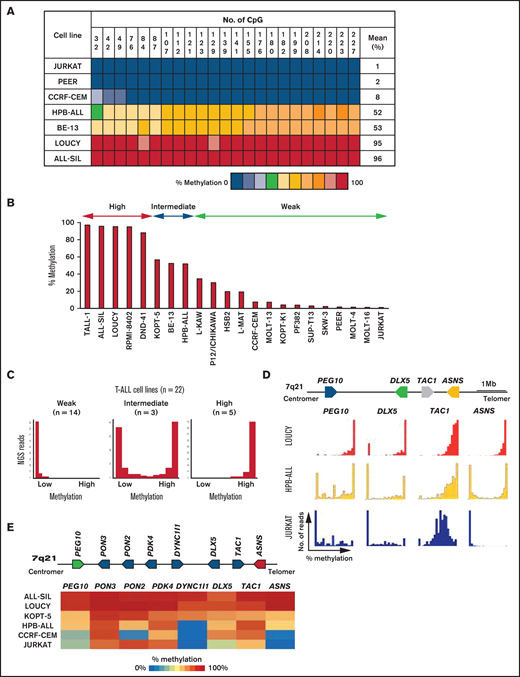
Allele-specific methylation of ASNS gene in human T-ALL cell lines. (A) A heat map of methylation status of each CG nucleotide in the CpG island of the ASNS gene in representative cell lines. (B) Mean percent methylation of the ASNS gene in 22 human T-ALL cell lines. (C) Typical histograms of ASNS gene methylation in weakly, intermediately, and highly methylated cell lines. Horizontal axes indicate percentage methylation of each NGS read; vertical axes indicate the frequency of NGS reads. (D) Methylation status of PEG10, DLX5, TAC1, and ASNS in 3 representative T-ALL cell lines with different ASNS methylation status. LOUCY is ASNS highly methylated cell line, HPB-ALL is ASNS intermediately methylated cell line, and JURKAT is ASNS weakly methylated cell line. The top panel is a schematic representation of gene configuration. The horizontal axes indicate percent methylation of each NGS read, and the vertical axes indicate frequency of reads. (E) Methylation status of eight genes at the imprinted gene cluster of 7q21 in six T-ALL cell lines. ALL-SIL and LOUCY are ASNS highly methylated cell lines, KOPT-5 and HPB-ALL are ASNS intermediately methylated cell lines, and CCRF-CEM and JURKAT are ASNS weakly methylated cell lines. The top panel is a schematic representation of gene configuration. The bottom panel is a heat map of the mean percent methylation levels of each gene in each cell line.
Allele-specific methylation of ASNS gene in human T-ALL cell lines. (A) A heat map of methylation status of each CG nucleotide in the CpG island of the ASNS gene in representative cell lines. (B) Mean percent methylation of the ASNS gene in 22 human T-ALL cell lines. (C) Typical histograms of ASNS gene methylation in weakly, intermediately, and highly methylated cell lines. Horizontal axes indicate percentage methylation of each NGS read; vertical axes indicate the frequency of NGS reads. (D) Methylation status of PEG10, DLX5, TAC1, and ASNS in 3 representative T-ALL cell lines with different ASNS methylation status. LOUCY is ASNS highly methylated cell line, HPB-ALL is ASNS intermediately methylated cell line, and JURKAT is ASNS weakly methylated cell line. The top panel is a schematic representation of gene configuration. The horizontal axes indicate percent methylation of each NGS read, and the vertical axes indicate frequency of reads. (E) Methylation status of eight genes at the imprinted gene cluster of 7q21 in six T-ALL cell lines. ALL-SIL and LOUCY are ASNS highly methylated cell lines, KOPT-5 and HPB-ALL are ASNS intermediately methylated cell lines, and CCRF-CEM and JURKAT are ASNS weakly methylated cell lines. The top panel is a schematic representation of gene configuration. The bottom panel is a heat map of the mean percent methylation levels of each gene in each cell line.
We next investigated the methylation status of the CpG island of the 7q21 imprinted gene cluster in T-ALL cell lines. First, we investigated the methylation status of PEG10, a typical paternally expressed gene,24 DLX5, a maternally expressed gene,25,26 and TAC1, in three T-ALL cell lines with different ASNS methylation statuses (Figure 1D). The methylation status of the ASNS gene in 3 cell lines exhibited an almost similar pattern to those of the PEG10 and DLX5 genes. We further investigated the methylation status of eight genes located between PEG10 and ASNS in six T-ALL cell lines (Figure 1E). The methylation status of the ASNS gene in the six T-ALL cell lines almost correlated with that of the other genes located in the 7q21 imprinted gene cluster. These observations show that the CpG island of the ASNS gene in T-ALL cell lines is methylated basically in an allele-specific manner as a result of aberrant imprinting of the 7q21 imprinted gene cluster.
Association of ASNS methylation with l-asparaginase sensitivity in T-ALL cell lines
We analyzed in vitro l-asparaginase sensitivity of 22 human T-ALL cell lines using the alamarBlue cell viability assay (Figure 2A). In asparaginase therapy, the target trough serum concentration is reportedly ∼0.1 IU/mL.27,28 Of clinical importance, the significance of ASNS methylation status in in vitro asparaginase sensitivity of T-ALL cell lines was the most remarkable at concentrations under the targeted trough level (Figure 2B). At 3 lower concentrations (0.0098, 0.039, and 0.156 IU/mL) of the analysis, highly methylated cell lines were significantly more sensitive and tended to be more sensitive than weakly methylated cell lines and intermediately methylated cell lines, respectively. The log IC50 value of l-asparaginase in each cell line exhibited a significant negative correlation with the ASNS methylation level (R2 = 0.46; P = .0005) (Figure 2C). Highly methylated cell lines (median IC50, 0.00019 IU/mL) were significantly more sensitive than intermediately methylated cell lines (median IC50, 0.17 IU/mL) and weakly methylated cell lines (median IC50, 0.25 IU/mL). These observations show that ASNS methylation status is closely associated with in vitro l-asparaginase sensitivity in T-ALL cell lines, particularly at therapeutic concentrations.
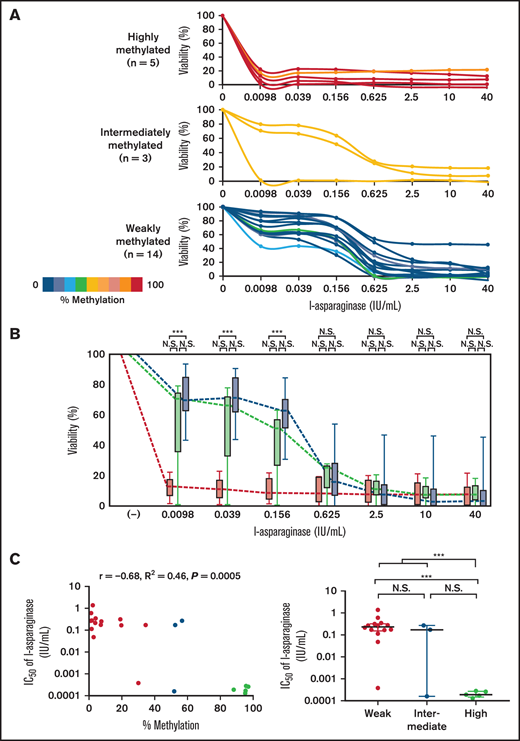
Association of ASNS methylation with l-asparaginase sensitivity in T-ALL cell lines. (A) Dose–response curves of l-asparaginase sensitivity in 22 T-ALL cell lines. The colors of the curves show percent methylation of ASNS in each cell line. (B) Dose–response curves of l-asparaginase sensitivity in 3 groups of T-ALL cell lines with different ASNS methylation status. Box plots indicate cell viabilities in ASNS highly (red), intermediately (yellow), and weakly (blue) methylated cell lines at each concentration. (C) Association of ASNS methylation with asparaginase sensitivity in T-ALL cell lines. In the left panel, the horizontal axis indicates the percent methylation of the ASNS gene and the vertical axis indicates the log IC50 value of asparaginase. The correlation coefficient and P value in the Spearman correlation test are shown. In the right panel, the log IC50 value of asparaginase is compared among ASNS highly methylated (red), intermediately methylated (yellow), and weakly methylated (blue) cell lines. Asterisks indicate significance in the Mann-Whitney U test. ***P < .001. N.S., not significant.
Association of ASNS methylation with l-asparaginase sensitivity in T-ALL cell lines. (A) Dose–response curves of l-asparaginase sensitivity in 22 T-ALL cell lines. The colors of the curves show percent methylation of ASNS in each cell line. (B) Dose–response curves of l-asparaginase sensitivity in 3 groups of T-ALL cell lines with different ASNS methylation status. Box plots indicate cell viabilities in ASNS highly (red), intermediately (yellow), and weakly (blue) methylated cell lines at each concentration. (C) Association of ASNS methylation with asparaginase sensitivity in T-ALL cell lines. In the left panel, the horizontal axis indicates the percent methylation of the ASNS gene and the vertical axis indicates the log IC50 value of asparaginase. The correlation coefficient and P value in the Spearman correlation test are shown. In the right panel, the log IC50 value of asparaginase is compared among ASNS highly methylated (red), intermediately methylated (yellow), and weakly methylated (blue) cell lines. Asterisks indicate significance in the Mann-Whitney U test. ***P < .001. N.S., not significant.
Association of ASNS methylation with ASNS gene and protein expression in T-ALL cell lines
Previous reports showed that ASNS gene expression in ALL cell lines is upregulated in response to asparagine depletion by l-asparaginase treatment.29,30 We therefore investigated the association of ASNS methylation status with ASNS gene expression level in 22 T-ALL cell lines cultured in the absence or presence of 1.0 IU/mL of l-asparaginase for 12 hours. ASNS gene expression level was significantly upregulated in the presence of l-asparaginase in all but 2 cell lines (supplemental Table 1). By l-asparaginase treatment, 8.1-fold (median) (P = .0001 in the Wilcoxon signed-rank test), 5.4-fold (P = .25), and 2.6-fold (P = .063) inductions of ASNS gene expression level were observed in 14 weakly methylated cell lines, 3 intermediately methylated cell lines, and 5 highly methylated cell line, respectively (supplemental Table 1; supplemental Figure 2). As a whole, the mean ASNS gene expression level was significantly upregulated in 14 weakly methylated cell lines (P = .0001 in the Wilcoxon signed-rank test) (Figure 3A) but not significantly upregulated in 3 intermediately methylated cell lines (P = .25) or in 5 highly methylated cell lines (P = .063). Basal ASNS gene expression levels in T-ALL cell lines were not correlated with ASNS methylation levels (R2 = 0.04; P = .38) (Figure 3B), whereas asparaginase-induced ASNS gene expression levels were significantly correlated with ASNS methylation levels (R2 = 0.31; P = .0072). Highly methylated cell lines exhibited significantly lower asparaginase-induced ASNS gene expression levels than intermediately and weakly methylated cell lines (P = .011) (supplemental Figure 3).
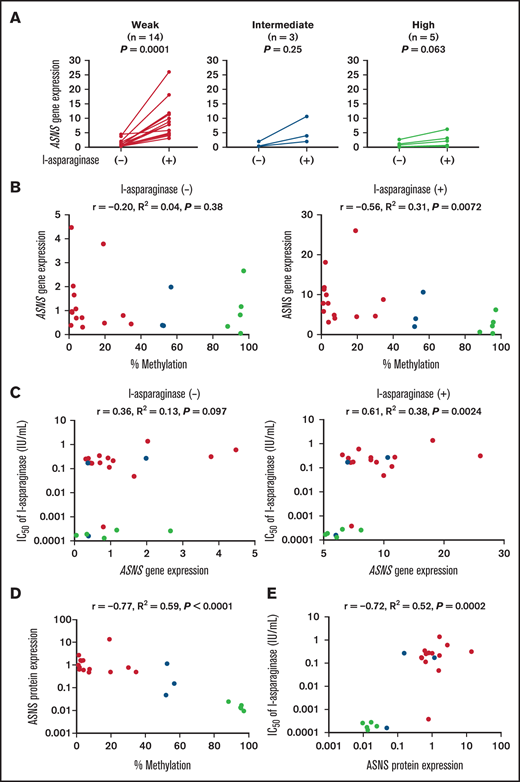
Association of ASNS methylation with ASNS gene and protein expression levels in T-ALL cell lines. (A) Induction of ASNS gene expression by asparaginase treatment in T-ALL cell lines. Each cell line was cultured in the absence or presence of 1.0 U/mL of l-asparaginase for 12 hours. ASNS gene expression level in each cell line was determined by real time RT-PCR using ACTB gene expression level as an internal control. The vertical axes indicate relative ASNS gene expression level in each cell line, which was evaluated by using P12/ICHIKAWA as a control cell line. The values were compared between untreated cells and l-asparaginase–treated cells. P values in the Wilcoxon signed-rank test are shown. (B) Association between ASNS methylation status and ASNS gene expression in T-ALL cell lines. Horizontal axes indicate percent methylation of the ASNS gene, and vertical axes indicate basal (left) and asparaginase-induced (right) ASNS gene expression level. (C) Association of ASNS gene expression with asparaginase sensitivity in T-ALL cell lines. Vertical axes indicate log IC50 value of l-asparaginase, and horizontal axes indicate basal (left) and asparaginase-induced (right) ASNS gene expression level. (D) Association between ASNS methylation status and basal ASNS protein expression in T-ALL cell lines. Horizontal axis indicates percent methylation of the ASNS gene, and vertical axis indicates ASNS protein expression level in each cell line as relative value to that in the control cell line (JURKAT). (E) Association of ASNS protein expression with asparaginase sensitivity in T-ALL cell lines. The vertical axis indicates the log IC50 value of l-asparaginase, and the horizontal axis indicates ASNS protein expression level in each cell line as relative value to that in the control cell line (JURKAT). Panels B to E: red, yellow, and blue circles represent ASNS highly, intermediately, and weakly methylated cell lines, respectively. Correlation coefficients and P values in the Spearman correlation test are shown.
Association of ASNS methylation with ASNS gene and protein expression levels in T-ALL cell lines. (A) Induction of ASNS gene expression by asparaginase treatment in T-ALL cell lines. Each cell line was cultured in the absence or presence of 1.0 U/mL of l-asparaginase for 12 hours. ASNS gene expression level in each cell line was determined by real time RT-PCR using ACTB gene expression level as an internal control. The vertical axes indicate relative ASNS gene expression level in each cell line, which was evaluated by using P12/ICHIKAWA as a control cell line. The values were compared between untreated cells and l-asparaginase–treated cells. P values in the Wilcoxon signed-rank test are shown. (B) Association between ASNS methylation status and ASNS gene expression in T-ALL cell lines. Horizontal axes indicate percent methylation of the ASNS gene, and vertical axes indicate basal (left) and asparaginase-induced (right) ASNS gene expression level. (C) Association of ASNS gene expression with asparaginase sensitivity in T-ALL cell lines. Vertical axes indicate log IC50 value of l-asparaginase, and horizontal axes indicate basal (left) and asparaginase-induced (right) ASNS gene expression level. (D) Association between ASNS methylation status and basal ASNS protein expression in T-ALL cell lines. Horizontal axis indicates percent methylation of the ASNS gene, and vertical axis indicates ASNS protein expression level in each cell line as relative value to that in the control cell line (JURKAT). (E) Association of ASNS protein expression with asparaginase sensitivity in T-ALL cell lines. The vertical axis indicates the log IC50 value of l-asparaginase, and the horizontal axis indicates ASNS protein expression level in each cell line as relative value to that in the control cell line (JURKAT). Panels B to E: red, yellow, and blue circles represent ASNS highly, intermediately, and weakly methylated cell lines, respectively. Correlation coefficients and P values in the Spearman correlation test are shown.
We next investigated an association of ASNS gene expression level with l-asparaginase sensitivity (Figure 3C). Basal ASNS gene expression levels did not show a significant correlation with the log IC50 values of l-asparaginase (R2 = 0.13; P = .097), whereas asparaginase-induced ASNS gene expression levels displayed a significant positive correlation (R2 = 0.38; P = .0024). We also analyzed gene expression levels of other representative 7q21 cluster genes (PEG10, PDK4, DLX5, and TAC1) in each cell line cultured in the absence or presence of l-asparaginase (1.0 IU/mL) for 12 hours by real-time RT-PCR. Diverse level of PEG10 gene expression was observed in each cell line, whereas gene expression of PDK4, DLX5, and TAC1 was undetectable in the majority of cell lines. Unlike ASNS gene expression, PEG10 gene expression level was unchanged in response to l-asparaginase treatment (supplemental Figure 4A). Moreover, neither basal (supplemental Figure 4B, left) nor l-asparaginase–treated (supplemental Figure 4B, right) PEG10 gene expression level was correlated with the log IC50 value of l-asparaginase.
We then semi-quantified basal ASNS protein expression levels in T-ALL cell lines by western blot, using ACTB protein expression as an internal control (supplemental Figure 5). In contrast to basal ASNS gene expression levels, basal ASNS protein expression levels exhibited a significant negative correlation with ASNS methylation levels (R2 = 0.59; P < .0001) (Figure 3D). Highly methylated cell lines exhibited significantly lower basal ASNS protein expression levels than intermediately and weakly methylated cell lines (P < .0001) (supplemental Figure 6). Basal ASNS protein expression levels in weakly methylated cell lines tended to be higher than those in intermediately methylated cell lines (P = .16). Of note, basal ASNS protein expression levels displayed a significant positive correlation with the log IC50 values of l-asparaginase (R2 = 0.52; P = .0002) (Figure 3E). We also investigated changes in ASNS protein expression level after l-asparaginase-treatment in 5 representative T-ALL cell lines with different ASNS methylation status (supplemental Figure 7). In response to l-asparaginase treatment, ASNS protein expression was upregulated in ASNS weakly (JURKAT and PEER) and intermediately (KOPT-5) methylated cell lines, while almost undetectable in highly methylated cell lines (DND-41 and LOUCY) even after l-asparaginase treatment. These observations indicate that higher ASNS methylation in T-ALL cell lines is associated with higher l-asparaginase sensitivity, probably due to insufficient induction of ASNS gene expression and lower basal ASNS protein expression.
ASNS methylation status in pediatric T-ALL
We next investigated ASNS methylation status in clinical samples from childhood T-ALL patients. We used the database of a previous comprehensive methylation analysis of 77 diagnostic samples from Japanese patients (57 samples in the TCCSG cohort and 20 samples in the JACLS cohort) (supplemental Table 2).23 We evaluated the mean percent methylation of six CpG sites (supplemental Figure 8) located in the exact region that was analyzed in T-ALL cell lines by using bisulfite PCR. Twenty (26%) samples showed highly (methylation >66.7%) methylated status, whereas 15 (19%) samples and 42 (55%) samples showed intermediately (33.3% to 66.7%) and weakly (<33.3%) methylated status, respectively. Next, we investigated the correlation of methylation status between the ASNS gene and each of 7 genes located between PEG10 and ASNS in the 7q21 imprinted gene cluster. Of note, the methylation level of ASNS showed a significant positive correlation with those of the 7 genes except for PON2 (Figure 4A). These observations of childhood T-ALL samples show that the ASNS gene is methylated in association with aberrant imprinting of the 7q21 imprinted gene cluster. We further evaluated an association of ASNS methylation status with ASNS gene expression level. However, ASNS gene expression level was not significantly correlated with ASNS methylation level (R2 = 0.024; P = .17) (Figure 4B).
![ASNS methylation status in pediatric patients with T-ALL. (A) Correlation between methylation level of ASNS and that of 7 genes located in the 7q21 imprinted gene cluster in 77 childhood T-ALL samples of the TCCSG and JACLS cohorts (DNA Data Bank of Japan [JGAS00000000138]).23 The vertical axes indicate mean percent methylation of ASNS, and the horizontal axes indicate mean percent methylation of each gene. The correlation coefficients and P values in the Spearman correlation test are indicated. (B) Association of ASNS methylation status with ASNS gene expression in 77 childhood T-ALL samples of the TCCSG and JACLS cohorts. Correlation coefficient and P value in the Spearman correlation test are shown.](https://ash.silverchair-cdn.com/ash/content_public/journal/bloodadvances/6/1/10.1182_bloodadvances.2021004271/4/m_advancesadv2021004271f4.png?Expires=1769098722&Signature=iYyfVPGCmYqjByXpRqvM-qiTSInwERR9~JsiTb5QS9FdS-g1Di2jfVvjFo2ZU3FkxYY8Nswn9FZAKYk7pwEMGKqhVGfMVYvPyKGWp0hk5~9kSSGW0iYeENNlSqUlG28FccEQRp48qCZDi220aqB4mUap8L1e94H5wxoD3Jjao0aZoNp91rVVBVt4t27sOX7IbBkzBAKJ5eiWPDC1ANZSUVGVfeq77Vzvuh9g0NtWJlKwocEpbWyqzGbwExragGOSXa9hdczWfNvLFzcWjDEB2a6jL6SjGTl237DZ9Pv7tU5MghQlQDkq~Eftg9utM4tH7-3idM-co2o3yBHkwMBVZQ__&Key-Pair-Id=APKAIE5G5CRDK6RD3PGA)
ASNS methylation status in pediatric patients with T-ALL. (A) Correlation between methylation level of ASNS and that of 7 genes located in the 7q21 imprinted gene cluster in 77 childhood T-ALL samples of the TCCSG and JACLS cohorts (DNA Data Bank of Japan [JGAS00000000138]).23 The vertical axes indicate mean percent methylation of ASNS, and the horizontal axes indicate mean percent methylation of each gene. The correlation coefficients and P values in the Spearman correlation test are indicated. (B) Association of ASNS methylation status with ASNS gene expression in 77 childhood T-ALL samples of the TCCSG and JACLS cohorts. Correlation coefficient and P value in the Spearman correlation test are shown.
ASNS methylation status in pediatric patients with T-ALL. (A) Correlation between methylation level of ASNS and that of 7 genes located in the 7q21 imprinted gene cluster in 77 childhood T-ALL samples of the TCCSG and JACLS cohorts (DNA Data Bank of Japan [JGAS00000000138]).23 The vertical axes indicate mean percent methylation of ASNS, and the horizontal axes indicate mean percent methylation of each gene. The correlation coefficients and P values in the Spearman correlation test are indicated. (B) Association of ASNS methylation status with ASNS gene expression in 77 childhood T-ALL samples of the TCCSG and JACLS cohorts. Correlation coefficient and P value in the Spearman correlation test are shown.
Clinical significance of ASNS methylation status in childhood T-ALL
We examined an association of ASNS methylation status with therapeutic outcome in childhood T-ALL. Among 75 Japanese patients in whom information was provided on the outcome, 25 (33%) patients experienced induction failure or disease relapse. A highly methylated status of the ASNS gene was significantly more common in nonrefractory/relapsed cases (18 of 50 cases [36%]), whereas intermediately or weakly methylated status was more common in refractory/relapsed cases (23 of 25 cases [92%]) (P = .0001) (Figure 5A). In a log-rank test, the patients with weakly methylated status of the ASNS gene had significantly shorter event-free survival (EFS) and overall survival (OS) than patients with intermediately and highly methylated status (P = .00012 and .00016, respectively) (Figure 5B-C). We also investigated the association between gene expression level of the other 7q21 imprinted cluster genes and therapeutic outcome (supplemental Figure 9). Among 7 genes tested, gene expression levels of PEG10 and PDK4 were significantly higher in the refractory/relapsed cases than in the nonrefractory/relapsed cases (P = .019 and .042).
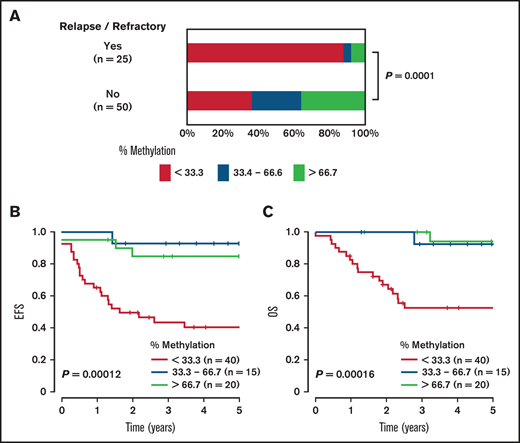
Association of ASNS methylation status with therapeutic outcome in childhood T-ALL. (A) Comparison of ASNS methylation status between refractory/relapsed cases and non-refractory/relapsed cases in childhood T-ALL. Red, yellow, and blue columns indicate ASNS highly methylated (>66.7%), intermediately methylated (33.3%-66.7%), and weakly methylated (<33.3%) cases, respectively. The P value in the χ2 test is shown. Kaplan-Meier plots of EFS (B) and OS (C) in childhood T-ALL stratified according to percent methylation of ASNS gene. The prognoses of ASNS highly methylated (>66.7%; red), intermediately methylated (33.3% -66.7%; yellow), and weakly methylated (<33.3%; blue) cases were compared. The P values in the log-rank test are shown.
Association of ASNS methylation status with therapeutic outcome in childhood T-ALL. (A) Comparison of ASNS methylation status between refractory/relapsed cases and non-refractory/relapsed cases in childhood T-ALL. Red, yellow, and blue columns indicate ASNS highly methylated (>66.7%), intermediately methylated (33.3%-66.7%), and weakly methylated (<33.3%) cases, respectively. The P value in the χ2 test is shown. Kaplan-Meier plots of EFS (B) and OS (C) in childhood T-ALL stratified according to percent methylation of ASNS gene. The prognoses of ASNS highly methylated (>66.7%; red), intermediately methylated (33.3% -66.7%; yellow), and weakly methylated (<33.3%; blue) cases were compared. The P values in the log-rank test are shown.
We then investigated the significance of genetic alternations in ASNS methylation status. We focused on the significance of SPI1 fusion, the cytogenetic abnormality associated with extremely poor prognosis.20 Among 77 Japanese cases, five cases had TCF7-SPI1 fusion and two cases had STMN1-SPI1 fusion. All 7 cases with SPI1 fusion relapsed during the follow-up periods. The EFS and OS of the patients with SPI1 fusion were significantly shorter than those of the patients with other cytogenetic abnormalities (P = .0033 and .00038, respectively) (supplemental Figure 10). Of note, SPI1 fusion–positive cases exclusively showed weakly methylated status of the ASNS gene (Figure 6A). The cases with SPI1 fusion showed significantly higher ASNS gene expression levels than the cases without it (P = .0005) (Figure 6B). Furthermore, most of the patients with TAL1 gene alternation (18 of 21 cases [86%]) also reported ASNS hypomethylation status. Although statistically insignificant, EFS and OS in the patients with TAL1 gene alternation tended to be poor. In contrast to the cases with SPI1 fusion or TAL1 gene alternation, 4 of 5 cases with PICALM-MLLT10 fusion reported highly methylated status of the ASNS gene. Neither the presence nor the absence of the NOTCH1/FBXW7 mutation was associated with ASNS methylation status (Figure 6C).
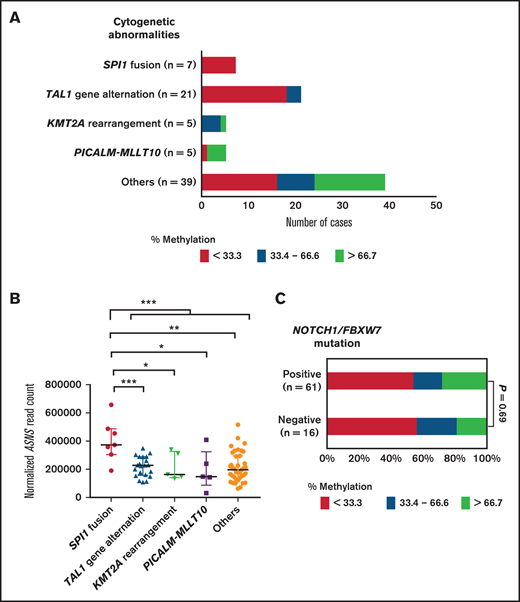
Association of ASNS methylation status with cytogenetic abnormalities in childhood T-ALL. (A) Association of cytogenetic abnormalities with ASNS methylation status in childhood T-ALL. Red, yellow, and blue columns indicate ASNS highly methylated (>66.7%), intermediately methylated (33.3%-66.7%), and weakly methylated (<33.3%) cases, respectively. (B) Association of cytogenetic abnormalities with ASNS gene expression level in childhood T-ALL. Asterisks indicate significance in the Mann-Whitney U test. **0.001 < P < .01; *0.01 < P < .05. (C) Comparison of ASNS methylation status between childhood T-ALL cases with and without NOTCH1/FBXW7 mutations. The P value in the χ2 test is shown.
Association of ASNS methylation status with cytogenetic abnormalities in childhood T-ALL. (A) Association of cytogenetic abnormalities with ASNS methylation status in childhood T-ALL. Red, yellow, and blue columns indicate ASNS highly methylated (>66.7%), intermediately methylated (33.3%-66.7%), and weakly methylated (<33.3%) cases, respectively. (B) Association of cytogenetic abnormalities with ASNS gene expression level in childhood T-ALL. Asterisks indicate significance in the Mann-Whitney U test. **0.001 < P < .01; *0.01 < P < .05. (C) Comparison of ASNS methylation status between childhood T-ALL cases with and without NOTCH1/FBXW7 mutations. The P value in the χ2 test is shown.
Taking into account that the prognosis of SPI1 fusion–positive cases was extremely poor,20 we next evaluated the association of ASNS methylation status with therapeutic outcome exclusively in SPI1 fusion–negative cases (n = 68) (supplemental Figure 11). Even in the SPI1 fusion–negative cases, a weakly methylated status of the ASNS gene was significantly associated with shorter EFS and OS (P = .0011 and .0024, respectively). Finally, a multivariate analysis was performed by using the Cox proportional hazards model (supplemental Table 3). Of note, a weakly methylated status of the ASNS gene exhibited a significantly higher impact on the hazard ratio of poor therapeutic outcome compared with the presence of the SPI1 fusion. These observations show that ASNS hypomethylation is an independent poor prognostic factor in childhood T-ALL and is at least one background factor for poor prognosis in SPI1 fusion–positive T-ALL.
Discussion
ASNS catalyzes the biosynthesis of asparagine from aspartic acid.31 In the leukemia-specific cytotoxicities of asparaginase therapy, the ASNS gene is supposed to be silenced.14,15 Consistent with this hypothesis, the present analysis of 22 T-ALL cell lines showed allele-specific methylation of the ASNS gene. Allele-specific methylation is a hallmark of genomic imprinting. However, the ASNS gene itself is not a typical imprinted gene, as we previously confirmed that it was not methylated in uniparental origin tissues.17 The ASNS gene is located adjacent to the 7q21 imprinted gene cluster. Of note, we confirmed that the methylation status of the ASNS gene was significantly correlated with that of the genes in the 7q21 imprinted gene cluster, both in the T-ALL cell lines and in the childhood T-ALL samples. These observations suggest that the ASNS gene of T-ALL cells is methylated in an allele-specific manner as a result of aberrant methylation of the imprinted gene cluster at 7q21.
The ASNS methylation status of T-ALL cell lines was clearly associated with in vitro asparaginase sensitivity. Consistent with our findings in cell lines, a recent report using primary adult T-ALL samples from patient-derived xenografts in immunodeficient mice revealed that 4 highly methylated samples were more sensitive to l-asparaginase in vitro than 4 unmethylated samples.16 In the present study, in all 5 of the highly methylated T-ALL cell lines, the IC50 value of l-asparaginase was <0.01 IU/mL. In contrast, in intermediately and weakly methylated T-ALL cell lines, the median IC50 values of l-asparaginase were 0.17 IU/mL and 0.25 IU/mL, respectively. In asparaginase therapy for patients with ALL, the target trough serum concentration is ∼0.1 IU/mL.27,28 Thus, our observations of T-ALL cell lines indicate that therapeutic concentrations of asparaginase are sufficiently effective in T-ALL cells with a highly methylated status of the ASNS gene.
For ASNS highly methylated T-ALL cell lines, our NGS analysis of bisulfate PCR products showed that both alleles of the ASNS gene were completely methylated. For ASNS highly methylated T-ALL cell lines, we also confirmed significantly lower asparaginase-induced upregulation of ASNS gene expression and basal ASNS protein expression levels. Previous study in BCP-ALL cell lines found that the ASNS gene hypermethylation is associated with a decreased ASNS enzymatic activity,32 suggesting that higher asparaginase sensitivity in ASNS highly methylated T-ALL cell lines could be caused by a decreased ASNS enzymatic activity as a result of the ASNS gene silencing. Two previous observations support this notion. One was that virous vector-mediated transduction of the ASNS complementary DNA into MOLT-4, an ASNS-unmethylated T-ALL cell line in our analysis, induced further asparaginase resistance.33 The other was that small interfering RNA–mediated ASNS knockdown in CCRF-CEM, an ASNS-unmethylated T-ALL cell line in our analysis, intensified asparaginase sensitivity.16 Considering these previous findings together with our observations in a series of T-ALL cell lines, bi-allelic methylation of the ASNS gene is directly associated with higher asparaginase sensitivity in T-ALL.
In the analysis of the childhood T-ALL cohort, the prognosis for ASNS weakly methylated cases was significantly poorer than that for intermediately and highly methylated cases. A similar result was recently reported in a study of adult cases of T-ALL.16 These observations in both childhood and adult T-ALL indicate the prognostic significance of ASNS methylation status. However, there were some discrepancies between prognoses in clinical settings and in vitro asparaginase sensitivity in T-ALL cell lines, as follows. In the therapeutic outcome in T-ALL cases, the prognoses of ASNS weakly methylated cases were significantly poorer than those of intermediately methylated cases and those of highly methylated cases. In the analyses of in vitro asparaginase sensitivity of T-ALL cell lines, no significant difference was observed between ASNS weakly methylated cell lines and ASNS intermediately methylated cell lines. In this context, it should be noted that, in our previous analyses using 84 BCP-ALL cell lines,17 the intermediately methylated cell lines were significantly more sensitive to l-asparaginase at therapeutic concentrations than in the weakly methylated cell lines. In the present study of T-ALL cell lines, asparaginase-induced upregulation of the ASNS gene expression was more significant in the ASNS weakly methylated cell lines than the intermediately methylated cell lines. Moreover, the basal ASNS protein expression level tended to be higher in the ASNS weakly methylated cell lines than in the intermediately methylated cell lines. Thus, although no significant difference was observed in in vitro asparaginase sensitivity between ASNS weakly methylated T-ALL cell lines and ASNS intermediately methylated cell lines (probably due to the limited number of T-ALL cell lines), these collateral observations in cell line analyses seem to be consistent with clinical findings that the prognoses for ASNS weakly methylated cases were significantly poorer than those for intermediately methylated cases.
Finally, we investigated the association of cytogenetic abnormalities with ASNS methylation status in childhood T-ALL. We focused on the significance of SPI1 fusion, as it is an extremely poor prognostic cytogenetic alternation.20 Of note, all 7 cases with SPI1 fusion exclusively showed ASNS hypomethylation status. In contrast, 4 of 5 cases with PICALM-MLLT10 showed ASNS hypermethylation status. These observations of ASNS methylation status are consistent, at least in part, with recent observations that DNA methylation profiles are correlated with specific oncogenic subtypes in childhood23 and adult34 T-ALL. In multivariate analysis, ASNS hypomethylation is an independent poor prognostic factor in childhood T-ALL. Thus, asparaginase resistance owing to ASNS hypomethylation could be at least one background factor for poor prognosis in the SPI1 fusion–positive T-ALL cases.
In conclusion, allele-specific methylation of the ASNS gene due to aberrant imprinting of the 7q21 imprinted gene cluster is associated with asparaginase sensitivity and therapeutic outcome in childhood T-ALL. ASNS methylation status may be a clinically useful biomarker to predict sensitivity to asparaginase therapy in patients with T-ALL. Considering the severe complications of asparaginase therapy, particularly in adolescents and adults,12,27 stratifying prospective asparaginase therapy according to ASNS methylation status may be beneficial for safer and more effective treatment of patients with T-ALL.
Acknowledgments
The authors thank the members of the TCCSG and JACLS for collecting samples and clinical information.
This work was supported by JSPS KAKENHI grant JP19H03615 and AMED grant JP19ck0106253.
Authorship
Contribution: K.A. designed and performed experiments, analyzed data, and wrote the manuscript; T. Inukai designed the research study and wrote the paper as the principal investigator; S. Kimura, T.K., K. Hata, and J.T. performed the study (analysis of patient samples); K.M. performed the study (NGS analysis of T-ALL cell lines); A.W., K. Kagami, K.Y., T.S., D.H., S. Kasai, and K.G. performed the research; N.K., K. Koh, T. Imamura, and K. Horibe provided clinical samples; A.T.L. and M.M. contributed essential cell lines; K.S. supervised the project; and all authors contributed to the final draft.
Conflict-of-interest disclosure: The authors declare no competing financial interests.
Correspondence: Koshi Akahane, Department of Pediatrics, School of Medicine, University of Yamanashi, 1110 Shimokato, Chuo, Yamanashi 409-3898, Japan; e-mail: akoushi@yamanashi.ac.jp.

