

Key Points
G9a/GLP targeting in MM induces autophagy-associated apoptosis by blocking mTOR/4EBP1 signaling and reducing c-MYC levels.
G9a/GLP targeting represents a promising strategy to improve PI-based treatment in patients with high G9a/GLP levels.

Abstract
Multiple myeloma (MM) is an (epi)genetic highly heterogeneous plasma cell malignancy that remains mostly incurable. Deregulated expression and/or genetic defects in epigenetic-modifying enzymes contribute to high-risk disease and MM progression. Overexpression of the histone methyltransferase G9a was reported in several cancers, including MM, correlating with disease progression, metastasis, and poor prognosis. However, the exact role of G9a and its interaction partner G9a-like protein (GLP) in MM biology and the underlying mechanisms of action remain poorly understood. Here, we report that high G9a RNA levels are associated with a worse disease outcome in newly diagnosed and relapsed MM patients. G9a/GLP targeting using the specific G9a/GLP inhibitors BIX01294 and UNC0638 induces a G1-phase arrest and apoptosis in MM cell lines and reduces primary MM cell viability. Mechanistic studies revealed that G9a/GLP targeting promotes autophagy-associated apoptosis by inactivating the mTOR/4EBP1 pathway and reducing c-MYC levels. Moreover, genes deregulated by G9a/GLP targeting are associated with repressive histone marks. G9a/GLP targeting sensitizes MM cells to the proteasome inhibitors (PIs) bortezomib and carfilzomib, by (further) reducing mTOR signaling and c-MYC levels and activating p-38 and SAPK/JNK signaling. Therapeutic treatment of 5TGM1 mice with BIX01294 delayed in vivo MM tumor growth, and cotreatment with bortezomib resulted in a further reduction in tumor burden and a significantly prolonged survival. In conclusion, we provide evidence that the histone methyltransferases G9a/GLP support MM cell growth and survival by blocking basal autophagy and sustaining high c-MYC levels. G9a/GLP targeting represents a promising strategy to improve PI-based treatment in patients with high G9a/GLP levels.
Introduction
Multiple myeloma (MM) is a highly heterogeneous malignancy that is characterized by the accumulation of monoclonal plasma cells in the bone marrow (BM).1 MM accounts for 10% of all hematological cancers, making it the second most common blood cancer after non-Hodgkin lymphoma.2 Despite significant improvements in the treatment of MM, most patients still relapse because they develop drug resistance. Defects in epigenetic processes, such as DNA methylation, histone modifications, and noncoding RNAs, are well known to contribute to MM pathogenesis. Given the indisputable role of these epigenetic defects in MM pathogenesis and their reversible nature, several approaches have been pursued to target the involved chromatin-modifying enzymes.3 The most clinically advanced epigenetic drug in MM is the histone deacetylase inhibitor (HDACi) panobinostat. This pan-HDACi was approved by the US Food and Drug Administration/European Medicines Agency in 2015 for the treatment of relapsed/refractory MM. However, panobinostat treatment comes with the cost of a high-risk for high-grade toxicities, thus limiting its broad application. To circumvent this, efforts are now increasingly focusing on the role of specific histone methylation marks in MM pathogenesis.3
Arginine and lysine residues of the N-terminal tails of histone 3 and 4 are methylated or demethylated by histone methyltransferases and histone demethylases, respectively, resulting in gene silencing or activation, depending on the site of methylation and the number of methyl groups added.3,4 The histone methyltransferase G9a, also known as EHMT2, mediates monomethylation of histone 3 lysine 9 (H3K9me) and dimethylation of histone 3 lysine 9 (H3K9me2). In general, H3K9me and H3K9me2 are associated with heterochromatin formation and gene silencing.3,5 In addition, G9a acts as a scaffolding protein for other chromatin-associated molecules like heterochromatin protein 1, which, in turn, recruits DNA methyltransferase 1 (DNMT1) to the DNA, thus further enforcing transcriptional silencing.3 Recently, G9a was also shown to facilitate MYC-mediated transcriptional repression by directly interacting with MYC through the MYC box II region.6 An important interaction partner of G9a is the highly homologous G9a-like protein (GLP). Formation of this heterodimeric structure appears crucial for in vivo methyltransferase activity, because loss of G9a or GLP reduces H3K9me/H3K9me2 levels.3,7
G9a is overexpressed in many cancer types, including MM, resulting in the repression of tumor suppressor genes, like p53, CDH1, RUNX3, and E-cadherin.3,8 High G9a expression is often associated with poor prognosis; G9a targeting, using short hairpin RNA (shRNA) or specific small molecule inhibitors, inhibits proliferation, migration, and metastasis of cancer cells.3,4,9,10 A recent study showed that simultaneous targeting of DNMTs and G9a in acute myeloid leukemia, acute lymphoblastic leukemia, and diffuse large B-cell lymphoma cell lines using the dual G9a/DNMT inhibitor CM-272 inhibits proliferation and promotes apoptosis by inducing interferon-stimulated genes and immunogenic cell death.11 Moreover, CM-272 significant prolonged the survival of acute myeloid leukemia, acute lymphoblastic leukemia, and diffuse large B-cell lymphoma xenograft mice. The investigators also suggested a potential role for G9a in MM, because CM-272 decreased the viability of human MM cell lines (HMCLs), but they did not determine the exact contribution of G9a in CM-272-mediated MM cell death. In MM, copy number amplifications of G9a occur frequently in patient samples.12 Moreover, only very recently was G9a shown to be overexpressed in HMCLs, and G9a shRNA inhibited proliferation in vitro and tumorigenesis in xenograft mice.8 However, the mechanisms of action were not thoroughly investigated nor was the capacity to boost the antimyeloma activity of proteasome inhibitors (PIs). Moreover, to the best of our knowledge, no study has investigated the expression or prognostic value of GLP in MM patients or validated the therapeutic value of G9a/GLP targeting using primary human MM samples and syngeneic immunocompetent murine myeloma models.
Here, we investigated the expression and prognostic value of G9a and GLP in MM patients and the therapeutic potential of G9a/GLP targeting using a large panel of cell lines, primary MM samples, and the fully immunocompetent murine 5TGM1 model. In addition, we explored the potential of G9a/GLP targeting to boost the antimyeloma activity of PIs.
Methods
Cell lines
The HMCLs AMO-1, OPM-2, and LP-1 were obtained from ATCC (Molsheim, France). These HMCLs and the murine MM cell lines 5T33MMvt and 5TGM1 were cultured in RPMI 1640 medium, supplemented with 10% fetal calf serum (Biochrom, Berlin, Germany) and 2 mM l-glutamine. The interleukin-6 (IL-6)–dependent cell lines XG-1, XG-2, XG-7, XG-11, XG-19, XG-20, and XG-24 were obtained as previously described and maintained in the presence of 2 ng/mL recombinant IL-6 (R&D Systems, Oxon, UK), 10% fetal calf serum, and 2 mM l-glutamine.13 Cell line identity was regularly checked by short-tandem repeat analysis, and cells were regularly screened for mycoplasma contamination.
Mice
C57Bl/KaLwRij mice were purchased from Envigo (Horst, The Netherlands). Mice were housed and treated following conditions approved by the Ethical Committee for Animal Experiments, Vrije Universiteit Brussel (CEP 14-281-5). The 5TGM1 model originated from aging C57BL/KaLwRij mice that spontaneously developed 5T33MM.14 At day 0, naive C57BL/KaLwRij mice were injected with 2 × 10⁶ 5TGM1 cells containing firefly luciferase.15 In the first experiment, mice were treated 3 times a week with 20 mg/kg BIX01294 for 2 weeks via intraperitoneal injection in a therapeutic setting; injections started at the moment of established disease (day 14). Tumor development was monitored by noninvasive in vivo bioluminescence imaging (BLI) measuring total photon flux at day 30 using a Biospace Laboratory Photo Imager. d-Luciferin (Promega, Madison, WI) was administrated IV. When individual mice showed signs of morbidity, they were euthanized. In a second experiment, mice with established disease were treated with BIX01294 (10 mg/kg, intraperitoneal injection, 3 times per week) and/or bortezomib (0.6 mg/kg, subcutaneous injection, 2 times per week). When vehicle mice showed signs of morbidity, all mice were euthanized, and the effect on BM plasmacytosis was analyzed. BM mononuclear cells were isolated and spotted onto microscope slides using a cytocentrifuge. The slides were stained with May-Grünwald-Giemsa stain for manual counting of BM plasmacytosis. Finally, in a third experiment, mice with established disease were treated similarly to the second experiment, but the effect on overall survival (OS) was analyzed.
Gene expression data
The expression and prognostic value of G9a and GLP messenger RNA (mRNA) in terms of OS were determined using publicly available RNA-sequencing (RNAseq) data from newly diagnosed MM patients from the Multiple Myeloma Research Foundation’s (MMRF) CoMMpass study (https://research.themmrf.org/; release IA12). In addition, we performed RNAseq analysis on BM samples collected from 68 patients treated with high-dose melphalan and autologous stem cell transplantation. BM samples were collected after patients provided written informed consent in accordance with the Declaration of Helsinki and institutional research board approval from Montpellier University Hospital. MM cells were purified using anti-CD138 MACS MicroBeads (Miltenyi Biotec, Bergisch Gladbach, Germany). We termed this validation cohort “the Montpellier cohort.” We also used Affymetrix data from relapsed MM patients subsequently treated with bortezomib (GSE9782) from the study by Mulligan et al.16 To determine the effect of G9a/GLP targeting on gene expression, OPM-2, XG-20, and XG-24 cells were cultured for 24 hours with/without 5 μM BIX01294 or UNC0638. RNA samples were collected as previously described, and their gene expression profiles (GEPs) were obtained using Affymetrix U133 plus 2.0 microarrays.17
Statistical analysis
Statistical analysis was performed using GraphPad Prism 5.0 software and GenomicScape. A Mann-Whitney U test and 1-way analysis of variance was used to compare 2 groups or multiple groups, respectively. GEP data were normalized with MAS5 algorithm and analyzed with GenomicScape and R and Bioconductor programs.18,19 Gene set expression analysis (GSEA) was used to identify genes and pathways that were differentially expressed. The difference in OS was assayed with a log-rank test, and survival curves were plotted using the Kaplan-Meier method. The prognostic value of G9a and GLP was computed using a maximally selected rank test from the R package maxstat, which allowed us to determine the optimal cut point for continuous variables.20
For further details and other methods, see supplemental Methods.
Results
High G9a levels are associated with a worse outcome in MM patients
First, we evaluated G9a and GLP mRNA levels in newly diagnosed patients using the publicly available RNAseq data from 674 patients in the MMRF CoMMpass study. G9a and GLP were found to be heterogeneously expressed (Figure 1A). Next, we analyzed the relationship between G9a and GLP mRNA levels and disease outcome using the Maxstat R algorithm.21 Patients with high G9a RNA levels had a significantly worse outcome than did patients with low levels (Figure 1B). These findings were validated in a second independent cohort of newly diagnosed patients (the Montpellier cohort; n = 68) and in a cohort of 188 patients treated with bortezomib monotherapy after relapse (Figure 1C-D). In contrast, no significant association between GLP expression and outcome was identified in the different cohorts (supplemental Figure 1). Together, these findings demonstrate that G9a is an adverse prognostic factor in MM, and high G9a expression is associated with MM disease progression.
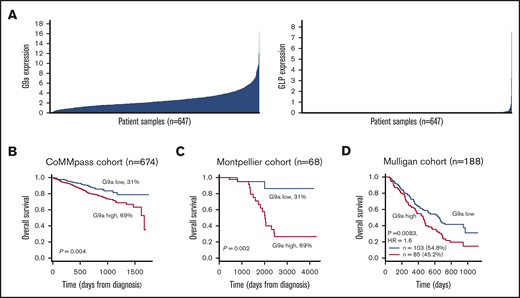
Prognostic value and expression of G9a and GLP in MM. (A) The expression profile of G9a and GLP was investigated in the MMRF cohort (n = 674). (B-D) The prognostic value of G9a in terms of OS was determined in newly diagnosed MM patients using the MMRF cohort (B; n = 674) and the Montpellier cohort (C; n = 68), as well as in relapsed MM patients from the Mulligan cohort (D; n = 188). Maxstat analysis was used to calculate the optimal separation of patients based on a cutoff value.
Prognostic value and expression of G9a and GLP in MM. (A) The expression profile of G9a and GLP was investigated in the MMRF cohort (n = 674). (B-D) The prognostic value of G9a in terms of OS was determined in newly diagnosed MM patients using the MMRF cohort (B; n = 674) and the Montpellier cohort (C; n = 68), as well as in relapsed MM patients from the Mulligan cohort (D; n = 188). Maxstat analysis was used to calculate the optimal separation of patients based on a cutoff value.
G9a/GLP targeting impairs growth and survival of MM cells
To investigate the role of G9a/GLP in MM, we first assessed the effect of the small molecule G9a/GLP inhibitors BIX01294 and UNC0638 on MM cell viability using a panel of 10 HMCLs. G9a/GLP targeting resulted in a clear decrease in MM cell viability in most cell lines, with 50% inhibitory concentration (IC50) values ranging between 1.2 and 3.39 µM and between 2.71 and 7.4 µM for BIX01294 and UNC0638, respectively (Figure 2A). Subsequent flow cytometric analysis revealed a significant decrease in the number of cells in the S phase, together with a clear accumulation of cells in the G0/G1 phase, in OPM-2 and XG-20 cells when they were treated with either inhibitor at 5 µM (Figure 2B; supplemental Figure 2). Treatment with BIX01294 also significantly increased the percentage of Ki67− cells associated with quiescence and the number of apoptotic cells (Figure 2C-D). Finally, BIX01294 treatment reduced viability of primary human CD138+ MM cells in most patient samples tested (n = 12; Figure 2E). Patient characteristics are provided in supplemental Table 1.
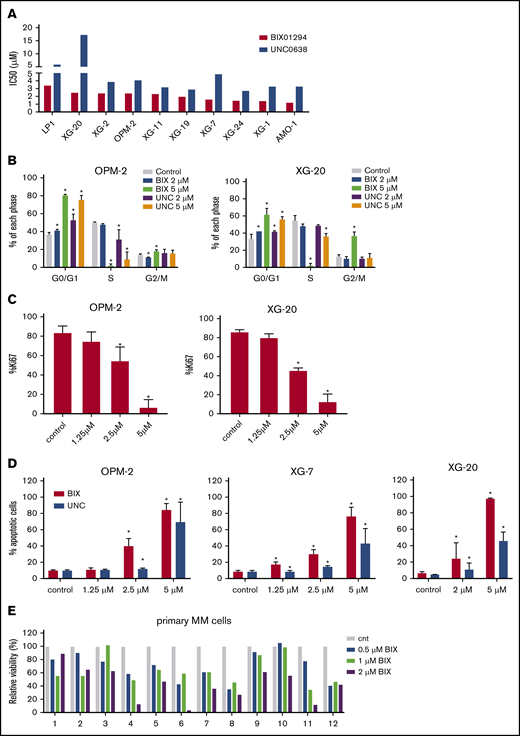
Effect of G9a/GLP targeting on MM cell viability, proliferation, and apoptosis. (A) Effect of UNC0638 or BIX01294 on cell viability. Cells were treated with increasing doses of UNC0638 and BIX01294. Four days later, cell viability was assessed using a CellTiter-Glo Luminescent Cell Viability Assay. Data are based on at least 3 independent experiments. (B-C) Effect of UNC0638 (UNC) or BIX01294 (BIX) on proliferation. OPM-2 and XG-20 cells were treated with the indicated concentrations of UNC0638 or BIX01294 for 48 and 72 hours. Using flow cytometry, cell cycle profiles based on DNA content were obtained after 72 hours (B), and Ki67 levels were obtained after 48 hours (C). Data are mean ± standard deviation (SD) of 3 independent experiments. (D) Effect of UNC or BIX on apoptosis. OPM-2 (left panel), XG-7 (middle panel), and XG-20 (right panel) cells were treated with the indicated doses of UNC or BIX for 48 hours. The effect on apoptosis was assessed using Annexin V-APC/7-aminoactinomycin D (7-AAD) staining, followed by flow cytometric analysis. The percentage of apoptotic cells is the sum of the percentage of Annexin V+ and Annexin V+/7-AAD+ cells. Data represent the mean ± SD of 3 independent experiments. (E) Effect of BIX on primary human CD138+ MM cells. Mononuclear cells from 12 MM patients were treated with increasing doses of BIX and cultured in the presence of IL-6 (1 ng/mL). At day 4, the percentage of viable CD138+ plasma cells was determined by flow cytometry. Bars represent values relative to control (cnt). *P < .05 vs control.
Effect of G9a/GLP targeting on MM cell viability, proliferation, and apoptosis. (A) Effect of UNC0638 or BIX01294 on cell viability. Cells were treated with increasing doses of UNC0638 and BIX01294. Four days later, cell viability was assessed using a CellTiter-Glo Luminescent Cell Viability Assay. Data are based on at least 3 independent experiments. (B-C) Effect of UNC0638 (UNC) or BIX01294 (BIX) on proliferation. OPM-2 and XG-20 cells were treated with the indicated concentrations of UNC0638 or BIX01294 for 48 and 72 hours. Using flow cytometry, cell cycle profiles based on DNA content were obtained after 72 hours (B), and Ki67 levels were obtained after 48 hours (C). Data are mean ± standard deviation (SD) of 3 independent experiments. (D) Effect of UNC or BIX on apoptosis. OPM-2 (left panel), XG-7 (middle panel), and XG-20 (right panel) cells were treated with the indicated doses of UNC or BIX for 48 hours. The effect on apoptosis was assessed using Annexin V-APC/7-aminoactinomycin D (7-AAD) staining, followed by flow cytometric analysis. The percentage of apoptotic cells is the sum of the percentage of Annexin V+ and Annexin V+/7-AAD+ cells. Data represent the mean ± SD of 3 independent experiments. (E) Effect of BIX on primary human CD138+ MM cells. Mononuclear cells from 12 MM patients were treated with increasing doses of BIX and cultured in the presence of IL-6 (1 ng/mL). At day 4, the percentage of viable CD138+ plasma cells was determined by flow cytometry. Bars represent values relative to control (cnt). *P < .05 vs control.
To validate the role of G9a in the antimyeloma effects mediated by BIX01294/UNC0638, we performed loss-of-function studies. XG-7 cells were transduced with doxycycline-inducible lentiviral constructs expressing 3 shRNAs targeting G9a (shG9a#1-3). All three shG9a constructs strongly reduced G9a RNA and protein levels when doxycycline was added compared with control (Figure 3A-B). Moreover, genetic depletion of G9a by shG9a construct 1 (shG9a#1) strongly reduced MM cell growth (Figure 3C).
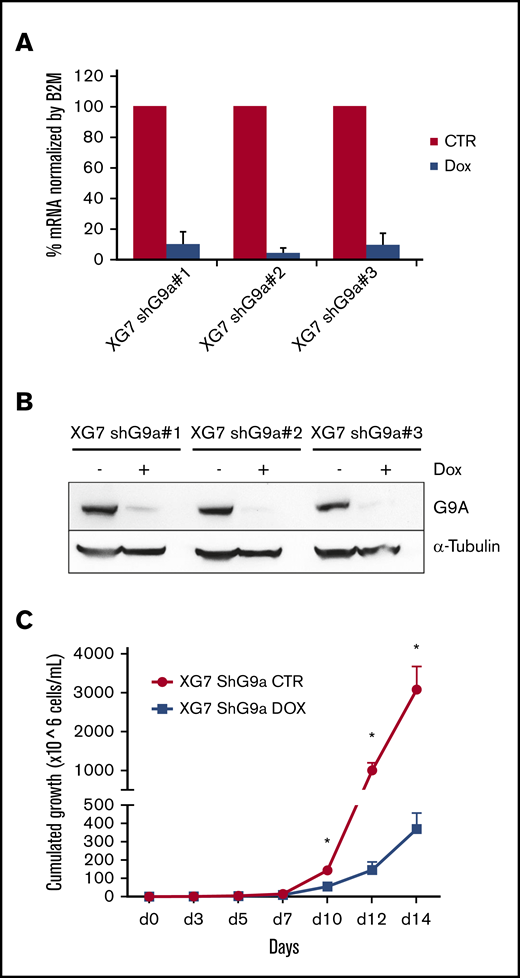
Effect of inducible knockdown of G9a. (A-B) Validation of G9a knockdown. XG-7 cells were transduced with 3 shG9a constructs and cultured or not with doxycycline (Dox; 1 mg/mL) for 3 or 5 days, after which G9a RNA (A) and protein (B) levels were analyzed using qRT-PCR and western blot, respectively. For the qRT-PCR data, data represent the mean ± standard deviation (SD) of 3 independent experiments. For the western blot data, tubulin was used as loading control, and 1 experiment representative of 3 experiments is shown. (C) Effect of G9a knockdown on cumulative cell growth. XG-7 cells transduced with shG9a#1 were cultured or not with doxycycline (DOX; 1 mg/mL) for 14 days. Cumulative cell counts were measured using trypan blue staining at the indicated time points. Results are mean ± SD of 4 independent experiments. *P < .05 vs control (CTR).
Effect of inducible knockdown of G9a. (A-B) Validation of G9a knockdown. XG-7 cells were transduced with 3 shG9a constructs and cultured or not with doxycycline (Dox; 1 mg/mL) for 3 or 5 days, after which G9a RNA (A) and protein (B) levels were analyzed using qRT-PCR and western blot, respectively. For the qRT-PCR data, data represent the mean ± standard deviation (SD) of 3 independent experiments. For the western blot data, tubulin was used as loading control, and 1 experiment representative of 3 experiments is shown. (C) Effect of G9a knockdown on cumulative cell growth. XG-7 cells transduced with shG9a#1 were cultured or not with doxycycline (DOX; 1 mg/mL) for 14 days. Cumulative cell counts were measured using trypan blue staining at the indicated time points. Results are mean ± SD of 4 independent experiments. *P < .05 vs control (CTR).
G9a/GLP targeting induces autophagy-associated apoptosis in MM cells
Next, we investigated the molecular mechanisms underlying the antimyeloma activity of G9a/GLP inhibition. To confirm the on-target effects of BIX01294, we first evaluated the effect on H3K9 methylation levels. BIX01294 strongly reduced H3K9me2 and/or H3K9me3 levels (the latter only in OPM-2 cells) while leaving H3K9me levels largely unaffected, thus confirming effective inhibition of G9a/GLP enzymatic activity under these treatments (Figure 4A). In addition, genetic inhibition of G9a (shG9a#1-3) resulted in a similar decrease in H3K9me2 and H3K9me3 levels (Figure 4B).
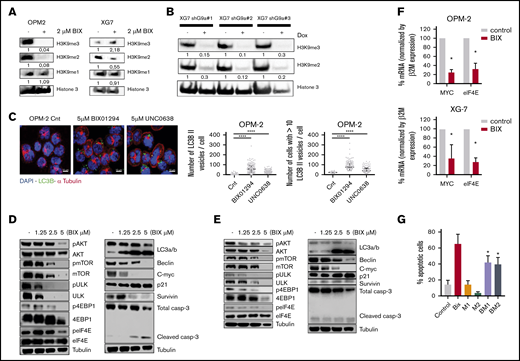
Underlying mechanisms of action of G9a/GLP targeting in MM. (A-B) Effect of G9a/GLP targeting on H3K9me1-3 levels. (A) Western blot analysis of H3K9me1, H3K9me2, and H3K9me3 levels in OPM-2 cells (left panel) and XG-7 cells (right panel) after 96 hours of treatment with or without BIX01294 (BIX; 2 µM). (B) XG-7 cells transduced with 3 shG9a constructs were cultured or not with doxycycline (Dox; 1 mg/mL) for 7 days, after which H3K9me2 and H3K9me3 levels were analyzed by western blot. Histone 3 was used as loading control; 1 experiment representative of 3 experiments is shown. Quantification and normalization were performed with ImageJ, and quantification relative to the control condition is shown. (C) Effect of G9a/GLP targeting on autophagy. Immunofluorescence staining for DAPI, LC3B, and α-tubulin on OPM-2 and XG-20 cells, treated or not with 5 µM BIX01294 or UNC0638 for 24 hours. Scale bars, 10 µm. Photographs shown are representative of 1 experiment; quantification data are based on 3 independent experiments. ****P < .001. (D-E) Western blot analysis of involved signaling pathways and downstream targets. OPM-2 cells (D) and XG-7 cells (E) were treated with 1.25 µM, 2.5 µM, or 5 µM BIX01294 for 24 hours, after which whole-cell lysates were analyzed for the indicated proteins. Tubulin was used as loading control; 1 experiment representative of 3 experiments is shown. (F) mRNA expression levels of MYC and eIF4E in OPM-2 cells (upper panel) and XG-7 cells (lower panel) treated or not with 5 µM BIX01294 (BIX) for 24 hours. Data are mean ± standard deviation (SD) of 3 independent experiments. *P < .05. (G) Effect of the autophagy inhibitor 3-ME on BIX01294 (BIX)-induced cell death. OPM-2 cells were treated for 4 hours with 3-ME (1 and 2 mM), after which BIX (2.5 µM) was added for an additional 48 hours. The effect on apoptosis was assessed using Annexin V-APC/7-aminoactinomycin D (7-AAD), followed by flow cytometric analysis. The percentage of apoptotic cells is the sum of the percentage of Annexin V+ and Annexin V+/7-AAD + cells. Data are mean ± SD of 3 independent experiments. *P < .05 vs Bix alone.
Underlying mechanisms of action of G9a/GLP targeting in MM. (A-B) Effect of G9a/GLP targeting on H3K9me1-3 levels. (A) Western blot analysis of H3K9me1, H3K9me2, and H3K9me3 levels in OPM-2 cells (left panel) and XG-7 cells (right panel) after 96 hours of treatment with or without BIX01294 (BIX; 2 µM). (B) XG-7 cells transduced with 3 shG9a constructs were cultured or not with doxycycline (Dox; 1 mg/mL) for 7 days, after which H3K9me2 and H3K9me3 levels were analyzed by western blot. Histone 3 was used as loading control; 1 experiment representative of 3 experiments is shown. Quantification and normalization were performed with ImageJ, and quantification relative to the control condition is shown. (C) Effect of G9a/GLP targeting on autophagy. Immunofluorescence staining for DAPI, LC3B, and α-tubulin on OPM-2 and XG-20 cells, treated or not with 5 µM BIX01294 or UNC0638 for 24 hours. Scale bars, 10 µm. Photographs shown are representative of 1 experiment; quantification data are based on 3 independent experiments. ****P < .001. (D-E) Western blot analysis of involved signaling pathways and downstream targets. OPM-2 cells (D) and XG-7 cells (E) were treated with 1.25 µM, 2.5 µM, or 5 µM BIX01294 for 24 hours, after which whole-cell lysates were analyzed for the indicated proteins. Tubulin was used as loading control; 1 experiment representative of 3 experiments is shown. (F) mRNA expression levels of MYC and eIF4E in OPM-2 cells (upper panel) and XG-7 cells (lower panel) treated or not with 5 µM BIX01294 (BIX) for 24 hours. Data are mean ± standard deviation (SD) of 3 independent experiments. *P < .05. (G) Effect of the autophagy inhibitor 3-ME on BIX01294 (BIX)-induced cell death. OPM-2 cells were treated for 4 hours with 3-ME (1 and 2 mM), after which BIX (2.5 µM) was added for an additional 48 hours. The effect on apoptosis was assessed using Annexin V-APC/7-aminoactinomycin D (7-AAD), followed by flow cytometric analysis. The percentage of apoptotic cells is the sum of the percentage of Annexin V+ and Annexin V+/7-AAD + cells. Data are mean ± SD of 3 independent experiments. *P < .05 vs Bix alone.
Because many studies have shown a clear role for G9a in negatively regulating autophagy, we next performed immunofluorescent staining for microtubule-associated protein light chain B (LC3B-II) and α-tubulin.22-24 As expected, we observed a clear increase in LC3B-II puncta in MM cells upon treatment with BIX01294 or UNC0638 (Figure 4C; supplemental Figure 3). This increase was also confirmed by western blot (Figure 4D-E). Western blot analysis further showed that BIX01294 blocks mTORC1-mediated autophagy inhibition and mTORC1-mediated protein translation, as evidenced by decreased phosphorylation of Akt at serine residue (Ser)473, ULK at Ser757, mTOR at Ser2448, 4EBP1 at Thr37/46, and eIF4E at Ser209. BIX01294 treatment also strongly reduced beclin and c-MYC levels, while increasing p21 levels (Figure 4D-E). Importantly, although BIX01294 also moderately increased the amount of active caspase 3/7, addition of the pan-caspase inhibitor Q-VD-OPh did not rescue the cells from BIX01294- or UNC0638-mediated cell death compared with melphalan-induced cell death, suggesting that the observed apoptosis is not caspase dependent (supplemental Figure 4). In line with the western blot data, quantitative reverse transcription polymerase chain reaction (qRT-PCR) also revealed a strong reduction in c-MYC mRNA levels and deregulation of genes involved in autophagy regulation, including downregulation of mTOR and eIF4E and upregulation of ATG4 (Figure 4F; supplemental Figure 5). Finally, we found that the well-known autophagy inhibitor 3-methyladenine (3-ME)25 partially protected MM cells against BIX01294-mediated apoptosis, further confirming the role of autophagy induction in BIX01294/UNC0638-mediated cell death (Figure 4G).
Genes deregulated by G9a/GLP targeting are associated with repressive marks
To analyze transcriptional programs regulated by G9a/GLP in MM cells, OPM-2, XG-20, and XG-24 cells were treated with BIX01294 or UNC0638 for 24 hours, and GEP was analyzed using Affymetrix microarrays. Ninety-one genes were significantly upregulated and 23 were downregulated in the treated cells compared with control (fold change ≥1.5; false-discovery rate ≤0.05; supplemental Figure 6; supplemental Table 2). GSEA analysis revealed a significant enrichment in polycomb PRC2 target genes, genes associated with DNA methylation, histone deacetylase targets, and genes involved in immune response, interferon, and chemokine pathways (Figure 5A). Among the upregulated genes, we validated increased expression of CCL3, an important chemokine implicated both in immune surveillance and tolerance,26 using qRT-PCR (Figure 5B). Importantly, 73 of the upregulated genes were associated with the H3K9me3 mark (Figure 5C; supplemental Table 3). We also identified EGR2, described as a tumor suppressor gene in MM; TRIM69, which is involved in autophagy; CASP1, which takes part in the activation of pyroptosis and inflammasome; and UBE2QL1, which is involved in ubiquitination and degradation of mTOR (supplemental Figure 7).27-30
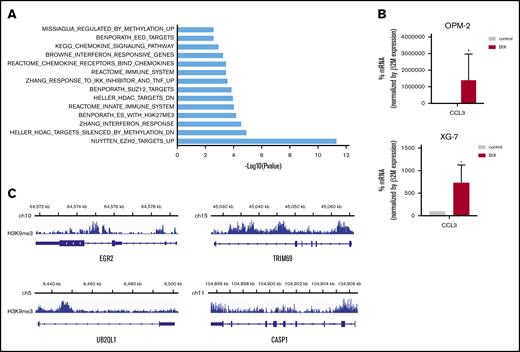
Association of G9a/GLP targeting and epigenetic repressive marks. (A) Molecular signature of G9a/GLPi target genes in 3 HMCLs (OPM-2, XG20, and XG24) was investigated using the GSEA database (all curated gene sets), and relevant pathways are presented (FDR q value ≤ 0.05). (B) mRNA expression levels of CCL3 in OPM-2 cells (upper panel) and XG-7 cells (lower panel) that were treated or not with 5 µM BIX01294 for 24 hours. Data represent mean ± SD of 3 independent experiments (C) Integrative genomics viewer visualization of H3K9me3 enrichment on EGR2, TRIM69, UB2QL1, and CASP1 genes in XG-7 cells. *P < .05.
Association of G9a/GLP targeting and epigenetic repressive marks. (A) Molecular signature of G9a/GLPi target genes in 3 HMCLs (OPM-2, XG20, and XG24) was investigated using the GSEA database (all curated gene sets), and relevant pathways are presented (FDR q value ≤ 0.05). (B) mRNA expression levels of CCL3 in OPM-2 cells (upper panel) and XG-7 cells (lower panel) that were treated or not with 5 µM BIX01294 for 24 hours. Data represent mean ± SD of 3 independent experiments (C) Integrative genomics viewer visualization of H3K9me3 enrichment on EGR2, TRIM69, UB2QL1, and CASP1 genes in XG-7 cells. *P < .05.
BIX01294 delays tumor progression in vivo
Next, we wanted to validate the antimyeloma activity of G9a/GLP targeting in vivo using the syngeneic immunocompetent murine 5TMM models. For this, we first confirmed antimyeloma activity in vitro using murine cell lines 5T33MMvt and 5TGM1 and primary murine 5T33MMvv cells. Again, BIX01294 and UNC0638 potently reduced MM cell viability and induced apoptosis (Figure 6A-B). Because BIX01294 is known to have a narrow therapeutic window,31 we first evaluated the effect of 2 weeks of BIX01294 treatment (10 and 20 mg/kg) on white blood cell, red blood cell, and platelet counts, as well as hemoglobin levels, in naive mice. We observed no major changes in these hematological parameters upon treatment with BIX01294 (supplemental Figure 8). Next, we studied the in vivo effect of BIX01294 treatment in the 5TGM1 model. Mice with established disease were treated therapeutically with BIX01294 (20 mg/kg) for 2 weeks (Figure 6C). Tumor development was monitored on day 30 postinoculation by noninvasive in vivo BLI. BIX01294 treatment strongly reduced tumor burden compared with vehicle (Figure 6D). Moreover, BIX01294 monotherapy significantly prolonged OS of 5TGM1-inoculated mice compared with vehicle (Figure 6E).
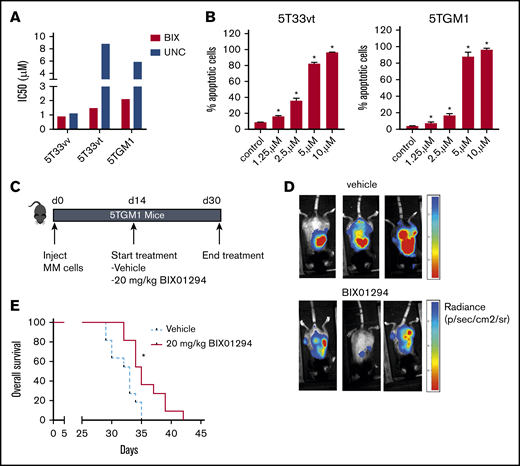
Effect of BIX01294 treatment on tumor progression in the murine 5TGM1 model. Effect of G9a/GLP targeting on murine MM cell viability (A) and apoptosis (B). (A) The murine MM cell lines 5T33vv, 5T33vt, and 5TGM1 were treated with increasing doses of UNC0638 (UNC) and BIX01294 (BIX). After 4 days, cell viability was assessed using a CellTiter-Glo Luminescent Cell Viability Assay. Data are based on ≥3 independent experiments. (B) Effect of BIX01294 on apoptosis. 5T33vt and 5TGM1 cells were treated with the indicated doses of BIX01294 for 48 hours. The effect on apoptosis was assessed using Annexin V-APC/7-aminoactinomycin D (7-AAD) staining, followed by flow cytometric analysis. The percentage of apoptotic cells is the sum of the percentage of Annexin V+ and Annexin V+/7-AAD + cells. Data are mean ± standard deviation of 3 independent experiments. (C-E) Effect of G9a/GLP targeting on tumor burden and OS in the murine 5TGM1 model. (C) Scheme depicting the experimental setup. Mice were inoculated with 5TGM1 cells and treated for 14 days with vehicle (n = 11) or with 10 mg/kg BIX01294 (n = 11) 3 times a week. Treatment started 14 days after tumor inoculation. (D) Tumor burden was monitored at day 30 by BLI measuring total photon flux. BLI images from 3 mice from each treatment group are shown. (E) Effect of BIX01294 on OS. Difference in OS was assayed with a log-rank test, and survival curves were plotted using the Kaplan-Meier method. *P < .05.
Effect of BIX01294 treatment on tumor progression in the murine 5TGM1 model. Effect of G9a/GLP targeting on murine MM cell viability (A) and apoptosis (B). (A) The murine MM cell lines 5T33vv, 5T33vt, and 5TGM1 were treated with increasing doses of UNC0638 (UNC) and BIX01294 (BIX). After 4 days, cell viability was assessed using a CellTiter-Glo Luminescent Cell Viability Assay. Data are based on ≥3 independent experiments. (B) Effect of BIX01294 on apoptosis. 5T33vt and 5TGM1 cells were treated with the indicated doses of BIX01294 for 48 hours. The effect on apoptosis was assessed using Annexin V-APC/7-aminoactinomycin D (7-AAD) staining, followed by flow cytometric analysis. The percentage of apoptotic cells is the sum of the percentage of Annexin V+ and Annexin V+/7-AAD + cells. Data are mean ± standard deviation of 3 independent experiments. (C-E) Effect of G9a/GLP targeting on tumor burden and OS in the murine 5TGM1 model. (C) Scheme depicting the experimental setup. Mice were inoculated with 5TGM1 cells and treated for 14 days with vehicle (n = 11) or with 10 mg/kg BIX01294 (n = 11) 3 times a week. Treatment started 14 days after tumor inoculation. (D) Tumor burden was monitored at day 30 by BLI measuring total photon flux. BLI images from 3 mice from each treatment group are shown. (E) Effect of BIX01294 on OS. Difference in OS was assayed with a log-rank test, and survival curves were plotted using the Kaplan-Meier method. *P < .05.
G9a/GLP targeting potentiates the anti-MM effect of PIs
We also investigated whether BIX01294 could increase the therapeutic benefit of the PIs bortezomib and carfilzomib. Cotreatment of MM cells with bortezomib and BIX01294 strongly increased the number of apoptotic cells compared with either single agent alone in murine cell lines, but not in the HMCL (supplemental Figure 9). Nevertheless, combination experiments using the second-generation PI carfilzomib significantly and synergistically increased the percentage of apoptotic cells compared with single-agent therapy in murine cells and in the HMCL (Figure 7A; supplemental Figure 9). Importantly, the combinatory effect was also confirmed when targeting G9a via genetic depletion using shG9a#1 in XG-7 cells (IC50 of 0.0261 nM for doxycycline compared with 0.358 nM for control; Figure 7B) and primary MM cells (Figure 7C; patient characteristics are provided in supplemental Table 4). In contrast, we observed only minimal (combinatory) effects of BIX01294 and/or carfilzomib on the nonmyeloma fraction of the primary BM samples (supplemental Figure 8). Moreover, shG9a#1 did not sensitize XG-7 cells to the immunomodulating agent lenalidomide and only minimally to pomalidomide (supplemental Figure 9). Western blot analysis revealed that the increased sensitivity toward PIs was associated with a further reduction in mTOR signaling and c-MYC levels and an increase in p-38 and SAPK/JNK signaling (Figure 7D). In a proof-of-principle study, we then investigated the combination of BIX01294 and bortezomib in vivo. In a first experiment, 5TGM1 mice with established disease were treated with a suboptimal dose of bortezomib and/or BIX01294 in a therapeutic setting (Figure 7E), and the effect on tumor burden was evaluated. We observed a significant reduction in BM plasmacytosis in mice treated with bortezomib (P < .05) and the combination (P < .001) compared with vehicle-treated mice. Moreover, although not significant, we observed a clear trend for a further reduction in tumor burden in combination-treated mice vs bortezomib-treated mice (Figure 7E). Of note, we observed no significant weight loss upon 2 weeks of treatment with BIX01294 and/or bortezomib (supplemental Figure 8). Finally, in a second experiment, we also evaluated the effect on OS. In line with the effects on tumor burden, a suboptimal dose of BIX01294 did not change the OS of 5TGM1-inoculated mice (Figure 7F). In contrast, and as expected, bortezomib significantly prolonged OS of 5TGM1 mice, with a median survival of 41 days compared with 35 days for vehicle-treated mice. Importantly, combining bortezomib with BIX01294 further prolonged OS of the mice compared with treatment with either agent alone (median survival of 48 days, P < .05), thus again confirming that BIX01294 boosts the antimyeloma activity of PIs.
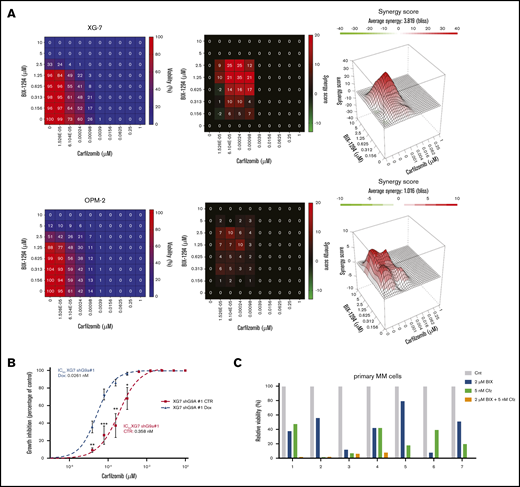
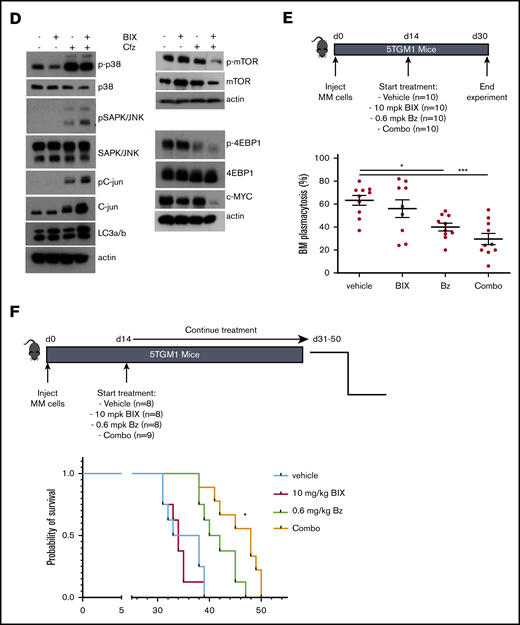
Effect of BIX01294 on MM cell sensitivity to PIs. (A-C) Effect of G9a/GLP targeting on carfilzomib-induced cell death. (A) Effect of carfilzomib and/or BIX01294 (BIX-1294) treatment on human cell lines. Human OPM-2 (lower panel) and XG-7 (upper panel) cells were treated with the indicated concentrations of carfilzomib and/or BIX-1294 for 4 days. The viability was determined using a CellTiter-Glo assay, and synergy scores were calculated using the Bliss method. Results are the mean of 3 independent experiments. (B) Effect of G9a knockdown on carfilzomib-induced cell death. Transduced XG-7 shG9a#1 cells were cultured with increasing doses of carfilzomib 3 days after treatment or not with doxycycline (Dox) for an additional 4 days. The viability was determined using a CellTiter-Glo assay. Results are mean ± standard deviation of 4 independent experiments. *P < .05, **P < .005, ***P < .001. (C) Effect of carfilzomib (Cfz) and/or BIX01294 (BIX) treatment on primary human CD138+ MM cells. Mononuclear cells from 7 MM patients were treated with the indicated concentrations for 4 days, and the percentage of viable CD138+ plasma cells was determined by flow cytometry. Results are expressed as the relative viability compared with control (Cnt). (D) Western blot analysis of the mechanisms underlying the increased carfilzomib (Cfz) sensitivity upon BIX01294 (BIX) treatment. XG-7 cells were treated with BIX01294 (2 µM) and/or carfilzomib (2 nM) for 24 hours, after which western blot analysis was performed on whole-cell lysates for the indicated proteins. Actin was used as loading control, and 1 experiment representative of 3 experiments is shown. (E-F) Effect of BIX01294 (BIX), bortezomib (Bz), and combination (Combo) treatment on tumor burden (E) and survival (F) in the murine 5TGM1 model. Mice were inoculated with 5TGM1 cells and assigned to different treatment groups: vehicle, 10 mg/kg (mpk) BIX, 0.6 mg/kg (mpk) Bz, or BIX plus Bz (Combo). The number of mice per treatment group and the treatment scheme are indicated in the schematic overview (upper panel). To determine the effect on tumor burden (E), all mice were euthanized when the first mouse showed obvious signs of morbidity. *P < .05, ***P < .001. (F) To determine the effect on OS, each mouse was euthanized individually when showing clear signs of morbidity, and the effect on survival rates was determined by Kaplan-Meier analysis. *P < .05 vs treatment with Bz alone.
Effect of BIX01294 on MM cell sensitivity to PIs. (A-C) Effect of G9a/GLP targeting on carfilzomib-induced cell death. (A) Effect of carfilzomib and/or BIX01294 (BIX-1294) treatment on human cell lines. Human OPM-2 (lower panel) and XG-7 (upper panel) cells were treated with the indicated concentrations of carfilzomib and/or BIX-1294 for 4 days. The viability was determined using a CellTiter-Glo assay, and synergy scores were calculated using the Bliss method. Results are the mean of 3 independent experiments. (B) Effect of G9a knockdown on carfilzomib-induced cell death. Transduced XG-7 shG9a#1 cells were cultured with increasing doses of carfilzomib 3 days after treatment or not with doxycycline (Dox) for an additional 4 days. The viability was determined using a CellTiter-Glo assay. Results are mean ± standard deviation of 4 independent experiments. *P < .05, **P < .005, ***P < .001. (C) Effect of carfilzomib (Cfz) and/or BIX01294 (BIX) treatment on primary human CD138+ MM cells. Mononuclear cells from 7 MM patients were treated with the indicated concentrations for 4 days, and the percentage of viable CD138+ plasma cells was determined by flow cytometry. Results are expressed as the relative viability compared with control (Cnt). (D) Western blot analysis of the mechanisms underlying the increased carfilzomib (Cfz) sensitivity upon BIX01294 (BIX) treatment. XG-7 cells were treated with BIX01294 (2 µM) and/or carfilzomib (2 nM) for 24 hours, after which western blot analysis was performed on whole-cell lysates for the indicated proteins. Actin was used as loading control, and 1 experiment representative of 3 experiments is shown. (E-F) Effect of BIX01294 (BIX), bortezomib (Bz), and combination (Combo) treatment on tumor burden (E) and survival (F) in the murine 5TGM1 model. Mice were inoculated with 5TGM1 cells and assigned to different treatment groups: vehicle, 10 mg/kg (mpk) BIX, 0.6 mg/kg (mpk) Bz, or BIX plus Bz (Combo). The number of mice per treatment group and the treatment scheme are indicated in the schematic overview (upper panel). To determine the effect on tumor burden (E), all mice were euthanized when the first mouse showed obvious signs of morbidity. *P < .05, ***P < .001. (F) To determine the effect on OS, each mouse was euthanized individually when showing clear signs of morbidity, and the effect on survival rates was determined by Kaplan-Meier analysis. *P < .05 vs treatment with Bz alone.
Discussion
Aberrant epigenetic regulation plays a major role in cancer, including MM. The reversible nature of the epigenetic modifications has led to the development of many drugs targeting the epigenetic machinery. The classical broad-acting DNMT inhibitors and HDACi have proven useful in MM therapy, especially the pan-HDACi panobinostat. However, these epidrugs are often associated with severe toxicity issues, thus limiting their broad application in the clinic. Therefore, novel drugs targeting methylation of specific histone lysine residues are under investigation.3 Previous studies have shown increased expression of the histone methyltransferase G9a in different cancers, associated with tumor suppressor silencing, migration, and a worse outcome.3 G9a overexpression in HMCLs was also recently reported in MM, and patients with high G9a levels had a significantly worse outcome.8 In the present study, we validated the prognostic value of G9a in 2 independent cohorts of newly diagnosed patients and 1 cohort of relapsed patients.
Given the important role of G9a in cancer, a growing number of G9a/GLP inhibitors have been developed and tested in the preclinical setting.31 These inhibitors can be divided into substrate competitive inhibitors, S-adenosyl-methionine (SAM) cofactor competitive inhibitors, and inhibitors with unclear mechanisms. Substrate competitive inhibitors specifically block the substrate binding site instead of competing with SAM and, thus, are more selective than the SAM competitive inhibitors. In our study, we used the substrate competitive inhibitors BIX01294 and UNC0638, with UNC0638 being an improved version of BIX01294 displaying superior selectivity for G9a and GLP and a superior toxicity/function ratio.31 Both inhibitors were extensively reported to induce potent antitumor activity in various cancers.3,31 In line with these studies, we found that BIX01294 and UNC0638 strongly reduced MM cell viability and growth and promoted apoptosis in human and murine MM cell lines. Importantly, in line with the study by Zhang et al, genetic depletion of G9a using shG9a also strongly reduced MM cell growth, thus confirming that the antimyeloma effects induced by BIX01294/UNC0638 are mediated, at least in part, by G9a.8 The potent anti-MM activity was also confirmed using primary patient samples and the syngeneic fully immunocompetent murine 5TGM1 model. Only very recently, Zhang et al showed that G9a shRNA impairs RelB-dependent cell survival and proliferation of HMCLs and reduces MM growth in a xenograft model in a prophylactic setting.8 Here, we show that simultaneous targeting of G9a/GLP for only 2 weeks in fully immunocompetent mice with established disease (a therapeutic and, thus, more clinically relevant setting) also resulted in a significant delay in tumor progression.
G9a and GLP contribute to tumorigenesis via diverse molecular mechanisms.3,4,31 The best-described mechanism is H3K9me2-mediated transcriptional repression of tumor suppressors.3,4,31 Here, we show that G9a/GLP targeting (using chemical or genetic inhibition) resulted in a strong decrease in H3K9me2 levels. This is in line with reports showing that G9a/GLP complexes primarily catalyze H3K9me2.7,8,31 Genes that were transcriptionally affected by BIX01294 or UNC0638 in MM cells were significantly enriched in polycomb PRC2 target genes, genes associated with DNA methylation, HDAC targets, and genes involved in immune response, interferon, and chemokine pathways. These data underscore that G9a/GLP target genes could consist of key MM tumor suppressors that are silenced through different epigenetic mechanisms, such as CASP1 and EGR2.28,30
A second well-described mechanism by which G9a contributes to cancer biology is through autophagy repression.22-24 Autophagy is a highly regulated catabolic process that is stimulated via different stress stimuli.32,33 Upon stimulation, cellular components are incorporated into autophagosomal vesicles, followed by fusion with lysosomes, forming autolysosomes and causing the degradation of the cellular content. The role of autophagy in cancer is still controversial, because it appears to prevent early tumor formation but is also able to promote tumor survival.32-34 Under normal physiological conditions, autophagy plays an important role in maintaining cellular homeostasis. However, long-term and intensive autophagy can lead to caspase-independent cell death, which is known as autophagy-associated apoptosis.32-34 A common way to analyze autophagy is by studying the accumulation and intracellular localization of LC3B-II. Previously, G9a/GLP targeting using BIX01294 was shown to induce autophagy-associated apoptosis in different cancers.23,24,35-37 In line with these reports, we found that BIX01294 and UNC0638 promoted autophagy-associated apoptosis in MM cells, as evidenced by a strong increase in LC3B-II levels and LC3B puncta formation, together with a strong increase in caspase-independent apoptosis. Furthermore, the autophagy inhibitor 3-ME partially protected against BIX01294-induced apoptosis, thus further confirming the role of autophagy in BIX01294-induced apoptosis.
The induction of autophagy is regulated via several signaling pathways, the most important being the mTOR signaling pathway.32,33 The serine/threonine mTOR kinase forms the catalytic subunit of 2 functionally distinct multiprotein complexes: mTORC1 and mTORC2. The mTORC1 signaling pathway plays an important role in maintaining cellular homeostasis by promoting growth, survival, translation, ribosome biogenesis, and lipid synthesis.32,33 Aberrant activation of this pathway correlates with disease progression and resistance to therapy in MM.38 Importantly, mTOR signaling inhibits autophagy directly and indirectly.32,33,39 Under physiological conditions, mTORC1 stimulates protein translation and cell growth and survival and inhibits autophagy by phosphorylating ULK1/2 at S757 and S637 residues, blocking its catalytic activity and interaction with AMPK. Upon autophagy induction, mTOR is inactivated, allowing ULK1 S757/637 dephosphorylation. As a result, ULK1 becomes activated and autophagosome membrane formation is started. In our study, we observed a clear decrease in phosphorylation of Akt, mTOR, and ULK1 S757/637 in MM cells upon BIX01294 treatment. These findings are in line with previous reports showing that G9a targeting induces autophagy through the mTOR signaling pathway in cancer cells.36,37 Moreover, G9a is also responsible for the epigenetic silencing of autophagy-related genes, such as LC3B, WIPI1, and DOR, in pancreatic cancer cells.22 In line with this, we found that BIX01294/UNC0638 deregulated the expression of several autophagy-related genes, including mTOR, WIPI1, ATG4D, and ATG7, in MM cells. Furthermore, BIX01294 induces upregulation of UB2QL1, which is known to participate in mTOR ubiquitination and degradation.29
Importantly, we also observed a clear decrease in the phosphorylation and expression levels of the mTORC1 target 4EBP1 upon BIX01294 treatment. Previous studies have shown that 4EBP1 inhibits autophagy.32 Importantly, hypophosphorylated 4EBPs also block cap-dependent translation by binding with high affinity to eIF4E.32,33 A key MM tumor suppressor that is likely to be strongly affected by blocking protein synthesis is the transcription factor c-MYC, a very unstable protein with a half-life of only 20 to 30 minutes.40 c-MYC binds to promoter regions of genes involved in cell cycle regulation and metabolism.41 Overexpression of c-MYC was reported in various cancers, including MM, where deregulated MYC expression is found in 50% of patients.42 An increase in c-MYC protein levels has been associated with MM onset and progression and an inferior OS.38,42,43 In hematological cancers, c-MYC overexpression results in mTOR-mediated 4EBP1 hyperphosphorylation, thus creating a vicious cycle. Consequently, mTOR inhibition strongly decreases tumor burden in vivo in MM.40 Other studies also demonstrated the importance of targeting the mTOR–c-MYC axis in different cancers.44,45 As expected, we observed a strong decrease in c-MYC protein levels upon BIX01294 treatment, indicating that G9a/GLP inhibition also induces autophagy-associated apoptosis by targeting the mTORC1/4EBP1/c-MYC pathway in MM cells. Of note, epigenetic proteins have emerged as critical regulators of c-MYC at multiple levels in cancer.46 In MM, targeting the bromodomain and extraterminal (BET) family member BRD4 using the BET inhibitor JQ-1 is well known to potently suppress MYC transcription.47-49 Moreover, we and other investigators previously showed that treatment with HDACi and/or DNMTi suppresses MYC transcription and/or the MYC transcriptome.47,50 In addition, we showed that HDACi and/or DNMTi treatment downregulates IRF4, an essential MM survival factor that also targets MYC.51 In line with these reports, we found that G9a/GLP targeting also suppresses MYC transcription. Of interest, it was also recently shown in breast cancer that G9a interacts with MYC to drive tumorigenesis.6 G9a appeared to be essential for MYC-mediated transcriptional repression and inhibiting G9a derepressed expression of MYC-repressed genes, resulting in suppressed MYC-driven tumor growth. Moreover, in line with our findings, the investigators also observed a modest reduction in c-MYC protein levels upon G9a and/or GLP silencing when cells are cultured under normal growing conditions. Also, in human pancreatic ductal adenocarcinoma KP-4 cells, it was recently shown that BRD4 and G9a work together to negatively regulate autophagy at the transcriptional level in growing conditions.52 Targeting either BRD4 or G9a enhanced autophagic flux, whereas simultaneous targeting of BRD4 and G9a did not enhance autophagy activity further, suggesting that they act on the same pathway. Based on this, it is tempting to speculate that G9a and BRD4 are also working together to regulate the MYC transcriptome in MM. It will be interesting to investigate this further in future studies. Finally, similar to what we observed, the bivalent BET inhibitor AZD5153 was shown to repress MYC, E2F, and mTOR target gene transcription in MM cells.53 Moreover, the investigators provided evidence that MM cell lines sensitive to AZD5153 exhibited a marked decrease in the level of mTOR pathway–associated proteins (including phosphorylated [p]-p70S6K, PRAS40, and p-4EBP1) following AZD5153 treatment, whereas MYC protein levels were decreased in sensitive and resistant cell lines, suggesting that MYC downregulation alone was not sufficient to modulate cell survival. Together with our findings, these studies indicate that G9a positively regulates c-MYC expression in MM cells, and G9a/GLP targeting represents a compelling strategy to disrupt the mTORC1/4EBP1/c-MYC axis in MM.
Finally, a bidirectional interplay between the mTOR pathway and the ubiquitin proteasome system has been reported.39 Blocking the proteasome results in the accumulation of proteins and a decrease in the pool of amino acids available for protein synthesis, thus reducing mTOR signaling and stimulating autophagy.38 PI-based treatments are 1 of the cornerstones of MM therapy. The PI bortezomib is used in the first-line setting, whereas the second-generation inhibitor carfilzomib has been approved for relapsed/refractory MM. Both inhibitors bind to the catalytic site of the 20S proteasome, inducing growth arrest and cell death.39,54 Studies in MM showed synergistic effects when combining mTOR inhibitors and bortezomib.39,55 In addition, recent studies showed that inhibition of c-MYC also sensitizes MM cells to PI therapy.38,56,57 In concordance, we found that BIX01294 sensitized MM cells to bortezomib and carfilzomib and this both in vitro using MM cell lines and primary cells and in vivo using the 5TGM1 mouse model. The increased sensitivity toward PIs was associated with a further reduction in mTOR signaling and c-MYC levels and an increase in p-38 and JNK/c-Jun signaling. Zhao et al showed that autophagic cell death in non–small cell lung cancer is mediated through activation of the JNK and p38 MAPK pathways and inhibition of the mTOR signaling pathway.58 In MM patients, low c-Jun levels are correlated with an inferior survival and bortezomib resistance; overexpression of c-Jun overcomes this resistance.59 Thus, activation of the JNK/c-Jun pathway upon combination treatment could also explain the observed boosting effects.
Together, our data provide evidence that G9a/GLP targeting in MM cells induces autophagy-associated apoptosis and sensitizes MM cells to PI-based therapy by inhibiting mTOR signaling and decreasing c-MYC levels. Thus, G9a/GLP targeting represents a promising new strategy to improve PI-based therapy in G9ahigh myeloma patients.
Data sharing requests should be sent to Elke De Bruyne (elke.de.bruyne@vub.be) or Jerome Moreaux (jerome.moreaux@igh.cnrs.fr).
Acknowledgments
The authors thank Carine Seynaeve, Lotte Jacobs, and Charlotte Van De Walle for expert technical assistance. They also thank the MMRF for sharing the sequencing and clinical data for patients enrolled in the CoMMpass study through the MMRF genomics portal.
This work was supported by grants from the International Myeloma Foundation, KomOpTegenKanker, Fonds voor Wetenschappelijk Onderzoek, INCa (Institut National du Cancer) PLBIO18-362 PIT-MM and PLBIO19‐098 INCA_13832FATidique, ANR (the French National Research Agency) under the “Investissements d’avenir” program with the reference ANR-16-IDEX-0006, ANR (TIE-Skip, 2017-CE15-0024-01), ANR-18-CE15-0010-01 PLASMADIFF-3D, SIRIC Montpellier Cancer (INCa_Inserm_DGOS_12553), Labex EpiGenMed, and Institut Universitaire de France.
Authorship
Contribution: E.D.S., J.D., J.M., and E.D.B. conceived and designed the study; E.D.S., J.D., C.M., J.M., and E.D.B. acquired data; E.D.S., J.D., C.M., K.M., P.V., N.R., G.R., L.V., G.C., J.M., and E.D.B analyzed and interpreted data; and E.D.S., J.D., K.M., P.V., J.M., and E.D.B. provided administrative, technical, or material support and wrote, reviewed, and/or revised the manuscript.
Conflict-of-interest disclosure: The authors declare no competing financial interests.
Correspondence: Elke De Bruyne, Vrije Universiteit Brussel, Department of Hematology and Immunology–Myeloma Center Brussels, Laarbeeklaan 103, B-1090 Brussels, Belgium; e-mail: elke.de.bruyne@vub.be; and Jerome Moreaux, Laboratory for Monitoring Innovative Therapies, Department of Biological Hematology, Hôpital Saint-Eloi–CHRU de Montpellier, Av Augustin Fliche 80, 34295 Montpellier Cedex 5, France; e-mail: jerome.moreaux@igh.cnrs.fr.

