

Key Points
Lymphocytes show characteristic atypical morphology and kinetics in peripheral blood and cerebrospinal fluid after CAR T-cell infusion.
Lymphocyte proliferation kinetics after CAR T-cell infusion in ALL affect response, loss of BCA, and CD19+ relapse.

Abstract
CD19-directed chimeric antigen receptor (CAR) T cells show characteristic proliferation kinetics after infusion that correlate with response. Clearance of circulating disease, B-cell aplasia (BCA), and cytokine release syndrome (CRS) are used to observe CAR T-cell function, given the lack of commercial CAR T-cell measurement assays. We investigated the utility of common hematology laboratory parameters in 166 patients with B-cell acute lymphoblastic leukemia (B-ALL) who were treated with CAR T-cell therapy targeting CD19. CAR T-cell infusion was followed by disappearance of circulating blasts in 86% of patients at a median of 6 days. After a lag phase, there was a rapid expansion in absolute lymphocyte count (ALC) in the second week that coincided with the appearance of atypical lymphocytes. The expansion phase was followed by a contraction phase with a concomitant decrease in atypical lymphocytes. In vitro CAR T-cell studies showed similar kinetics and morphological changes. Peak ALC and overall expansion was greater in sustained responders compared with that in nonresponders. Patients with early loss of BCA and those with eventual CD19+ minimal residual disease/relapse showed lower overall lymphocyte expansion compared with the controls. Pleomorphic lymphocytosis was noted in the cerebrospinal fluid at post-CAR time points. We conclude that lymphocyte counts and differential can also be used to evaluate CAR T-cell expansion after infusion, along with BCA and CRS. This is the first report to characterize the morphology of CAR T cells and determine the utility of lymphocyte kinetics.
Introduction
Chimeric antigen receptor (CAR) T-cell products have been approved by the US Food and Drug Administration for the treatment of relapsed/refractory B-cell acute lymphoblastic leukemia (r/r B-ALL), diffuse large B-cell lymphoma, mantle cell lymphoma, and multiple myeloma.1 CAR T cells are also under active investigation for the treatment of other hematological malignancies, solid tumors, and nonmalignant diseases.2,3 Initial phase 1 and 2 studies revealed that >90% of patients with r/r B-ALL achieve minimal residual disease (MRD)–negative remission after CD19-targeted CAR T-cell therapy.4-7 However, a subset of patients eventually relapse with CD19− or CD19+ leukemia, despite the initial response.4,8,9 Loss of CD19 is due to escape mechanisms under CAR T-cell pressure, whereas CD19+ relapse is attributable to loss of CAR T-cell function.8,10-12
CD19-directed CAR T-cell products can differ in target antigen, surface epitope, linker domains, and costimulatory molecules.13 CD19 CAR T-cell kinetics can be monitored by polymerase chain reaction, for transgene expression, or by detection of a surface epitope on intact cells by flow cytometry13 and typically shows an expansion and persistence phase after infusion.14,15 However, there is wide variability in the magnitude and duration of CD19 CAR T-cell engraftment related to patient- and product-specific factors.16,17 Product-specific factors that favor engraftment include a stem cell–like phenotype and the lack of an exhaustion phenotype.18 Patient-specific factors that affect response include preinfusion tumor burden, use of lymphodepleting regimens, and an anti-CAR immune response.12,17 Although CD19 CAR T cells are commercially available and widely used, assays for directly measuring CAR T cells are performed only on a research basis, and are rarely done in real time. Given the variety of CAR T-cell products that are under development, it would also be difficult to validate and run a separate clinical assay for every product that may become available. We investigated the utility of commonly obtained hematology laboratory parameters to follow lymphocyte kinetics and morphology after CD19-directed CAR T-cell infusion in 166 patients with B-ALL who were treated with CAR T-cell therapy. Characteristic and consistent changes were noted in peripheral blood (PB) smears and counts during the first month after infusion. We described the morphology of CD19 CAR T cells and analyzed the impact of lymphocyte kinetics on response and relapse. In vitro CAR T-cell studies were performed, to replicate clinical laboratory findings.
Methods
Patient cohort
Clinicopathologic characteristics of this cohort have been described in detail.8 In brief, 166 patients with r/r B-ALL who received CD19-directed 4-1BBζ CAR T-cell therapy from April 2012 through December 2017 were identified from the pathology archives (retrospective study approved by the Children’s Hospital of Philadelphia Institutional Review Board). The study was conducted in accordance with the Declaration of Helsinki. The median follow-up period was 29 months after infusion. Disease burden was assessed in bone marrow specimens from biopsies performed after lymphodepleting chemotherapy and just before CAR T-cell infusion. Flow cytometry blast counts were used for <5% disease, whereas aspirate blast count and biopsy specimen assessment were used for >5% disease. Nonresponders (NRs) were defined as patients who failed to achieve MRD− remission at day 28. Patients who showed no evidence of disease at follow-up were considered sustained responders (SRs). Patients with any CD19+ blasts were classified as CD19+ MRD/relapse (CD19-posR). B-cell aplasia (BCA) was determined by <1% CD19+ B cells in the PB or bone marrow.
Clinical laboratory data
Hematology laboratory data during the first month after CAR T-cell infusion were available on 99% of patients, as they were closely monitored during this crucial phase. Pre- and post-CAR complete blood counts (CBCs), cerebrospinal fluid (CSF) cell counts, and PB flow cytometric data were abstracted from the electronic medical record. CBC and CSF differential counts were performed with a Sysmex XN 3000 automated hematology analyzer (Sysmex Corporation, Kobe, Japan). Wright Giemsa–stained peripheral blood smears from the Sysmex stainer (XP-10) were imaged by CellaVision DM1200 and analyzed by PB smear application software (CellaVision AB, Lund, Sweden). Eighteen white blood cell (WBC) types are preclassified by convolutional neural network–based, deep-learning algorithms and sorted for expert technologist review and approval.19 Using this technology, we classified normal large granular lymphocytes (LGLs) as lymphocytes and malignant cells as blasts and large atypical cells with deeply basophilic cytoplasm or prominent granularity as atypical/variant lymphocytes. Cells that could not be categorized (“others”) by the instrument were reconciled as either blasts or atypical lymphocytes after expert review. Archived PB images from 118 cases with representative images spanning more than 1 week were reviewed for this study. CSF morphology and differentials were evaluated on hematoxylin and eosin–stained cytospin slides prepared with Aerospray Hematology Pro (ELITech Group, France).
Lymphocyte kinetics analyses
Lymphocyte proliferation kinetics were graphed according to day 0 (day of infusion)-to-day 31 absolute lymphocyte counts (ALCs). Frequent daily or weekly CBCs and differential data were available on 99% of patients. ALC parameters that were most useful for kinetics analyses were peak ALC and overall ALC expansion. Peak ALC is a measure of maximal expansion, whereas area under the curve of the first-month ALC (AUC1mo) is a measure of overall expansion in the first month. ALC AUC1mo was calculated with Prism software (GraphPad, San Diego, CA). Absolute count kinetics of atypical lymphocytes and blasts were similarly analyzed. CSF lymphocyte counts were calculated by CSF WBC count, multiplied by proportion of lymphocytes on differential. A WBC count of 0 was considered to be 0.005 for calculations, given the lower limit of detection by the instrument.
Patients who required reinfusion for nonresponse treated with pembrolizumab (n = 3) during the first month were censored for kinetics analyses, given the additional impact on ALC kinetics. Responders who either received reinfusion of CAR T cells because of early loss of BCA and/or underwent a bone marrow transplant during the follow-up period were censored for kinetics analyses (n = 16), because those patients could have relapsed without the intervention.
Clinical flow cytometry
Flow cytometric reagents, software, and instrumentation for T- and B-cell immunophenotyping have been described.8 Archived original flow cytometric data were reviewed.
CAR T-cell production for in vitro studies
CD4+, CD8+, and CD3+ T-cell populations were isolated, activated, and transduced with a lentiviral vector encoding the FMC63-based CD19-targeted CAR with 4-1BBζ signaling domains, as described.8 Cultures were expanded every 2 days with the addition of rhIL-2 (Proleukin) at 100 IU/mL. Nontransduced T cells and those transduced with the lentivirus containing the CAR construct (19bbζ) were used in functional assays between 10 and 14 days of expansion. CAR expression was confirmed by flow cytometry after staining each cell population with biotinylated-protein L (Thermo Fisher Scientific) followed by streptavidin-allophycocyanin (BD Biosciences). Transduction efficiency of CAR T cells was between 37% and 53%.
In vitro T-cell activation studies
To activate T cells, we incubated tissue culture plate wells overnight at 4°C with recombinant human CD19 (Acrobiosystems), goat anti-mouse IgG (F(ab')2–specific (Jackson ImmunoResearch), or anti-CD3 plus anti-CD28, each at a concentration of 5 μg/mL in phosphate buffered saline (PBS). The following day, the wells were washed 3 times with PBS, and the cells were then plated at a concentration of 1 × 10⁶/mL along with recombinant human IL-2 (rhIL-2; 100 IU/mL). Medium with rhIL-2 was refreshed 24, 48, and 72 hours after initial culture. At 8, 24, 48, 72, 148, 216, and 312 hours after culture, aliquots of T cells were harvested, and a Coulter Counter (Beckman Coulter) was used to determine cell concentration and volume. Pure red blood cells were added to 100-µL aliquots of cell cultures at the time of sampling to aid in smear preparation and visualization of cells in the clinical hematology laboratory.
Statistics
Statistical analyses were performed with Prism software (GraphPad, San Diego, CA). ALC parameters showed non-Gaussian distribution. The Mann-Whitney U test was used to compare 2 unmatched groups. The Kruskal-Wallis test was used to compare ALCs from 3 or more matched groups. The Wilcoxon and Friedman tests were used to compare paired data. Spearman correlation was used to quantify the association between 2 or more variables. Two-tailed P-values are shown for all analyses.
Results
Atypical lymphocytosis after CAR T-cell infusion
WBCs and ALCs were low (mean 204, median 88) in all 166 patients at day 0 (see representative example in Figure 1A and entire cohort in Figure 1D) because of lymphodepleting chemotherapy. Preinfusion PB smears showed mostly small, mature lymphocytes (representative examples in Figures 1A and 2A-B). A minor increase in ALCs and LGLs was noted after infusion, but did not persist. The earliest indicator of lymphocyte expansion was the appearance of atypical lymphocytes that became prominent toward the end of the first week (representative examples in Figure 1C, first 2 images). These atypical lymphocytes were sometimes mistaken for leukemic blasts by hematology laboratory personnel. Recognizing the atypical morphology of these cells in CAR-infused patients and comparison with the patient’s prior lymphoblasts is important for accurate categorization. Marked expansion of lymphocytes was noted in the second week after infusion (representative example in Figure 1A and entire cohort in Figure 1B). The ALC peaked at a median of 10 days (mean, 12 days; range, 4-23) after infusion (Figure 1B,E). The peak ALC ranged from 280 to 69 600 (mean 2226, median 1134; Figure 1D; P < .0001 Kruskal-Wallis test). A high proportion of the lymphocytes were classified as variant or atypical lymphocytes by automated machine-learning algorithms (Figure 1C). The proportion of cells classified as atypical lymphocytes peaked at a mean of 24.7% (median, 17.6%; range, 0.9% to 96.4%) at a median of 8 days after infusion. Cytoplasmic granules in atypical lymphocytes after CAR infusion tended to be more prominent, chunky, polarized, or rod-like (representative examples in Figure 1C) in comparison with the Downey-type cells of infectious mononucleosis (supplemental Figure 1C). Atypical lymphocytes were replaced by normal mature lymphocytes in the third and fourth week, along with a concomitant decrease in ALC. Absolute neutrophil counts, ALCs, and absolute monocyte counts typically started recovering in the fourth week and were distinct from the earlier lymphocyte proliferation (representative examples in supplemental Figure 1B). These patterns were consistently noted across the entire cohort.
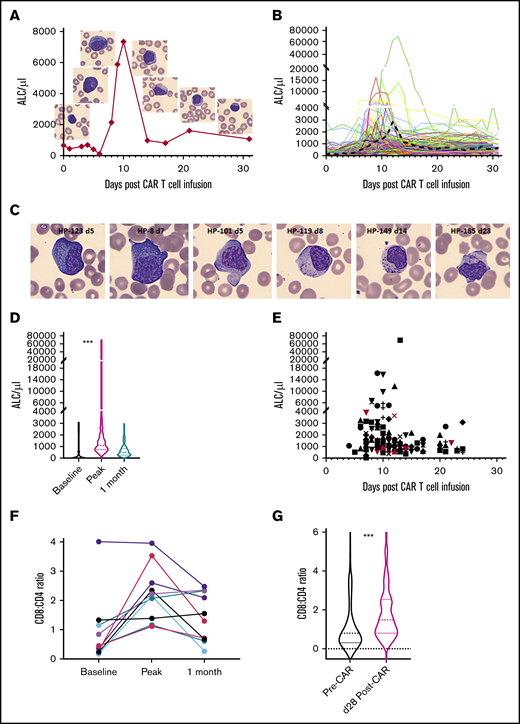
Lymphocyte expansion after CAR T-cell infusion. (A) ALC proliferation kinetics and concurrent peripheral smear images of atypical lymphocytes in (eventual) SR patient HP-101. (B) ALC kinetics of the entire cohort (n = 164) showing lag, expansion, and contraction phases. Black dashed line depicts the mean. The y-axes are depicted in a linear scale similar to ALC graphs in the electronic medical record. Split axes are used to highlight the entire spectrum of peak ALCs. (C) Spectrum of atypical lymphocytes after CAR infusion. Atypical features include markedly basophilic cytoplasm (HP-123 and HP-8), cytoplasmic projections (HP-101), polarized granules (HP-119), chunky granules (HP-149), and azurophilic rods (HP-185). Patient code and days post–CAR infusion are shown in parentheses. Representative CellaVision images at ×500 original magnification. Background RBCs demonstrate uniformity of smears and magnification. (D) Violin plots (median, quartile ranges, and distribution) of baseline and peak and 1-month ALC across the cohort (n = 164; ***P < .0001, Kruskal-Wallis test). (E) Timeline of peak ALC across the cohort (n = 164). Red symbols depict NRs. The 2 NRs with the highest ALCs underwent reinfusion of CAR T cells or pembrolizumab during the first month. Different shapes indicate individual patients. (F) Increased CD8 T cells at peak expansion compared with that observed before and 1 month after CAR infusion (n = 10 cases). (G) Violin plots showing increased CD8/CD4 ratio at day 28 compared with baseline across the cohort (n = 166; ***P < .0001, Wilcoxon test).
Lymphocyte expansion after CAR T-cell infusion. (A) ALC proliferation kinetics and concurrent peripheral smear images of atypical lymphocytes in (eventual) SR patient HP-101. (B) ALC kinetics of the entire cohort (n = 164) showing lag, expansion, and contraction phases. Black dashed line depicts the mean. The y-axes are depicted in a linear scale similar to ALC graphs in the electronic medical record. Split axes are used to highlight the entire spectrum of peak ALCs. (C) Spectrum of atypical lymphocytes after CAR infusion. Atypical features include markedly basophilic cytoplasm (HP-123 and HP-8), cytoplasmic projections (HP-101), polarized granules (HP-119), chunky granules (HP-149), and azurophilic rods (HP-185). Patient code and days post–CAR infusion are shown in parentheses. Representative CellaVision images at ×500 original magnification. Background RBCs demonstrate uniformity of smears and magnification. (D) Violin plots (median, quartile ranges, and distribution) of baseline and peak and 1-month ALC across the cohort (n = 164; ***P < .0001, Kruskal-Wallis test). (E) Timeline of peak ALC across the cohort (n = 164). Red symbols depict NRs. The 2 NRs with the highest ALCs underwent reinfusion of CAR T cells or pembrolizumab during the first month. Different shapes indicate individual patients. (F) Increased CD8 T cells at peak expansion compared with that observed before and 1 month after CAR infusion (n = 10 cases). (G) Violin plots showing increased CD8/CD4 ratio at day 28 compared with baseline across the cohort (n = 166; ***P < .0001, Wilcoxon test).
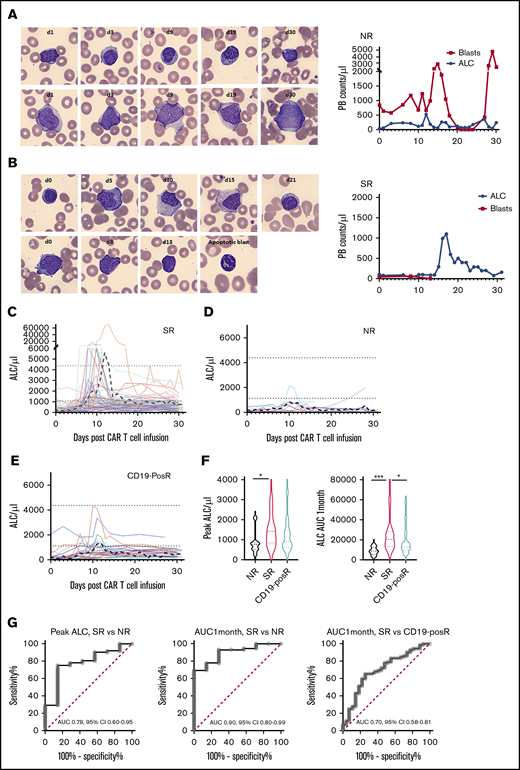
Differences in morphology and kinetics in SRs, NRs, and relapses. (A) Normal mature lymphocytes (top) and persistent blasts (bottom) in NR patient HP-9 (left). Representative CellaVision images at ×500 original magnification. ALC and blast kinetics in NR HP-9 (right). (B) Increase in atypical lymphocytes (left top, days 5-15), as blasts (left bottom) disappeared by day 13 in responder HP-83. Example of an apoptotic cell (with crenellated nucleus) after CAR-infusion is shown in a day-13 image. ALCs and blast kinetics in responder HP-83 (right). (C) Individual ALC curves and mean (black dashed line) in 72 SRs show characteristic ALC proliferation kinetics with initial lag phase, then marked expansion, followed by rapid contraction and persistence. (D) Individual ALC curves and mean in 7 NRs show decreased lymphocyte proliferation. (E) Individual ALC curves and mean in 27 (eventual) CD19-posRs. Dotted black lines indicate mean upper and lower limits of normal ALC. The y-axes are shown in linear scale, similar to ALC graphs in the electronic medical record (EPIC) and to highlight low-level peaks. (F) Violin plots depicting medians, quartile ranges, and distribution of various groups (left) show significantly (*P = .04, Kruskal-Wallis test) higher peak ALCs in SRs than in NRs, but not in SRs vs CD19-posRs (P = .1). Violin plots of ALC AUC1mo in various groups (left) showing significantly higher overall ALC expansion in SRs compared with NRs (***P = .0009) and CD19-posRs (*P = .013). (G) ROC analyses of peak ALC and ALC AUC1mo in SRs and NRs and ALC AUC1mo in SRs and CD19-posRs.
Differences in morphology and kinetics in SRs, NRs, and relapses. (A) Normal mature lymphocytes (top) and persistent blasts (bottom) in NR patient HP-9 (left). Representative CellaVision images at ×500 original magnification. ALC and blast kinetics in NR HP-9 (right). (B) Increase in atypical lymphocytes (left top, days 5-15), as blasts (left bottom) disappeared by day 13 in responder HP-83. Example of an apoptotic cell (with crenellated nucleus) after CAR-infusion is shown in a day-13 image. ALCs and blast kinetics in responder HP-83 (right). (C) Individual ALC curves and mean (black dashed line) in 72 SRs show characteristic ALC proliferation kinetics with initial lag phase, then marked expansion, followed by rapid contraction and persistence. (D) Individual ALC curves and mean in 7 NRs show decreased lymphocyte proliferation. (E) Individual ALC curves and mean in 27 (eventual) CD19-posRs. Dotted black lines indicate mean upper and lower limits of normal ALC. The y-axes are shown in linear scale, similar to ALC graphs in the electronic medical record (EPIC) and to highlight low-level peaks. (F) Violin plots depicting medians, quartile ranges, and distribution of various groups (left) show significantly (*P = .04, Kruskal-Wallis test) higher peak ALCs in SRs than in NRs, but not in SRs vs CD19-posRs (P = .1). Violin plots of ALC AUC1mo in various groups (left) showing significantly higher overall ALC expansion in SRs compared with NRs (***P = .0009) and CD19-posRs (*P = .013). (G) ROC analyses of peak ALC and ALC AUC1mo in SRs and NRs and ALC AUC1mo in SRs and CD19-posRs.
PB absolute CD3 counts were available only in a subset of cases (n = 10), but the overall trend was similar to ALCs with an expansion-and-contraction phase (supplemental Figure 3A). ALCs overlapped with absolute CD3 counts at many time points, suggesting that the expanding lymphocytes were entirely composed of CD3+ T cells. ALCs provided a more comprehensive representation of kinetics in a subset (5 of 10) of patients, given the transient nature of expansion that was missed by infrequent flow cytometry in many patients (supplemental Figure 3A; HP-6, HP-7, HP-29, HP-85, and HP-107). Although CD3+ T cells were composed of both CD4+ and CD8+ T cells, a reversal of the normal CD4/CD8 ratio was noted at peak expansion (Figure 1F; n = 10). Increased CD8+ T cells were also noted at the end of 1 month, compared with baseline (n = 166; Figure 1G; P < .0001, Wilcoxon test).
In vitro CAR T-cell studies
We then investigated whether the sequence of morphologic changes could be replicated in vitro, using purified CAR T cells. Sorted CD3+, CD4+, and CD8+ CAR T cells that were stimulated with anti-CD3 and plate-bound CD19 showed a similar sequence of changes in CAR T cells, but not in the nontransduced or nonactivated negative controls (supplemental Figure 2). Kinetics were rapid during in vitro stimulation, and cell cultures were not sustained for long without significant restimulation or addition of cytokines.
Lymphocyte proliferation kinetics impact initial response and subsequent relapse pattern
Circulating leukemic blasts were noted at the time of infusion in 22 of the 166 patients. Blasts disappeared from the PB at a mean of 8.4 days (median, 6 days; range, 1-23) after infusion in the 19 of 22 patients with circulating blasts (representative example in Figure 2B) concomitant with the increase in ALC. In contrast, blasts persisted throughout the first month in the 3 NRs (representative example in Figure 2A) where no ALC peaks could be discerned. This pattern suggested that ALC expansion kinetics correlate with initial response.
When the entire cohort (n = 166) was stratified by response (Figure 2C), SRs showed a high peak ALC (mean, 3043.33; median, 1428) and ALC AUC1mo (mean 27 607, median, 20 355). However, NRs showed a much lower peak ALC (mean, 842.9; median, 770) and ALC AUC1mo (mean, 8837; median, 8781; Figure 2D). CD19-posRs (Figure 2E) also showed a lower peak ALC (mean, 1242.3; median, 900) and ALC AUC1mo (mean, 16 295, median 12 835). Comparison of first-month kinetics revealed that peak ALC and ALC AUC1mo were significantly different (P = .04 and P = .0009, Kruskal-Wallis test) in SRs vs NRs (Figure 2F). A peak ALC of 857 had a sensitivity of 75% and specificity of 85.71% in distinguishing NRs from SRs (Figure 2G, left). An ALC AUC1mo of 13 016 had a sensitivity of 77.8% and specificity of 85.7% in distinguishing NRs from SRs (Figure 2G, middle). Similarly, an ALC AUC1mo of 16 944 had a sensitivity of 63.9% and specificity of 74.1% in distinguishing CD19-posRs from SRs (Figure 2G; right). Peak ALC was not significantly different (P = .1) between SRs and CD19-posRs. Other parameters such as day of peak ALC, peak ALC–to–baseline ALC ratio and 1 month–to–baseline ALC ratio were compared but did not provide higher sensitivity or specificity compared with peak ALC and ALC AUC1mo (supplemental Table 1).
We then investigated whether lymphocyte expansion correlates with extent of pre-CAR marrow leukemic involvement. A positive correlation was noted with peak ALC across the whole cohort (supplemental Figure 4A). Much stronger positive correlations were noted with both peak ALC and ALC AUC1mo when SRs were considered in isolation (Figure 3A-B). We then analyzed the proportion of bone marrow involvement in various responder groups to determine whether preinfusion disease accounts for differences in ALC expansion. NRs showed lower ALC expansion, despite higher levels of pre-CAR bone marrow involvement (mean, 70%) compared with SRs (mean, 13.23%; Figure 3C; P < .0001, Kruskal-Wallis test). Similarly, the eventual CD19-posRs showed lower ALC expansion, despite higher levels of pre-CAR bone marrow involvement (mean, 25.5%) compared with SRs (Figure 3C). This pattern led us to investigate whether lymphocyte kinetics in the first month are an indicator of early loss of BCA across the entire cohort. Many patients achieved complete remission and BCA but lost BCA early (≤6 months). Patients with early recovery of B cells had lower peak ALCs (mean, 1262.6; median, 895) in the first month compared with patients who never lost BCA (mean, 2899.4; median, 1400; Figure 3D-F; P = .05, Mann-Whitney U test). A peak ALC of 1300 in the first month had a sensitivity of 58.2% and specificity of 64% in determining patients with early loss of BCA (supplemental Figure 5B). There were no significant differences in the proportion of pre-CAR disease involvement between the 2 groups.
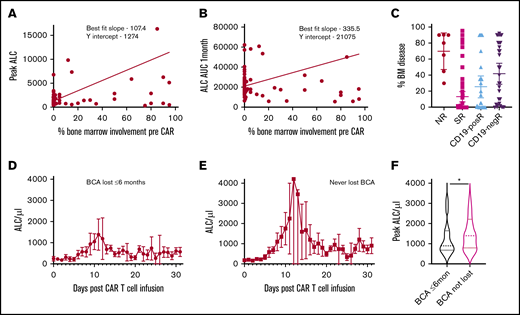
Relationship of ALC proliferation kinetics to preinfusion disease and BCA. (A-B) Linear regression analysis of lymphocyte expansion parameters and extent of tumor involvement in SRs, showing significant deviation from the 0 slope in SRs (peak ALC, P = .0002; ALC AUC1mo, P = .005). (C) Proportion of bone marrow involved by leukemia before infusion in various groups. ALC kinetics (mean and 95% confidence interval) of patients who had early loss of BCA (at or before 6 months) (D) compared with patients who never lost BCA (E). (F) Violin plots of peak ALC differences between the two groups (*P = .05, Mann Whitney U test).
Relationship of ALC proliferation kinetics to preinfusion disease and BCA. (A-B) Linear regression analysis of lymphocyte expansion parameters and extent of tumor involvement in SRs, showing significant deviation from the 0 slope in SRs (peak ALC, P = .0002; ALC AUC1mo, P = .005). (C) Proportion of bone marrow involved by leukemia before infusion in various groups. ALC kinetics (mean and 95% confidence interval) of patients who had early loss of BCA (at or before 6 months) (D) compared with patients who never lost BCA (E). (F) Violin plots of peak ALC differences between the two groups (*P = .05, Mann Whitney U test).
Lymphocytosis in CSF
Given the high propensity of B-ALL to involve the CNS, CSF was analyzed at days 0 and 28, and then at 3-, 6-, 9- and 12-month time points. Baseline CSF lymphocyte counts were low (mean, 0.88; median, 0.005), whereas the paired day 28 counts were elevated (mean, 2.43; median, 1.81) in 164 patients (Figure 4). The median lymphocyte expansion from the pre-CAR to day 28 post-CAR time points was 33.3-fold (P < .0001, Wilcoxon test). Lymphocytosis predominantly comprised variably sized activated lymphocytes, with increased cytoplasm and cytotoxic granules (representative example in Figure 4B), akin to PB LGLs. Similar to PB, occasional cells were suspect for blasts when evaluated in isolation, but the overall pattern of mature lymphocytosis was reassuring. Flow cytometric analyses, when performed, showed only mature T cells and were negative for blasts. CSF lymphocytosis correlated positively with peak ALC and ALC AUC1mo (supplemental Figure 4C). Lymphocytosis was sustained beyond 1 month and was noted at the last routine evaluation at 12 months (representative subset in Figure 4D). This pattern was seen across the cohort and did not correlate with a history of CNS disease or rare occurrence of CNS relapse.
![Atypical lymphocytosis in CSF at post-CAR time points. (A) Representative example of pre-CAR CSF cytospin preparations (low [100×]- and high-power [500× magnification] views). (B) Representative example of atypical lymphocytosis in CSF cytospin preparations at a post-CAR time point (low- and high-power views). The inset shows an atypical large granular lymphocyte at 1000× magnification. (C) Comparison of CSF lymphocyte count between pre- and post-CAR time points (n = 164; ***P < .0001, Wilcoxon test). (D) CSF lymphocyte counts in a representative subset of SRs (n = 8).](https://ash.silverchair-cdn.com/ash/content_public/journal/bloodadvances/5/8/10.1182_bloodadvances.2020004038/2/m_advancesadv2020004038f4.png?Expires=1769099386&Signature=qrIeCZENiJNOVPhIovdLf6p0y8yF9Gm2DgDD5BhtCx2ML6aiLpNf7fkmxVg4rILJMaGFMke-iuizBbR3wYwHoskJ9f1F6-RrK5N0mBuo39aofMxXWkF2lOgkUuAaNGWTOix-FSIToKKqXh8IfAAD1u9HidBjqaUQdXc57mNLS7y5GRKBWd80fqQwD2dBTtDQmcUOmU5hqQGhUORv8pbibwTaIGiShA5umTfeEgK62QWLfg9XX~GIj7XbkKdg3DFhvgLN-9g1WFGlXkYZUxAOvQOs1cUlvG5kF7FFmiboQAa2XV1cB9jl603sA0ZlIF2u934bo3ZfxDKnqMD~9lPFRQ__&Key-Pair-Id=APKAIE5G5CRDK6RD3PGA)
Atypical lymphocytosis in CSF at post-CAR time points. (A) Representative example of pre-CAR CSF cytospin preparations (low [100×]- and high-power [500× magnification] views). (B) Representative example of atypical lymphocytosis in CSF cytospin preparations at a post-CAR time point (low- and high-power views). The inset shows an atypical large granular lymphocyte at 1000× magnification. (C) Comparison of CSF lymphocyte count between pre- and post-CAR time points (n = 164; ***P < .0001, Wilcoxon test). (D) CSF lymphocyte counts in a representative subset of SRs (n = 8).
Atypical lymphocytosis in CSF at post-CAR time points. (A) Representative example of pre-CAR CSF cytospin preparations (low [100×]- and high-power [500× magnification] views). (B) Representative example of atypical lymphocytosis in CSF cytospin preparations at a post-CAR time point (low- and high-power views). The inset shows an atypical large granular lymphocyte at 1000× magnification. (C) Comparison of CSF lymphocyte count between pre- and post-CAR time points (n = 164; ***P < .0001, Wilcoxon test). (D) CSF lymphocyte counts in a representative subset of SRs (n = 8).
Discussion
CD19-directed CAR T-cell products proliferate in response to their target antigen and show expansion, contraction, and persistence phases.14,17,20,21 Though CD19 CAR T-cell proliferation correlates with initial response,16,17,22 it is not widely used because of the lack of commercial CAR T-cell assays. BCA is more commonly used for monitoring CD19 CAR T-cell function,8 but is of limited utility in the first month after infusion because of unpredictable B-cell reconstitution after lymphodepleting chemotherapy. In contrast, CBC and differential counts are routinely measured and can be used to monitor lymphoid proliferation and its correlation with response. This is the first report, to our knowledge, to describe in detail the novel morphology of proliferating CD19-directed CAR T cells and the utility of lymphocyte proliferation parameters to follow response.
The first few weeks after infusion is a crucial phase for CD19-directed CAR T-cell therapy for acute leukemia, given that most of the disease response occurs during this period. Appearance of atypical immunoblasts in PB smears at the end of first week was the earliest indicator of lymphocyte proliferation. Prior studies have established that most circulating lymphocytes at this time comprise CAR T cells.17 Machine-learning algorithms of CellaVision identified an atypical lymphocyte morphology, with deeply basophilic cytoplasm with projections and polar, chunky, rod-like cytotoxic granules, that was distinct from lymphoblasts. These cells showed subtle morphological differences from the more common Downey cells of viral infections.23,24 The differences were more apparent in sorted and amplified CellaVision images than in review of manual smears. In agreement with morphological impression of LGLs, immunophenotyping of atypical lymphocytes indicated preferential expansion of cytotoxic CD8+ T cells compared with helper CD4+ T cells. However, only a minority of expanding lymphocytes persisted as normal LGLs after the contraction phase. These characteristic changes in morphology or counts were not seen in the other cell lineages during the first month and hence this phenomenon cannot be attributed to normal regeneration. In any case, myelomonocytes, not lymphocytes, are the earliest lineages to reconstitute after stem-cell therapy.25 Donor lymphocyte infusions after a regimen of fludarabine and cyclophosphamide lymphodepleting chemotherapy do not show similar lymphocyte kinetics.26 Hence, lymphoproliferation after CD19-directed CAR T-cell infusion can be attributed mostly to CD19-driven expansion rather than to homeostatic expansion or normal regeneration.
ALC proliferation parameters can be used to gauge the risk of non-response, early loss of BCA, and CD19-posR. Nonresponse is formally determined by assessment for residual blasts in the bone marrow at day 28. Although clearance of PB blasts and occurrence of cytokine release syndrome can be used as early indicators of response, many NRs also show these findings. NRs showed lower peak and overall lymphocyte proliferation compared with SRs in this study that was also noted by direct CAR T-cell measurements.16,17,22 Failure to achieve optimal peak expansion in the first or second week could be used as an early indicator of nonresponse. Lack of expansion of CAR T cells in NRs can be attributed to disease parameters or T-cell intrinsic factors.8,16,27 ALC is a measure of T-cell factors, but can also be affected by disease parameters such as extent of disease or lack of CD19 on blasts. Patients with early loss of BCA and those with eventual CD19-posR also showed lower lymphocyte proliferation that may be the earliest indicator of reduced T-cell persistence. Although the predictive power of ALC for loss of BCA or CD19posR is not high, statistical models that incorporate other confounding factors, such as pre-CAR disease burden and CAR T-cell fitness may provide higher predictive power. Factors affecting persistence of CAR T cells include the costimulatory molecule used, lymphodepletion regimen used, CD19 burden, anti-CAR immune response, and T-cell attributes.7,16,20 All the patients in our cohort received similar lymphodepleting regimens and 4-1BBζ CAR T-cell products, so they can be excluded as the cause of low persistence. Although CD19 disease burden correlated strongly with lymphocyte expansion in SRs, NRs and CD19-posRs had a higher preinfusion disease burden. It is possible that T cells from NRs and CD19-posRs were not sufficiently enriched in the memory or proliferative cells that are necessary for optimal expansion and persistence.18,20 Some SRs had lower expansion, presumably due to lower disease burden (and other factors), but it is possible that even a low number of CAR T cells were sufficient to eradicate minimal disease in these patients.
CD19-directed CAR T cells have been shown to successfully infiltrate and persist in the CNS.17 This property contributes to disease elimination and surveillance at this known treatment-resistant sanctuary site. In our study, pleomorphic lymphocytosis comprising LGLs was identified in the CSF and was noted in the CSF at 1 month after the CAR infusion time point. However, lymphocytosis persisted beyond the first month and extended to at least 12 months in many patients. Although nonmalignant lymphocytosis was occasionally noted in patients with B-ALL after treatment and transplant, pleomorphic lymphocytosis was a routine finding in most CAR T-cell–treated patients. The high efficacy of CAR T cells for CNS disease28 suggests that long-term CNS surveillance is mediated by these lymphocytes. Although hypercytokinemia during the expansion phase potentially drives the initial breach of the blood-brain barrier by CAR T cells, long-term persistence may be driven by low-level CD19 expression in brain mural cells.29
In summary, our study is the first to report a comprehensive analysis and describe the morphology and kinetics of proliferating lymphocytes after CD19-directed CAR T-cell infusion. We showed that the ALC parameters and atypical lymphocyte differential can be used as a surrogate to assess CAR T-cell expansion and assess the risk of nonresponse, CD19-posR, and early loss of BCA in B-ALL. The ease of use and access of lymphocyte parameters facilitates widespread use in treatment settings where specialized CAR T-cell assays are not readily available. Although the findings pertain to 4-1BBζ CAR T cells in B-ALL, similar methodologies can be used to investigate the utility of ALC expansion in observing CAR T-cell products in other diseases.
Cumulative data sets will be made available upon request to the corresponding author (pillaiv1@chop.edu). Individual patient data will not be shared.
Acknowledgments
The authors thank the hematology laboratory (Marybeth Helfrich and Susan Alizzo), the flow cytometry laboratory, and the CAR T-cell therapy team for contributions to the study; Robert Doms for critical review of the manuscript; and Diwakar Mohan (Johns Hopkins School of Public Health) for critical evaluation of the statistical analyses.
V.P. is a Cancer Research Institute Clinic and Laboratory Integration Program (CLIP) investigator.
Authorship
Contribution: V.P. conceived, designed, and supervised the study; all authors acquired the data; V.P., S.F., J.W., and V.G.B. analyzed and interpretated the data; and V.P., S.F., J.W., V.G.B., S.L.M., and S.R.R. wrote, reviewed, and/or revised the manuscript.
Conflict-of-interest disclosure: S.L.M. reports consultancy, advisory board and steering committee participation, and clinical trial support from Novartis, and advisory board participation for Kite and Wugen. S.A.G. has received research and/or clinical trial support from Novartis, Servier, CRISPR/Vertex, and Kite; has consulted and served on study steering committees or scientific/clinical advisory boards for Novartis, Adaptimmune, TCR2, Cabaletta, Juno, CBMG, GlaxoSmithKline, Johnson & Johnson/Janssen, CRISPR/Vertex, Roche, Humanigen, Jazz, TCR2, Cellectis, Allogene, and Cabaletta. The remaining authors declare no competing financial interests.
Correspondence: Vinodh Pillai, The Children’s Hospital of Philadelphia, 3400 Civic Center Blvd, Philadelphia, PA 19104; e-mail: pillaiv1@chop.edu.

