

Key Points
New horizons for the blood service: biosafe and customized platelets from pluripotent stem cells.
Progress of good manufacturing practice in platelets for transfusion: addressing product safety, cost, function, and challenges remaining.

Abstract
The production of in vitro–derived platelets has great potential for transfusion medicine. Here, we build on our experience in the forward programming (FoP) of human pluripotent stem cells (hPSCs) to megakaryocytes (MKs) and address several aspects of the complex challenges to bring this technology to the bedside. We first identify clinical-grade hPSC lines that generate MKs efficiently. We design a bespoke media to maximize both production and maturity of MKs and improve platelet output. Crucially, we transition the lentiviral-based FoP of hPSCs to a nonviral inducible system. We also show how small molecules promote a definitive hematopoiesis phenotype during the differentiation process, thereby increasing the quality of the final product. Finally, we generate platelets using a bioreactor designed to reproduce the physical cues that promote platelet production in the bone marrow. We show that these platelets are able to contribute to both thrombus formation in vitro and have a hemostatic effect in thrombocytopenic mice in vivo.
Introduction
The production of platelets in vitro from human pluripotent stem cells (hPSCs) offers huge potential clinical benefits, including: (a) stable, on-demand supply, a tangible benefit given the fact that donor-derived platelets have a shelf-life of 5 to 7 days; (b) biosafety, a very relevant advantage given the past history of contamination of donor-derived blood products with HIV and hepatitis C virus; and (c) the potential to address the immunological difficulties for patients alloimmunized against HLA class I antigens.1-3 The latter could be achieved through the use of carefully selected cell lines homozygous for common HLA haplotypes or genome-edited lines that do not express the HLA class I antigens.4,5 We have previously published6 a robust system for the efficient production of large numbers of highly pure megakaryocytes (MKs; the platelet mother cell) based on the forward programming (FoP) of hPSCs through the ectopic expression of 3 transcription factors (TFs) GATA1, TAL1, and FLI1 (the 3TFs).
The transition from the research bench to the clinical production of platelets represents a unique challenge that will necessitate efficient MK differentiation from hPSCs and subsequent effective platelet release. In addition, clinical manufacturing needs to take into account regulatory requirements, sourcing of reagents, and translation to a subsequent large-scale manufacturing process.
We first considered the starting material. A well-described challenge when producing somatic cells from both human embryonic stem cells (hESCs) and human inducible pluripotent stem cells (hiPSCs) is the huge variability of efficiency for any given differentiation protocol across different cell lines. This is a well-documented issue7-11 with donor-derived genetic variation rather than cell of origin being the main driver of this molecular heterogeneity.12-14 Predicting which hPSCs are likely to have a satisfactory terminally differentiated output or eliminating this variability remains one of the biggest challenges in the field, made even more crucial given the paucity of available clinical-grade cell lines and the cost of producing and qualifying such lines. We present data for MK production from both embryonic stem cells (ESCs) and inducible pluripotent stem cells (iPSCs), derived in regulatory-compliant conditions with potential for clinical-grade manufacture.
We also address challenges pertinent to the manufacturing process, focusing on cell-seeding conditions, improving MK maturation and subsequent platelet production by use of bespoke media. In addition, we show that cell output is maintained after transition into good manufacturing practice (GMP)-grade reagents.
A crucial limitation of the original FoP protocol is reliance on lentiviral vectors. Clinical-grade lentiviral vectors are costly and are a potential source of batch-to-batch variability that may present issues in terms of final product quality. We show that genetic engineering of hPSC lines to introduce an optimized Tet-ON–based inducible system,15 chemically controlling the expression of the 3TFs, drives the MK FoP as efficiently as the original lentiviral approach.
Finally, we demonstrate that FoP MKs derived from clinical-grade inducible cell lines release functional platelets using a scalable bioreactor system specifically developed for this purpose and demonstrate clinical benefit in vivo after transfusion of in vitro–derived platelets to thrombocytopenic mice.
Materials and methods
Institutional review board approval
In vivo experiments were regulated under the Animals Act 1986, Amendment Regulations 2012 following ethical review by the University of Cambridge Animal Welfare and Ethical Review Body (AWERB). Experiments were performed under Project License P667BD734 by trained, personal license (PIL) holders.
Human pluripotent cell culture
hESCs and hPSCs were obtained from the UK Regenerative Medicine Platform (UKRMP), the Human Induced Pluripotent Stem Cell Initiative (HipSci), Cell and Gene Therapy Catapult (Catapult), and National Institute of Neurological Disorders and Stroke (NINDS) Human Cell and Data Repository (NHCDR) (supplemental Table 1). hPSCs were maintained on a recombinant vitronectin (VTN-N) human substrate at 0.5 µg/cm2 (Thermo Fisher Scientific) or laminin-521 at 5 µg/mL (BioLamina) in E8 media (Thermo Fisher Scientific) and passaged using EDTA/phosphate-buffered saline or TrypLE Select (Thermo Fisher Scientific).
FoP
Lentiviral programming was carried out as described6 but incorporating recent modifications, including using 2-dimensional (2D) culture of either clumps or single cells. Briefly, 24 hours prior to transduction (day −1), hPSCs were dissociated and seeded on vitronectin plates for programming. Differentiation starts with 2 days of mesoderm induction followed by MK-specific media then disruption and seeding as a suspension culture on day 10 (see supplemental Methods for specific details). Thereafter, cells are fed every 2 to 3 days.
Inducible FoP (iMK_FoP) followed the same key steps except differentiation is initiated from the inducible cassette by the addition of doxycycline.
Generation of inducible targeting constructs
To generate inducible MK-FoP hPSC lines, we adapted the OPTi-OX system15,16 (patent 1619876.4) using TET-ON 3G, third-generation reverse tetracycline-controlled transactivator (rtTA)17 and the tetracycline-response element (TRE) promoter to drive exogenous gene expression. We target the rtTA and TRE to 2 different genomic safe harbors, using clustered regularly interspaced short palindromic repeats (CRISPR)/CRISPR-associated protein 9 (Cas9) nickase (Cas9n) constructs targeted to ROSA26 and zinc finger nucleases (ZFNs)18 targeted to the AAVS1 locus. We customized the system by replacing enhanced green fluorescent protein (eGFP) of the OPTi-OX plasmid with a polycistronic cassette containing the 3TFs and green fluorescent protein (GFP).
Generation of hiPSCs for MK-FoP
To create single-step inducible lines, low passage number parental lines were dissociated to single cells using TrypLE Select, then nucleoporated using the Nucleofector kit (Lonza) to which a mix of all 6 plasmids, 6 µg in total, in a minimal volume was added: 1 µg of pRosa26-CAG-rtTA (OPTi-OX), 1 µg of pRosa26-guideA_cas9n, 1 µg of pRosa26-guideB_cas9n, 1 µg of pAAVS1-TRE-GFP, 1 µg of pZFN_AAVS1-L-ELD, and 1 µg of pZFN_AAVS1-R-KKR (vector maps 1-6; supplemental Figure 4) were added. Selection with puromycin and G418 is started 48 hours after transfection, and colonies, which are expanded for genotyping and subsequent banking, start to appear 7 to 10 days later.
GMP translation of culture conditions
Each component of the FoP protocol was checked for compliance with GMP standards and where necessary replaced with GMP-compliant equivalents. Each component was then tested empirically beside the current laboratory-grade component.
In vitro MK and platelet analysis by flow cytometry
Flow cytometry of MKs was carried out using a Gallios flow cytometer (Beckman Coulter) using antibodies listed in supplemental Table 5. Static platelet assays were carried out using high-glucose RPMI 1640 (ATCC modification) including Calcein AM as a viability dye and flow count fluorospheres (Beckman Coulter) to determine viable platelet number.
Bioreactor
Second-generation bioreactors (Platelet BioGenesis) were seeded with an average of 2.8E+06 iLIPSC-GR1.1.2 (n = 3) and 2.9E+06 iDELTA-3.7 (n = 3) for in vitro function and an average of 1.74E+07 iLIPSC-GR1.1.2 (n = 6) for in vivo function experiments, viable MKs per run. MKs were filtered (70 µM), centrifuged at 120g for 8 minutes at room temperature, and resuspended in 10 mL of AMK.
Platelet-function assays
Platelet function was measured by flow cytometry after adding labile PG12 to temporarily sequester activation during centrifugation steps. In vitro thrombus formation under flow was performed using bioreactor-derived or donor platelets stained with CellTracker Red (Thermo Fisher Scientific) added to whole human donor blood previously stained green with 3,3′-dihexyloxacarbocyanine iodide (Sigma) and perfused through collagen-coated Vena8 Biochips (Cellex). In the murine transfusion and hemostasis model, immunodeficient NRG/J mice were platelet depleted using 0.6 μg/g body weight anti-CD42b antibody (Emfret Analytics). After confirmation of depletion for each mouse, mice were IV injected with either Tyrode buffer, washed donor or in vitro bioreactor-derived platelets. Collected mouse blood was analyzed by flow cytometry as for the in vitro assays, and hemoglobin levels were assayed using the QuantiChrom Haemoglobin Assay kit (BioAssay Systems).
Details for all methods used are available in supplemental Methods.
Results
Here, we describe how we have addressed specific challenges in translating the FoP of hPSCs toward the MK lineage for the production of platelets in vitro.
Identifying cryobanked clinical-grade hPSC lines that efficiently produce MKs by FoP
The initial step for the production of MKs by lentiviral FoP of hPSCs required 3-dimensional (3D) embryoid body formation to promote mesoderm formation (Figure 1A top panel).6 Cellular output is dependent on the number of cells forming each embryoid body, a potential challenge for translation to a GMP-compliant large-scale reproducible process. We therefore moved to a 2D system, first seeding cell clumps (Figure 1A middle panel) and subsequently single cells on a vitronectin-coated surface (Figure 1A bottom panel) to remove the inherent operator-dependent variability of the clump system. FGF2 and BMP4 were used for the first 2 days to promote mesoderm differentiation. The 2D clump culture and subsequent single-cell seeding method yielded comparable numbers of viable MKs (Figure 1B left) at comparable high purity (Figure 1B right) at day 20 of culture, consistent with the previously published data using the 3D embryoid body method. The single-cell seeding method was used for all subsequent experiments.
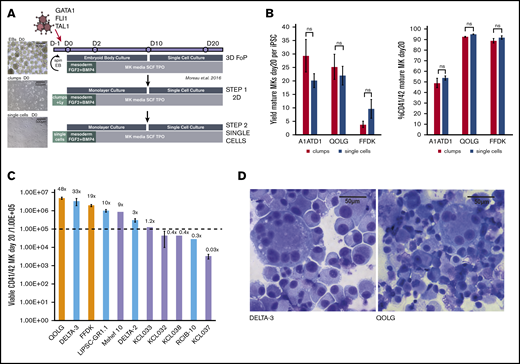
Identifying GMP-grade hPSC lines with good MK output for future clinical-grade production. (A) Refining the seeding of hPSCs for FoP. The original protocol (Moreau et al,6 top panel) uses a 3D embryoid body (EB) to promote the initial mesoderm induction step (top panel). We progressed this toward a 2D system more suited to large-scale manufacturing, first using 2D cell clumps (middle panel), then single-cell seeding (bottom panel). Images (left) show light microscope images of day 0 cultures for each method. Scale bars, 500 μm. (B) Transitioning from 3D to 2D single-cell seeding does not compromise MK yield or purity. Bar graphs for 3 hPSC lines (QOLG, FFDK, and A1ATD1) seeded as clumps or single cells showing the number of MKs (expressed per undifferentiated starting hiPSC) obtained by day 20 of culture (left graph) and their purity by percentage of mature CD41+CD42+ cells (right). Mean ± 1× standard error of the mean (SEM); n = 4. (C) Screening GMP hPSC lines for MK output by FoP. Eighteen GMP hPSC lines were tested for their MK output at day 20 using the culture protocol shown in panel A (bottom panel) alongside 2 control iPSC lines. Bar graph showing MK output for the 9 GMP lines that had over 50% CD41+CD42+ cells, including 5 hESCs (lavender bars), 4 hiPSCs (light blue bars), and 2 control hiPSC lines (orange bars). Yields are expressed per 1.00E+05 undifferentiated starting cells (dotted line) plotted on a log10 axis, Mean ± 1× SEM where n > 1. Numbers above each column are the mean yield of MKs per starting cell. (D) Cytospins of the control line QOLGand DELTA-3 at day 24 of differentiation showing large multinucleated MKs stained using Rapid Romanowsky. Scale bars, 50 μm. ns, not significant; SCF, stem cell factor; TPO, thrombopoietin.
Identifying GMP-grade hPSC lines with good MK output for future clinical-grade production. (A) Refining the seeding of hPSCs for FoP. The original protocol (Moreau et al,6 top panel) uses a 3D embryoid body (EB) to promote the initial mesoderm induction step (top panel). We progressed this toward a 2D system more suited to large-scale manufacturing, first using 2D cell clumps (middle panel), then single-cell seeding (bottom panel). Images (left) show light microscope images of day 0 cultures for each method. Scale bars, 500 μm. (B) Transitioning from 3D to 2D single-cell seeding does not compromise MK yield or purity. Bar graphs for 3 hPSC lines (QOLG, FFDK, and A1ATD1) seeded as clumps or single cells showing the number of MKs (expressed per undifferentiated starting hiPSC) obtained by day 20 of culture (left graph) and their purity by percentage of mature CD41+CD42+ cells (right). Mean ± 1× standard error of the mean (SEM); n = 4. (C) Screening GMP hPSC lines for MK output by FoP. Eighteen GMP hPSC lines were tested for their MK output at day 20 using the culture protocol shown in panel A (bottom panel) alongside 2 control iPSC lines. Bar graph showing MK output for the 9 GMP lines that had over 50% CD41+CD42+ cells, including 5 hESCs (lavender bars), 4 hiPSCs (light blue bars), and 2 control hiPSC lines (orange bars). Yields are expressed per 1.00E+05 undifferentiated starting cells (dotted line) plotted on a log10 axis, Mean ± 1× SEM where n > 1. Numbers above each column are the mean yield of MKs per starting cell. (D) Cytospins of the control line QOLGand DELTA-3 at day 24 of differentiation showing large multinucleated MKs stained using Rapid Romanowsky. Scale bars, 50 μm. ns, not significant; SCF, stem cell factor; TPO, thrombopoietin.
To identify a candidate hPSC line with satisfactory output in MKs by FoP for future clinical use, we screened a panel of 18 hPSC lines generated under GMP-compatible conditions (supplemental Table 1). Nine of the GMP cell lines tested showed mature MK purity at day 20 over 50% (5 hESCs, 4 hiPSCs) but, among those, the output varied widely, yielding between 0.03 and 48 mature MK per seeded hPSC (Figure 1C). Although the ploidy profile showed that most cells were of low ploidy (2N and 4N) as previously reported, high-ploidy MKs could be readily identified (illustrated for a control line and the best GMP hiPSC line (DELTA-3) in Figure 1D). The 2 best-performing GMP hiPSCs namely, LIPSC-GR1.1 and DELTA-3, were selected for further work.
Bespoke media improve MK maturation and platelet production in vitro
A host of GMP-grade off-the-shelf proprietary media for the production of hematopoietic cells are available but none address the specific requirement of MK cultures, particularly in terms of lipid supplementation. To release platelets, MKs dramatically reorganize their cytoplasm, making long protrusions (proplatelets) along which the nascent platelets are formed. Mature MKs therefore accumulate large reserves of membrane, known as the demarcation membrane system (DMS), during differentiation. Low-density lipoprotein supplements and the polyunsaturated fatty acids, arachidonic acid, and docosahexaenoic acid have been shown to increase the production of MKs from hematopoietic progenitors.14,19-22 We developed a bespoke culture medium (called AMK; supplemental Table 2) based on a standard basal medium into which chemically defined supplements were added including a variety of lipids, ensuring that a GMP-grade equivalent reagent was available for each component. Using a research-grade cell line (QOLG; supplemental Table 1) and the 2 clinical-grade cell lines LIPSC-GR1.1 and DELTA-3, we compared AMK vs the previously published proprietary medium (culture medium [CM]) and showed MK numbers were marginally increased in AMK, to 15 MKs per iPSC for LIPSC-GR1.1 and 80 MKs per iPSC for DELTA-3 at day 20 (Figure 2A), and the purity maintained (Figure 2B). Cultures showed occasional highly polynucleated MKs in both culture conditions (Figure 2C). However, assessing cytoplasmic maturity of the DMS using glycoprotein Ibβ (GPIbβ; CD42c) staining using the class I-IV system23,24 revealed a much higher proportion of MKs containing a fully developed DMS system in AMK (Figure 2D). These results were confirmed by electron microscopy in which MKs cultured in AMK showed developing DMS in areas (Figure 2E). This translated to a gain in proplatelet extensions (Figure 2F left) with more branches (Figure 2F right).
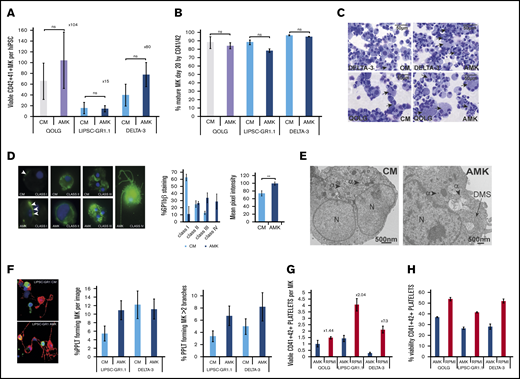
Optimizing culture conditions to improve MK maturity and platelet production. (A-B) Bar graphs comparing previously published culture medium (CM) and bespoke medium (AMK) showing the number of viable MK per starting hiPSCs at day 20 posttransduction (A) and purity (percentage of CD41+CD42+ cells) (B). Mean ± 1× SEM; n = 3. Results are shown for a control hiPSC line (gray/lavender bars) and 2 clinical-grade hiPSC lines (blue bars). (C) Cytospins of day 20 MKs from the control QOLG and clinical-grade DELTA-3 lines cultured in either CM or AMK stained using Rapid Romanowsky. Scale bars, 50 μm. Black arrows indicate polynucleated MKs. Examples of cytospins performed for each experiment. (D) DMS assessment. Left: fluorescent immunohistochemistry images of DELTA-3 FoP MKs cultured in AMK or CM as indicated and stained for GPIbβ (CD42C, green) and nuclei stained using 4′,6-diamidino-2-phenylindole (DAPI; blue), classified according to their DMS development as per Aguilar et al24 (supplemental Methods). Magnification ×60. Left bar graph: the percentage of MKs at each level of maturity for MKs grown in CM or AMK. There is an increase in both class III and IV MKs in AMK and a significant increase in the average mean pixel intensity (right graph) for GPIbβ. **P ≤ .005. Analysis of variance (ANOVA) combining data from all classes. Data from DELTA-3; n = 3, 125 images. (E) Transmission electron microscopy images of mature DELTA-3 MKs cultured in either CM or AMK. MKs cultured in CM (left) have a heterogeneous granule population including α granules (arrowheads) but lack a DMS. MKs grown in AMK (right) show both granules and the beginning of a DMS network (black arrow). Scale bars, 500 nm. Twelve images were examined for CM and 9 for AMK. (F) Proplatelet formation was assessed in MKs derived from both LIPSC-GR1.1 and DELTA-3 and cultured in CM or AMK. Representative immunohistochemistry images of LIPSC-GR1.1 MKs showing α tubulin (green), F-actin (red), and DAPI 1 μg/mL (blue). Magnification ×60. The percentage of MKs showing at least 1 proplatelet extension (left graph) and the percentage of multibranched proplatelet forming MKs (right graph) was increased in AMK. Ten images were examined per sample from n = 2 biological replicates. Error bars indicate the range in values. Mean ± 1× SD. (G) Platelet production by mature MKs transferred to high-glucose cytokine-free medium (RPMI 1640) for 72 hours was assessed by flow cytometry. The percentage of viable (by Calcein-AM) platelet-size CD41+CD42+ particles produced by QOLG, LIPSC-GR1.1, and DELTA-3 increased compared with leaving the MKs in cytokine-free AMK when mature. An increase in platelets produced per MK ranging from 2.84-fold to 7.3-fold was seen for iLIPSC-GR1.1.2 and iDELTA-3.7, respectively. Error bars indicate the range in values. Mean ± 1× SD; n = 2. (H) Viability by Calcein-AM of the platelet-size CD41+CD42+ particles also significantly increased for QOLG and iLIPSC-GR1.1.2. Error bars indicate the range in values. Mean ± 1× SD; n = 2.
Optimizing culture conditions to improve MK maturity and platelet production. (A-B) Bar graphs comparing previously published culture medium (CM) and bespoke medium (AMK) showing the number of viable MK per starting hiPSCs at day 20 posttransduction (A) and purity (percentage of CD41+CD42+ cells) (B). Mean ± 1× SEM; n = 3. Results are shown for a control hiPSC line (gray/lavender bars) and 2 clinical-grade hiPSC lines (blue bars). (C) Cytospins of day 20 MKs from the control QOLG and clinical-grade DELTA-3 lines cultured in either CM or AMK stained using Rapid Romanowsky. Scale bars, 50 μm. Black arrows indicate polynucleated MKs. Examples of cytospins performed for each experiment. (D) DMS assessment. Left: fluorescent immunohistochemistry images of DELTA-3 FoP MKs cultured in AMK or CM as indicated and stained for GPIbβ (CD42C, green) and nuclei stained using 4′,6-diamidino-2-phenylindole (DAPI; blue), classified according to their DMS development as per Aguilar et al24 (supplemental Methods). Magnification ×60. Left bar graph: the percentage of MKs at each level of maturity for MKs grown in CM or AMK. There is an increase in both class III and IV MKs in AMK and a significant increase in the average mean pixel intensity (right graph) for GPIbβ. **P ≤ .005. Analysis of variance (ANOVA) combining data from all classes. Data from DELTA-3; n = 3, 125 images. (E) Transmission electron microscopy images of mature DELTA-3 MKs cultured in either CM or AMK. MKs cultured in CM (left) have a heterogeneous granule population including α granules (arrowheads) but lack a DMS. MKs grown in AMK (right) show both granules and the beginning of a DMS network (black arrow). Scale bars, 500 nm. Twelve images were examined for CM and 9 for AMK. (F) Proplatelet formation was assessed in MKs derived from both LIPSC-GR1.1 and DELTA-3 and cultured in CM or AMK. Representative immunohistochemistry images of LIPSC-GR1.1 MKs showing α tubulin (green), F-actin (red), and DAPI 1 μg/mL (blue). Magnification ×60. The percentage of MKs showing at least 1 proplatelet extension (left graph) and the percentage of multibranched proplatelet forming MKs (right graph) was increased in AMK. Ten images were examined per sample from n = 2 biological replicates. Error bars indicate the range in values. Mean ± 1× SD. (G) Platelet production by mature MKs transferred to high-glucose cytokine-free medium (RPMI 1640) for 72 hours was assessed by flow cytometry. The percentage of viable (by Calcein-AM) platelet-size CD41+CD42+ particles produced by QOLG, LIPSC-GR1.1, and DELTA-3 increased compared with leaving the MKs in cytokine-free AMK when mature. An increase in platelets produced per MK ranging from 2.84-fold to 7.3-fold was seen for iLIPSC-GR1.1.2 and iDELTA-3.7, respectively. Error bars indicate the range in values. Mean ± 1× SD; n = 2. (H) Viability by Calcein-AM of the platelet-size CD41+CD42+ particles also significantly increased for QOLG and iLIPSC-GR1.1.2. Error bars indicate the range in values. Mean ± 1× SD; n = 2.
In vitro platelet production for the clinic will be a 2-stage process requiring first MK production in liquid culture followed by subsequent platelet release, in bespoke bioreactors. Proplatelet formation is an active, metabolically demanding cellular process. Recent data suggest that high glucose-containing storage media improve donor-derived platelet viability.25,26 Transferring mature MKs cultured in AMK into a cytokine-free, glucose-rich basal medium showed that, at 72 hours even in static liquid-culture conditions, the high-glucose media markedly improved the number of platelets released per MK (threefold and sevenfold for LIPSC-GR1.1 and DELTA-3, respectively), when compared with MKs that were assayed for platelet release in cytokine-free AMK (Figure 2G). This was in part driven by an increase in platelet viability as indicated by the vital dye Calcein-AM (Figure 2H).
We confirmed the efficacy of AMK followed by high-glucose media for platelet production in MKs derived from primary CD34+ hematopoietic progenitors (supplemental Figure 1).
Single-cell seeding, followed by our GMP-compatible medium for MK expansion and finally a cytokine-free high-glucose medium for platelet release in combination, resulted in average yields of 57 (±24) and 165 (±47) viable platelets per starting iPSC for LIPSC-GR1.1 and DELTA-3, respectively. This demonstrates that GMP-grade culture media can be created from readily available base reagents and that tailoring the content of the media to the cell type of interest can produce improvement in both the quality and quantity of cells produced. We specifically demonstrate that lipid supplementation produces MKs with improved DMS structure (Figure 2) and ultimately better platelet output.
Viral-free FoP using genetically engineered hPSC lines
The published6 FoP method to produce MKs from hPSCs relies on transduction of the stem cells with 3 lentiviral vectors for overexpression of the 3TFs GATA1, FLI1, and TAL1. Programming using lentiviral overexpression of TFs is increasingly being used to promote the efficiency of differentiation protocols, promote terminal maturation, and increase purity of the final product.27-29 Large-scale GMP MK production by this route would require the sourcing of large quantities of clinical-grade lentiviral vectors, with significant cost implications. In addition, batch-to-batch variations may have considerable influence on the reproducibility of transductions generating a polyclonal population. This led to exploration of the efficacy of using genetically engineered clonal cell lines embedding an optimized inducible expression cassette based on a dual genetic safe harbor–targeting strategy15 as an alternative for translation progression. The OPTi-OX system uses the TET-ON 3G, third-generation rtTA constitutively expressed through a CAG promoter targeted to the ROSA26 locus. The Tet-responsive inducible expression cassette is targeted to the AAVS1 locus. The 3TFs, together with a GFP reporter, were introduced as a polycistronic sequence (PC3) into the OPTi-OX inducible cassette, separated by 3 different self-cleaving 2A peptide sequences, ensuring production of 4 individual proteins from 1 messenger RNA via ribosomal skipping.30,31 Two different antibiotic-resistance sequences, neomycin in the pROSA-neo CAG-rtTA vector and puromycin in the pAAVS1-puro TRE-PC3 vector, enabled selection of double-targeted hPSC clones in a single-step transfection. A summary of the targeting and clone selection strategy is depicted in Figure 3A and detailed in supplemental Results.
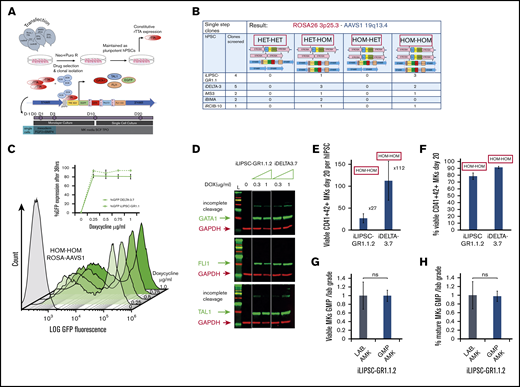
Doxycycline inducible lines for the production of MKs. (A) Scheme illustrating the targeting, clone selection, and culture of inducible cell lines. We simultaneously targeted the Rosa 26 (pRosa_neo CAG-rtTA expressing the protein rtTA) and the AAVS1 (pAAVS1-puro TRE-PC3 expressing GFP and the 3TFs) loci using nucleofection followed by simultaneous neomycin and puromycin selection. Upon doxycycline addition to the culture medium, GFP and the 3TFs are expressed as individual proteins; each TF was preceded by a self-cleaving 2A oligopeptide. Cells are cultured in the optimized media AMK with a 3-day mesoderm inducible step allowing for the slower dynamic of differentiation compared with lentiviral transduction. (B) Genome-editing efficiency. We show the outcome of the single-step targeting strategy for 5 independent lines (4× hiPSC and 1× hESC) from which a total of 14 clones were screened. The panel at the top indicates state of the ROSA (pink bars) and AAVS1(blue bars) alleles in the various clones. HET signifies that only 1 allele was correctly targeted whereas HOM denotes correct targeting on both alleles. (C) GFP expression as a proxy for the polycistronic cassette expression was measured by flow cytometry. Overlaid histograms are shown for a range of doxycycline concentrations for 1 HOM-HOM clone (iDELTA-3.7). The inset line graph shows the percentage of GFP expression at 36 hours reaches a plateau at 0.25 μg/mL doxycycline for both iDELTA-3.7 (solid line) and iLIPSC-GR1.1.2 (dotted line). Mean ± 1× SEM; n = 3. (D) Single protein transcripts for GATA1, TAL1, and FLI1 are produced from the polycistronic cassette. Western blots for 2 inducible lines iLIPSC-GR1.1.2 and iDELTA-3.7 at increasing doxycycline doses. The 0 μg/mL doxycycline dose is a 50:50 mix of both lines. Lysates were harvested on day 3 of the differentiation protocol. Individual proteins are seen for each of the 3TFs in the inducible cell line sample, however, a small proportion of the total TF protein is expressed as a “fusion” protein, due to incomplete cleavage at the 2A sequences. (E-F) The inducible cell lines iLIPSC-GR1.1.2 and iDELTA-3.7 differentiate into MKs readily upon addition of doxycycline. Bar graphs showing MK yield expressed per 1.00E+05 undifferentiated starting cells (E) and purity (percentage of CD41+CD42+ MKs) (F) at day 20 of differentiation. Mean ± 1× SEM; n = 10 iLIPSC-GR1.1.2; n = 15 iDELTA-3.7. (G-H) Testing GMP-grade culture components. Bar graphs showing the number (G) and the percentage (H) of viable CD41+CD42+ MKs at day 20 postinduction for iLIPSC-GR1.1.2 cultured with GMP (blue)-grade reagents expressed relative to laboratory-grade reagents. Mean ± 1× SEM, n = 3. Dox, doxycycline; E2A, equine rhinitis A virus; Neo, neomycin; P2A, porcine teschovirus-1; Puro, puromycin; T2A, Thoseaasigna virus are the self-cleaving oligopepetides; both TAL1 and FLI1 are codon optimized; TRE 3GV, third-generation Tet response element; .
Doxycycline inducible lines for the production of MKs. (A) Scheme illustrating the targeting, clone selection, and culture of inducible cell lines. We simultaneously targeted the Rosa 26 (pRosa_neo CAG-rtTA expressing the protein rtTA) and the AAVS1 (pAAVS1-puro TRE-PC3 expressing GFP and the 3TFs) loci using nucleofection followed by simultaneous neomycin and puromycin selection. Upon doxycycline addition to the culture medium, GFP and the 3TFs are expressed as individual proteins; each TF was preceded by a self-cleaving 2A oligopeptide. Cells are cultured in the optimized media AMK with a 3-day mesoderm inducible step allowing for the slower dynamic of differentiation compared with lentiviral transduction. (B) Genome-editing efficiency. We show the outcome of the single-step targeting strategy for 5 independent lines (4× hiPSC and 1× hESC) from which a total of 14 clones were screened. The panel at the top indicates state of the ROSA (pink bars) and AAVS1(blue bars) alleles in the various clones. HET signifies that only 1 allele was correctly targeted whereas HOM denotes correct targeting on both alleles. (C) GFP expression as a proxy for the polycistronic cassette expression was measured by flow cytometry. Overlaid histograms are shown for a range of doxycycline concentrations for 1 HOM-HOM clone (iDELTA-3.7). The inset line graph shows the percentage of GFP expression at 36 hours reaches a plateau at 0.25 μg/mL doxycycline for both iDELTA-3.7 (solid line) and iLIPSC-GR1.1.2 (dotted line). Mean ± 1× SEM; n = 3. (D) Single protein transcripts for GATA1, TAL1, and FLI1 are produced from the polycistronic cassette. Western blots for 2 inducible lines iLIPSC-GR1.1.2 and iDELTA-3.7 at increasing doxycycline doses. The 0 μg/mL doxycycline dose is a 50:50 mix of both lines. Lysates were harvested on day 3 of the differentiation protocol. Individual proteins are seen for each of the 3TFs in the inducible cell line sample, however, a small proportion of the total TF protein is expressed as a “fusion” protein, due to incomplete cleavage at the 2A sequences. (E-F) The inducible cell lines iLIPSC-GR1.1.2 and iDELTA-3.7 differentiate into MKs readily upon addition of doxycycline. Bar graphs showing MK yield expressed per 1.00E+05 undifferentiated starting cells (E) and purity (percentage of CD41+CD42+ MKs) (F) at day 20 of differentiation. Mean ± 1× SEM; n = 10 iLIPSC-GR1.1.2; n = 15 iDELTA-3.7. (G-H) Testing GMP-grade culture components. Bar graphs showing the number (G) and the percentage (H) of viable CD41+CD42+ MKs at day 20 postinduction for iLIPSC-GR1.1.2 cultured with GMP (blue)-grade reagents expressed relative to laboratory-grade reagents. Mean ± 1× SEM, n = 3. Dox, doxycycline; E2A, equine rhinitis A virus; Neo, neomycin; P2A, porcine teschovirus-1; Puro, puromycin; T2A, Thoseaasigna virus are the self-cleaving oligopepetides; both TAL1 and FLI1 are codon optimized; TRE 3GV, third-generation Tet response element; .
This targeting strategy (Figure 3B) yielded 50% of clones containing the correct insert in both alleles of the ROSA26 and AAVS1 loci and are referred to as HOM-HOM clones. The remaining clones were HET-HOM clones where only a single allele of the Rosa 26 locus showed insertion of the rtTA cassette. Each of these clones grew as classical tightly packed colonies with defined edges and expressed markers of pluripotency (supplemental Figure 2A-B). The third-generation TET ON/OFF system allows tight control of the transgenic cassette expression, notably avoiding TF expression leaks, which allows the genetically engineered cell lines to remain pluripotent over months in culture. We assessed the genetic integrity postediting of 2 inducible clones derived from LIPSC-GR1.1 and DELTA-3 and show that each inducible clone has a normal karyotype (supplemental Figure 2C), and that both DELTA-3 and its inducible derivative showed no abnormalities using Affymetrix CytoScan 750K single-nucleotide polymorphism genotyping arrays. The parent LIPSC-GR1.1 line and its inducible clone both showed an interstitial gain of chromosome Xq26.2 of FIRRE, a noncoding RNA, and STK26 (MST4), a serine /threonine kinase (supplemental Figure 2D), which is known to be constitutional and not related to culture conditions.32
HOM-HOM clones were generated from 3 LIPSC-GR1.1 and 2 DELTA-3 clones. iLIPSC-GR1.1.2 and iDELTA-3.7 were selected for further work. The FoP culture protocol with the inducible cell lines was as described for viral programming with the exception of a 3-day mesoderm induction rather than 2 day. We noted that the number and purity of MKs produced were improved with the longer mesoderm-induction phase (supplemental Figure 3A). We believed this related to the different dynamic of transgene expression with the inducible system compared with lentiviral overexpression (supplemental Figure 3B-C). A robust induction of GFP expression in iLIPSC-GR1.1.2 and iDELTA-3.7 upon addition of doxycycline reached a maximum at 24 to 36 hours postinduction using 0.25 μg/mL doxycycline (Figure 3C; supplemental Figure 3B top). Thereafter, the fluorescent signal rapidly faded.
Western blot analysis of cell lysates generated 72 hours following doxycycline induction confirmed the presence of all 3 individual TFs (Figure 3D).
Despite the short-lived expression of the FoP TFs, it was still sufficient to produce an MK output slightly better than that seen with the lentiviral overexpression system. By day 20 of culture, iLIPSC-GR1.1.2 and iPCG3.7 showed an average yield of 27 and 112 mature MKs per starting iPSC, respectively (Figure 3E) (a 1.4-fold to 1.8-fold improvement from the output shown in Figure 2A) with a purity > 80% for both inducible cell lines (Figure 3F).
All cultures described were carried out using research-grade reagents. By replacing all culture reagents with either equivalent components or alternatives suitable for the production of a clinical-grade product (supplemental Table 2), we show for iLIPSC-GR1.1.2 (Figure 3G-H) that both purity and MK numbers obtained in the cultures using GMP reagents were comparable to the research-grade cultures for iLIPSC-GR1.1.2. This indicates the robustness of differentiation by FoP.
Promoting a definitive hematopoiesis phenotype
hPSC-derived somatic cells showing an “embryonic” phenotype, which may confer different functionality to these cells compared with their counterpart “adult” cells (eg, pancreatic β islet cells,33 neurons,34 and erythroblasts35 ), has been well documented. This is particularly well known in the case of hematopoiesis, where the distinction between “primitive” embryonic cells and “definitive” adult cells has profound phenotypic consequences. hPSC-derived erythroblasts, for example, poorly enucleate and express embryonic and fetal globins. We and others have previously documented this embryonic vs adult identity for MKs.36-39 The embryonic signature in hPSC-derived MKs results in the consistent overexpression/underexpression of some genes that reflect their origin.40 Genes playing key roles in MK maturation and platelet function, such as GPVI,41 tetraspanin CD9,42 or von Willebrand factor (VWF), are poorly expressed in hPSC-derived MKs.36,43 Platelet-function studies in newborns and particularly premature babies suggest that fetal platelets may be less reactive44 than adult platelets. To this day, however, there is no clear evidence that platelets produced from hPSCs in vitro are less functional than their adult counterpart, although this may be related to the difficulty of carrying detailed functional analyses due to low yields of viable platelets produced in vitro.
The addition of the specific glycogen synthase kinase 3β inhibitor CHIR99021 (CHIR), activating the Wnt-signaling pathway (supplemental Figure 5A), during early mesoderm specification has been shown to favor the specification of definitive hematopoiesis using iPSC-derived hematopoietic stem cells.45,46 We therefore hypothesize that a similar effect could be seen in the MK lineage.
Using quantitative polymerase chain reaction (PCR), we showed that the transient addition of CHIR99021 at the start of FoP during mesoderm commitment prolonged Brachyury (T) expression (Figure 4A) and upregulated expression of known downstream TFs such as HOXA9, CDX4, and, to a lesser extent, SALL4 (Figure 4A).
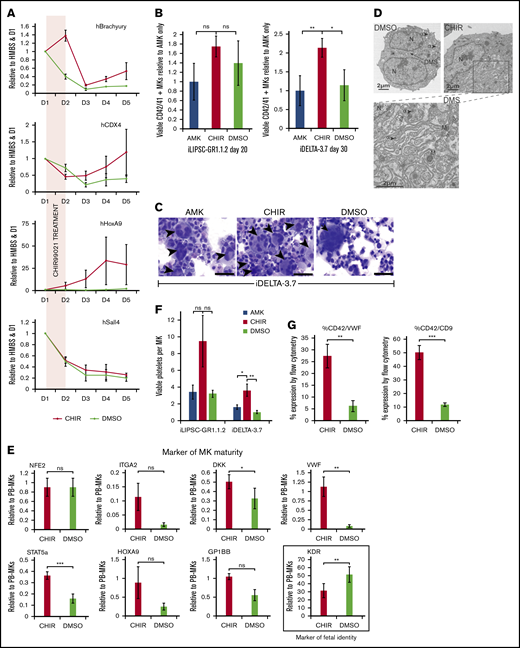
The small molecule inhibitor CHIR99021 enhances the maturity of FoP-MKs via wnt pathway activation. (A) Profiles for the expression of downstream Wnt target genes following 24-hour exposure to CHIR99021. Differentiating cells were treated with the CHIR99021 inhibitor between D1 and D2 (shaded panel) during mesoderm induction (indicated by the expression of Brachyury). Quantitative PCR graphs showing expression of CDX4, HoxA9 and Sall4 between day 0 and day 5 postinduction for iDELTA-3.7 CHIR99021 (red), DMSO control (green). All are expressed relative to HMBS, as the endogenous control, and D1 levels; n = 3 biological replicates; mean ±1× SEM. HoxA9 expression remains significantly. **P < .01 upregulated at day 5. (B) MK maturation from iLIPSC-GR1.1.2 and iDELTA-3.7 with CHIR99021. Bar graphs showing the number of viable MKs for iLIPSC-GR1.1.2 on day 20 and iDELTA-3.7 on day 30 expressed relative to AMK. AMK (blue bar), CHIR99021 (red bar) or DMSO (green bar). Viable MKs for iLIPSC-GR1.1.2 peak earlier at D20 in CHIR99021 treated cultures. Mean ±1× SEM; n = 6 biological replicates, AMK vs CHIR99021 and CHIR99021 vs DMSO are not significantly different using Kruskal-Wallis multiple comparison test. Viable MKs at day 30 for iDELTA-3.7 are significantly higher in CHIR99021 treated cultures using Kruskal-Wallis multiple comparison test AMK vs CHIR99021, **P = .007; AMK vs DMSO, P = ns; CHIR99021 vs DMSO, *P = .01. Mean ± 1× SEM; n = 12 biological replicates. (C) Cytospins of iDELTA-3.7 MKs cultured in either AMK alone, with CHIR99021 or with DMSO (control for CHIR99021) stained using Rapid Romanowski. Black arrowsheads indicate multinucleated cells. Multinucleated MKs are more frequent in the CHIR99021 samples although rare large cells are also seen in the DMSO as illustrated here. Scale bars, 50 μm. (D) Transmission electron microscopy of mature iDELTA3.7 MKs at day 27 reveals a much more extensive DMS in the CHIR99021-treated cells. Scale bars, 2 μm, α granules (α), dense granules (δ), multilobular nucleus (N), mitochondria (M). Left image DMSO sample ×1700 (8 images examined), right CHIR99021-treated samples ×1700 (15 images examined). The rectangle indicates the magnified area shown of the cytoplasmic DMS (below) ×3500. (E) Switch from “embryonic” to “adult” phenotype in CHIR99021-treated MKs. Bar graphs showing expression levels of a panel of markers of MK maturity. CHIR99021-treated iDELTA-3.7 derived MKs have levels of messenger RNA expression closer to those seen in peripheral blood (PB)–derived MKs. After normalization to the endogenous control gene HMBS, results are expressed relative to PB-derived MKs calculated using the relative standard curve method. Bars: red, CHIR99021-treated iMKs; green, DMSO control. Mean ± 1× SEM, n = 3. KDR, a marker of fetal identity, is significantly reduced compared with the DMSO control, **P < .01, Mean ± 1× SEM, n = 7, VWF, a marker of “adult” phenotype is significantly increased compared with the DMSO control **P < .01, Mean ± 1× SEM, n = 5 as is STAT5a ***P < .001, Mean ± 1× SEM, n = 3 and DKK1 *P < .05, Mean ± 1× SEM, n = 3. The maturity markers ITGA2 (CD49b) n = 3, HOXA9 n = 6 and GPIbβ (CD42C) n = 3 all Mean ± 1× EM, P = ns. (F) Platelet production from CHIR99021-treated MKs is increased. Bar graph showing the number of viable Calcein-AM+ CD41+ CD42+ (left) platelets produced per MK for platelets derived from iLIPSC-GR1.1.2 (n = 3) and iDELTA-3.7 (n = 8) from MKs cultured in AMK alone (blue bars), CHIR99021 (red), or vehicle control (green). The increase is nonsignificant for iLIPSC-GR1.1.2 for both AMK vs CHIR99021 and CHIR99021 vs DMSO, for iDELTA-3.7 *P = .03 for AMK vCHIR99021 and **P = .08 for CHIR99021 vs DMSO using ANOVA plus Bonferroni’s multiple comparison test. Mean ± 1× SEM. iLIPSC-GR1.1.2, n = 3 and iDELTA-3.7 n = 8. (G) Expression of VWF and CD9 proteins is increased in CHIR99021-treated MKs shown for iDELTA3.7. VWF expression was assessed by flow cytometry. Both VWF and CD9 expression are elevated by CHIR99021 treatment. Top bar chart shows %CD42a+VWF+ and bottom %CD42a+CD9+ both show a significant increase in CHIR99021 treated cultures compared with DMSO control. CHIR99021 vs DMSO for % CD42a+VWF+ **P < .01, CHIR99021vs DMSO for % CD42a+CD9+ ***P < .001, Mean ±1× SEM, n = 5.
The small molecule inhibitor CHIR99021 enhances the maturity of FoP-MKs via wnt pathway activation. (A) Profiles for the expression of downstream Wnt target genes following 24-hour exposure to CHIR99021. Differentiating cells were treated with the CHIR99021 inhibitor between D1 and D2 (shaded panel) during mesoderm induction (indicated by the expression of Brachyury). Quantitative PCR graphs showing expression of CDX4, HoxA9 and Sall4 between day 0 and day 5 postinduction for iDELTA-3.7 CHIR99021 (red), DMSO control (green). All are expressed relative to HMBS, as the endogenous control, and D1 levels; n = 3 biological replicates; mean ±1× SEM. HoxA9 expression remains significantly. **P < .01 upregulated at day 5. (B) MK maturation from iLIPSC-GR1.1.2 and iDELTA-3.7 with CHIR99021. Bar graphs showing the number of viable MKs for iLIPSC-GR1.1.2 on day 20 and iDELTA-3.7 on day 30 expressed relative to AMK. AMK (blue bar), CHIR99021 (red bar) or DMSO (green bar). Viable MKs for iLIPSC-GR1.1.2 peak earlier at D20 in CHIR99021 treated cultures. Mean ±1× SEM; n = 6 biological replicates, AMK vs CHIR99021 and CHIR99021 vs DMSO are not significantly different using Kruskal-Wallis multiple comparison test. Viable MKs at day 30 for iDELTA-3.7 are significantly higher in CHIR99021 treated cultures using Kruskal-Wallis multiple comparison test AMK vs CHIR99021, **P = .007; AMK vs DMSO, P = ns; CHIR99021 vs DMSO, *P = .01. Mean ± 1× SEM; n = 12 biological replicates. (C) Cytospins of iDELTA-3.7 MKs cultured in either AMK alone, with CHIR99021 or with DMSO (control for CHIR99021) stained using Rapid Romanowski. Black arrowsheads indicate multinucleated cells. Multinucleated MKs are more frequent in the CHIR99021 samples although rare large cells are also seen in the DMSO as illustrated here. Scale bars, 50 μm. (D) Transmission electron microscopy of mature iDELTA3.7 MKs at day 27 reveals a much more extensive DMS in the CHIR99021-treated cells. Scale bars, 2 μm, α granules (α), dense granules (δ), multilobular nucleus (N), mitochondria (M). Left image DMSO sample ×1700 (8 images examined), right CHIR99021-treated samples ×1700 (15 images examined). The rectangle indicates the magnified area shown of the cytoplasmic DMS (below) ×3500. (E) Switch from “embryonic” to “adult” phenotype in CHIR99021-treated MKs. Bar graphs showing expression levels of a panel of markers of MK maturity. CHIR99021-treated iDELTA-3.7 derived MKs have levels of messenger RNA expression closer to those seen in peripheral blood (PB)–derived MKs. After normalization to the endogenous control gene HMBS, results are expressed relative to PB-derived MKs calculated using the relative standard curve method. Bars: red, CHIR99021-treated iMKs; green, DMSO control. Mean ± 1× SEM, n = 3. KDR, a marker of fetal identity, is significantly reduced compared with the DMSO control, **P < .01, Mean ± 1× SEM, n = 7, VWF, a marker of “adult” phenotype is significantly increased compared with the DMSO control **P < .01, Mean ± 1× SEM, n = 5 as is STAT5a ***P < .001, Mean ± 1× SEM, n = 3 and DKK1 *P < .05, Mean ± 1× SEM, n = 3. The maturity markers ITGA2 (CD49b) n = 3, HOXA9 n = 6 and GPIbβ (CD42C) n = 3 all Mean ± 1× EM, P = ns. (F) Platelet production from CHIR99021-treated MKs is increased. Bar graph showing the number of viable Calcein-AM+ CD41+ CD42+ (left) platelets produced per MK for platelets derived from iLIPSC-GR1.1.2 (n = 3) and iDELTA-3.7 (n = 8) from MKs cultured in AMK alone (blue bars), CHIR99021 (red), or vehicle control (green). The increase is nonsignificant for iLIPSC-GR1.1.2 for both AMK vs CHIR99021 and CHIR99021 vs DMSO, for iDELTA-3.7 *P = .03 for AMK vCHIR99021 and **P = .08 for CHIR99021 vs DMSO using ANOVA plus Bonferroni’s multiple comparison test. Mean ± 1× SEM. iLIPSC-GR1.1.2, n = 3 and iDELTA-3.7 n = 8. (G) Expression of VWF and CD9 proteins is increased in CHIR99021-treated MKs shown for iDELTA3.7. VWF expression was assessed by flow cytometry. Both VWF and CD9 expression are elevated by CHIR99021 treatment. Top bar chart shows %CD42a+VWF+ and bottom %CD42a+CD9+ both show a significant increase in CHIR99021 treated cultures compared with DMSO control. CHIR99021 vs DMSO for % CD42a+VWF+ **P < .01, CHIR99021vs DMSO for % CD42a+CD9+ ***P < .001, Mean ±1× SEM, n = 5.
There was a trend toward an improvement in the number of mature MKs obtained by day 20 with iLIPSC-GR1.1.2 (Figure 4B left) and a significant twofold increase in the number of MKs obtained from iDELTA-3.7 (Figure 4B right). In the case of the latter cell line, CHIR99021 altered the dynamic of MK production with a peak in MK output occurring later at day 30 (supplemental Figure 5B), reflecting again the inherent differences in the iPSC line response to differentiation clues. Although the ploidy profile remained unaffected, highly polynucleated MKs were again readily seen in the cytospins (Figure 4C).
Staining for GP1Bβ of CHIR99021-treated cultures showed a further trend toward stage III/IV mature MKs (supplemental Figure 5C) but not significantly more than that reported herein following culture in the AMK medium. However, in some of the CHIR99021-treated MKs, a more highly developed DMS was revealed by electron microscopy (Figure 4D). The marked change induced by CHIR99021, which is only present in culture for 24 hours between days 1 to 2 of programming, in the hPSC-derived MKs suggests attenuation of a primitive hematopoietic developmental program and a switch to a more “definitive” adult phenotype.47 Using quantitative PCR, we show in CHIR99201-treated cells an increase in the expression of genes that we and others have shown to be expressed at lower levels in hPSC-derived MKs compared with MKs derived from adult peripheral blood CD34+ progenitors, namely VWF, NFE2, STAT5A, and HOXA9 and the surface-expressed DKK1, GP1bβ, and ITGA2 (CD49b) (Figure 4E). Similarly, we found a decrease in expression of KDR, a marker of fetal MK identity36 in CHIR99021-treated cells. This translated to an increase in the number of platelets released by iDELTA-3.7 and iLIPSC-GR1.1.2 (Figure 4F) after passaging cells into RPMI 1640.
The increased expression of VWF was confirmed at the protein level by flow cytometry (Figure 4G; supplemental Figure 5D) and mirrored by increased CD9 expression (Figure 4G; supplemental Figure 5E). Both are located on chromosome 12 at adjacent loci and their promoters may be subject to control by the same enhancer element,48 suggesting that the effect of CHIR99021 is mediated through epigenetic changes.
Platelet production in bioreactor
The feasibility of the production of platelets in vitro in clinically relevant quantities (3 × 10¹¹ platelets per transfusion unit) is made easier by the final amplification step, namely the vast number of platelets that are potentially released per individual MK (estimated to be 1000-2000 in vivo). The bioreactor design used here reproduces one of the cues that promote platelet production in the bone marrow, namely shear stress. Platelet production from optimally cultured iLIPSC-GR1.1.2 and iDELTA-3.7 was performed using a bespoke bioreactor49 (Figure 5A-B). Bioreactors were seeded with 3.0E+06 viable mature MKs for each cell line and samples were collected during 3 separate 4-hour runs. The total yield of collected platelets included those that were present in the seeded MK suspension (infusion-recovered platelets) as well as those newly formed within the bioreactor. Runs with iLIPSC-GR1.1.2 yielded an average total of 1.80E+07 platelets corresponding to 368 platelets per starting iPSC and 11 platelets per MK (Figure 5C top). Runs with iDELTA-3.7 yielded 1.65E+07 platelets corresponding to 566 platelets per starting iPSC and 6 platelets per MK (Figure 5C bottom). For these measurements, platelets were defined as per the proposed criteria.50 If platelets were defined with the less rigorous criteria of particles expressing CD41 and CD42, the yields were 535 and 1022 platelets per hiPSC for GR1.1.2 and iDELTA-3.7, respectively (corresponding to 19 and 10 platelets per MK, respectively). The appearance of newly produced platelets within the bioreactor is marked by a shift in the forward scatter/side scatter plots reflecting the larger size of newly produced platelets (supplemental Figure 6A; supplemental Video 1) and an increase in the viability of the platelets compared with platelets in the original MK static suspension (supplemental Figure 6B). Bioreactor-generated platelets (an example is shown in Figure 5E) infused into whole-blood samples were able to contribute to thrombus formation in collagen-coated flow chambers51 to the same extent as donor-derived platelets (Figure 5D).
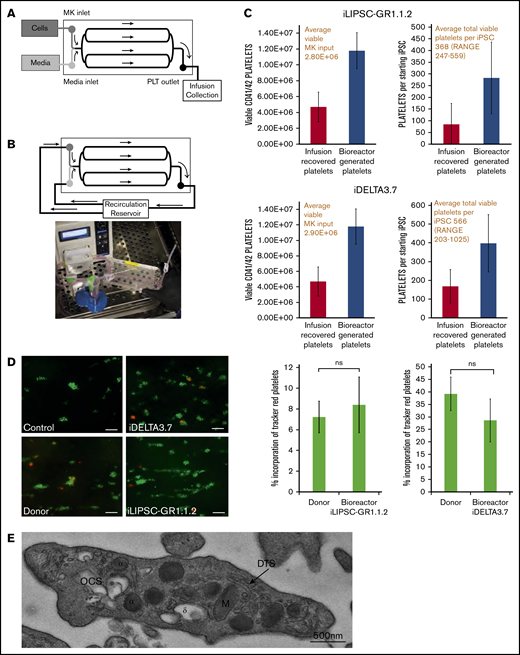
In vitro platelet production using a bioreactor. (A) Schematic of a bioreactor (Platelet BioGenesis) set up during the MK-seeding step. (B) Schematic of the bioreactor set up during the recirculation (PLP production) step, and photograph of setup. (C) Bar graphs for n = 3 runs of the bioreactor for iLIPSC-GR1.1.2 (top) and iDELTA-3.7 n = 3 runs (below) showing the final viable platelet output (left). The number of viable MKs input are shown in red above and the number of viable platelets produced per starting iPSC (right) with the total per iPSC in red above. Red bars are infusion recovered platelets and blue bars bioreactor generated. (D) In vitro thrombus formation under flow. Left panel: representative images from control, donor blood, iDELTA-3.7, and iLIPSC-GR1.1.2 bioreactor-generated platelets. In vitro–derived or donor platelets (red) human donor platelets (green). Scale bars, 20 μm. Right panel: the percentage incorporation of Cell Tracker Red–stained platelets for n = 3 replicates (3 × 80 images per chip scored) for iLIPSC-GR1.1.2 (left) and iDELTA-3.7 (right). For both lines, the incorporation of donor platelets and bioreactor platelets in thrombi are not significantly different from each other. (E) Transmission electron microscopy of a bioreactor-generated platelet. Cross-section of a bioreactor-generated platelet from LIPSC-GR1.1 containing both α (α) and δ (δ) granules, open canicular system (OCS), dense tubular system (DTS), and mitochondria (M). Scale bar, 500 nm; original magnification ×5000.
In vitro platelet production using a bioreactor. (A) Schematic of a bioreactor (Platelet BioGenesis) set up during the MK-seeding step. (B) Schematic of the bioreactor set up during the recirculation (PLP production) step, and photograph of setup. (C) Bar graphs for n = 3 runs of the bioreactor for iLIPSC-GR1.1.2 (top) and iDELTA-3.7 n = 3 runs (below) showing the final viable platelet output (left). The number of viable MKs input are shown in red above and the number of viable platelets produced per starting iPSC (right) with the total per iPSC in red above. Red bars are infusion recovered platelets and blue bars bioreactor generated. (D) In vitro thrombus formation under flow. Left panel: representative images from control, donor blood, iDELTA-3.7, and iLIPSC-GR1.1.2 bioreactor-generated platelets. In vitro–derived or donor platelets (red) human donor platelets (green). Scale bars, 20 μm. Right panel: the percentage incorporation of Cell Tracker Red–stained platelets for n = 3 replicates (3 × 80 images per chip scored) for iLIPSC-GR1.1.2 (left) and iDELTA-3.7 (right). For both lines, the incorporation of donor platelets and bioreactor platelets in thrombi are not significantly different from each other. (E) Transmission electron microscopy of a bioreactor-generated platelet. Cross-section of a bioreactor-generated platelet from LIPSC-GR1.1 containing both α (α) and δ (δ) granules, open canicular system (OCS), dense tubular system (DTS), and mitochondria (M). Scale bar, 500 nm; original magnification ×5000.
Platelet transfusion in thrombocytopenic mice
To confirm the hemostatic effects of the in vitro–derived platelets, we used immunocompromised NOD, Cg-Rag1tm1MomIl2rgtm1Wjl/SzJ (NRG/J) mice. Mice were platelet depleted using an anti-CD42 mouse-specific antibody. Both blood counts postdepletion and flow cytometry confirmed that the animals were profoundly thrombocytopenic (supplemental Figure 7A). The mice were then transfused with either donor platelets (3.00E+07; n = 3), in vitro–derived platelets (3.00E+07; n = 2), or vehicle control (n = 7). Nondepleted mice were used as control (n = 6). Immediately after transfusion, the mouse tails were transected. The quantification of hemoglobin loss following transection at 4 minutes to 20 minutes served as proxy for blood loss at each time point. Figure 6A shows an amelioration of blood loss relative to the depleted vehicle control mice. Mice transfused with donor platelets showed a significant amelioration of bleeding by 96.3% of the depleted controls after 4 minutes whereas the bioreactor generated platelets decreased bleeding to a lesser extent by 65.2% (Figure 6A left panel). By 20 minutes, for both donor and bioreactor platelets, this dropped to 73.6% and 33% of the depleted controls, respectively (Figure 6A right panel). Flow cytometry analysis of whole blood taken after completion of the bleeding assay showed a population of human platelets in mice transfused with donor platelets (Figure 6B middle panel) and in mice transfused with in vitro–derived platelets (Figure 6B right panel). At the 20-minute time point, the proportion of the human platelet in the total platelet population present (mouse and human combined) was comparable for donor platelets and in vitro–derived platelets. We therefore think that the functional difference in this particular model between the 2 types of platelets cannot be explained by a difference in survival in circulation or consumption within the forming thrombus.
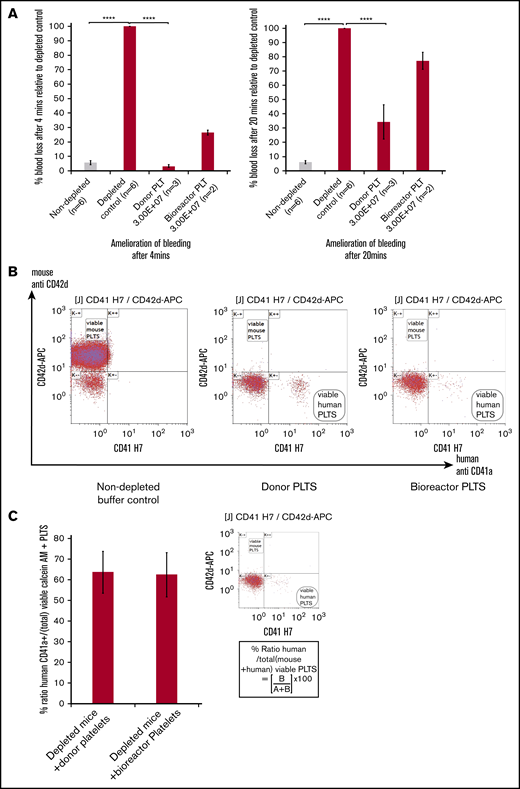
In vivo platelet transfusion and hemostasis model. (A, left) A significant change in percentage of blood loss in control undepleted mice (gray bar) compared with thrombocytopenic mice (red bars) in the hemostasis model after 4 minutes. Infusion of 3.00E+07 donor platelets decreased bleeding to 3.3% of the untransfused depleted control and 3.00E+07 bioreactor platelets to 34.3%. (A, right) Amelioration of bleeding has decreased by 20 minutes for both donor and bioreactor platelets. For both graphs: mean ± 1× SEM, for: nondepleted controls, n = 6; depleted controls, n = 6; donor platelets, n = 3; bioreactor platelets. Mean ± 1× SD; n = 2. One-way ANOVA for both 4 minutes and 20 minutes, nondepleted vs depleted controls ****P ≤ .0001, depleted controls vs donor platelets ****P ≤ .0001. (B) Flow cytometry dot plots showing analysis of mouse blood from inferior vena cava bleeds post-IV injection using 5 μL of mouse blood per sample stained with antibodies specific for mouse (CD42d APC) and human (CD41aAPCH7) platelets. Left panel, A viable mouse platelet population from a nondepleted buffer control. Middle panel, An animal receiving donor derived platelets. Right panel, In vitro bioreactor derived platelets indicating the clear presence of human platelets and a lack of positively staining mouse platelets in the CD42d+ window for profoundly thrombocytopenic mice. (C) Bar graph showing mean values for the percentage ratio of human platelets to total platelets in depleted mice (inset) using the formula (lower right quadrant human platelets (B)/upper left CD42d+ quadrant (A+B)) × 100. There is no significant difference between the 2 groups using the Student t test. Error bars indicate the range in values. Mean ± 1× SD; n = 3, donor platelets; n = 2, bioreactor platelets.
In vivo platelet transfusion and hemostasis model. (A, left) A significant change in percentage of blood loss in control undepleted mice (gray bar) compared with thrombocytopenic mice (red bars) in the hemostasis model after 4 minutes. Infusion of 3.00E+07 donor platelets decreased bleeding to 3.3% of the untransfused depleted control and 3.00E+07 bioreactor platelets to 34.3%. (A, right) Amelioration of bleeding has decreased by 20 minutes for both donor and bioreactor platelets. For both graphs: mean ± 1× SEM, for: nondepleted controls, n = 6; depleted controls, n = 6; donor platelets, n = 3; bioreactor platelets. Mean ± 1× SD; n = 2. One-way ANOVA for both 4 minutes and 20 minutes, nondepleted vs depleted controls ****P ≤ .0001, depleted controls vs donor platelets ****P ≤ .0001. (B) Flow cytometry dot plots showing analysis of mouse blood from inferior vena cava bleeds post-IV injection using 5 μL of mouse blood per sample stained with antibodies specific for mouse (CD42d APC) and human (CD41aAPCH7) platelets. Left panel, A viable mouse platelet population from a nondepleted buffer control. Middle panel, An animal receiving donor derived platelets. Right panel, In vitro bioreactor derived platelets indicating the clear presence of human platelets and a lack of positively staining mouse platelets in the CD42d+ window for profoundly thrombocytopenic mice. (C) Bar graph showing mean values for the percentage ratio of human platelets to total platelets in depleted mice (inset) using the formula (lower right quadrant human platelets (B)/upper left CD42d+ quadrant (A+B)) × 100. There is no significant difference between the 2 groups using the Student t test. Error bars indicate the range in values. Mean ± 1× SD; n = 3, donor platelets; n = 2, bioreactor platelets.
Discussion
Ultimately, the production of a transfusion unit will require further progress in each of these 2 phases of production: the liquid culture expansion of MKs and the platelet production in bioreactors. In addition, other crucial preclinical data will need to be acquired, including storage and shelf-life of the final product. Recovery and survival studies of transfused platelets in humans, however, require 1 × 10¹⁰ platelets and will probably represent the first (and necessary) human studies with in vitro–derived platelets. The number and the quality of functional platelets, produced in GMP media from clinical-grade cell lines demonstrated in this manuscript, pave the way for such studies to take place in the very near future.
For data sharing, please contact Cedric Ghevaert at cg348@cam.ac.uk.
Acknowledgments
The authors thank Mark Kotter for the kind gift of the OPTi-OX system targeting vector. The authors acknowledge the Medical Genetics Service of Cambridge University Hospitals for karyotyping and single-nucleotide polymorphism arrays, the Cambridge Advanced Imaging Centre (CAIC) for transmission electron microscopy (TEM) sample preparation, and Paquita Nurden for an expert opinion on the TEM images.
Generation of the GMP line LiPSC-GR1.1 was supported by the National Institutes of Health (NIH) Common Fund Regenerative Medicine Program, and was reported in Stem Cell Reports. The NIH Common Fund and the National Center for Advancing Translation Sciences are joint stewards of the LiPSC-GR1.1 resource. Research in the Ghevaert laboratory was supported by core funding from Wellcome and MRC to the Wellcome–MRC Cambridge Stem Cell Institute.
Authorship
Contribution: A.L.E. wrote the paper, designed and tested the AMK media, performed viral and inducible FoP experiments (static and bioreactor), and created inducible lines; A.D. carried out all of the cloning required to create the polycistronic vector, as well other constructs used to create the inducible lines, and also created the first inducible line (data not included); M. Lawrence carried out the transfer to GMP and performed GMP experiments; M.T. and H.R.F. tested AMK in cord-blood MKs; C.G. supervised the project, wrote the paper, and is a part of the Platelet BioGenesis Scientific Advisory Board; T.M. supervised the project; A.L.E., D.H., A.K.W., H.R.F., and M. Lehmann contributed to the bioreactor work; A.W., H.R.F., and S.M. contributed to the in vivo experiments; and, of the Platelet BioGenesis team, A.B., J.V., and M. Lehmann contributed to the bioreactor data, J.T. is the co-founder and Chief Scientific Officer, and J.I. is co-founder, generated data with bioreactor-derived platelets, and participated in the design.
Conflict-of-interest disclosure: J.T. and J.I. are co-founders of Platelet BioGenesis. The authors declare no competing financial interests.
Correspondence: Cedric Ghevaert, Wellcome–MRC Cambridge Stem Cell Institute, Jeffrey Cheah Biomedical Centre, Cambridge Biomedical Campus, University of Cambridge, Puddicombe Way, Cambridge CB2 0AW, United Kingdom; e-mail: cg348@cam.ac.uk.

